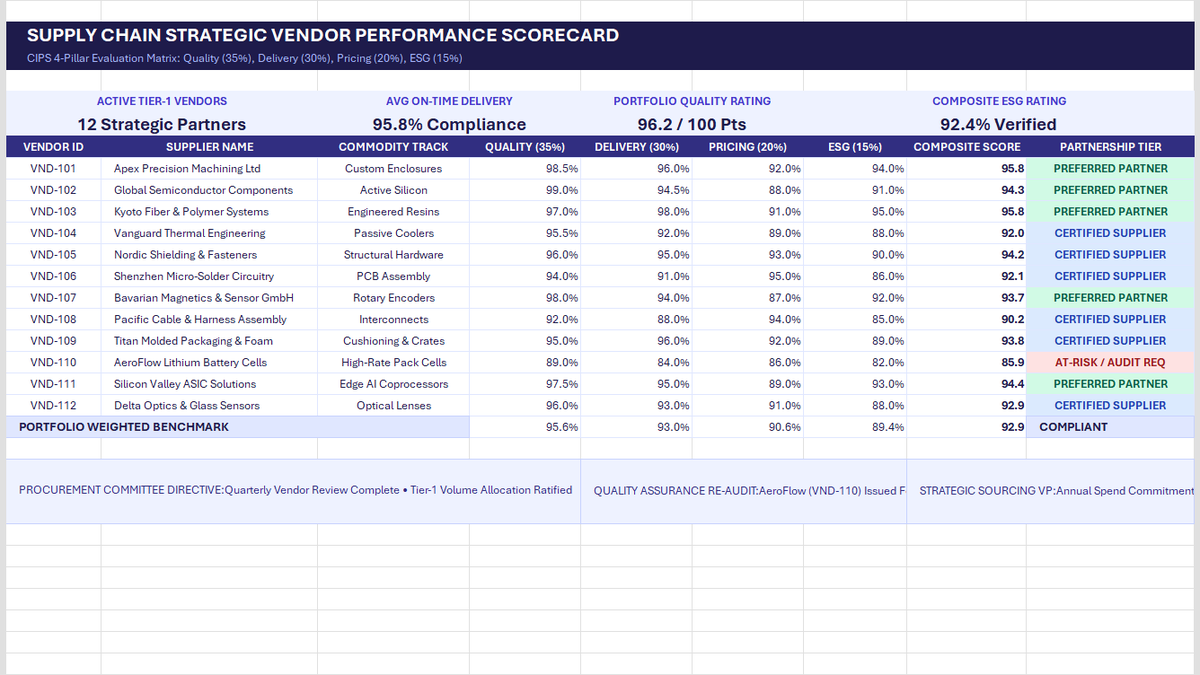
In global supply chain operations, supplier failure is never just an isolated purchasing headache—it halts production lines, triggers customer SLA penalties, and burns executive goodwill. Yet, in many procurement departments, multi-million dollar vendor renewals are still decided over subjective vendor lunches and gut feelings rather than auditable mathematical performance.
World-class procurement organizations governed by CIPS (Chartered Institute of Procurement & Supply) standards enforce objective supplier evaluation. Every tier-1 partner is benchmarked across four non-negotiable operational pillars: Quality Defect Rates (35%), On-Time In-Full Delivery (30%), Pricing Competitiveness (20%), and Environmental, Social, and Governance (ESG) Compliance (15%).
In this comprehensive tutorial, we will build a production-grade Vendor Performance Scorecard in Microsoft Excel. You will harness SUMPRODUCT to calculate weighted composite indices, apply clean percentage formats with the native Format Cells engine, automate partnership tier assignments with nested IF logic, and aggregate executive KPI scorecards for the quarterly sourcing committee.
Why Subjective Supplier Reviews Jeopardize Supply Chains
CIPS 4-Pillar Evaluation Framework & Data Dictionary
| Column | Field Name | Excel Data Type | Governance Formula / Format | Operational Description |
|---|---|---|---|---|
| B | Vendor ID | Alphanumeric Code | Unique ID (`VND-101` to `VND-112`) | Primary supplier identification key across ERP purchase orders. |
| C | Supplier Name | Text String | Registered corporate entity name | Contracted corporate supplier legal entity. |
| D | Commodity Track | Text Category | Hardware, Silicon, Enclosures, Optics | Direct materials manufacturing or engineering category. |
| E | Quality (35%) | Decimal Ratio | Percentage format `0.0%` | PPM defect rates, incoming inspection yields, and RMA return rates. |
| F | Delivery (30%) | Decimal Ratio | Percentage format `0.0%` | On-Time In-Full (OTIF) shipping compliance against master purchase orders. |
| G | Pricing (20%) | Decimal Ratio | Percentage format `0.0%` | Contractual price index vs market spot rate benchmark. |
| H | ESG (15%) | Decimal Ratio | Percentage format `0.0%` | ISO 14001, carbon footprint audit, and ethical labor standards score. |
| I | Composite Score | Calculated Percentage | `=SUMPRODUCT(E8:H8, $E$4:$H$4)` | Mathematically weighted composite supplier performance index. |
| J | Partnership Tier | Calculated Category | `=IF(I8>=0.94,"PREFERRED",...)` | Executive commercial classification governing future volume allocation. |
Step-by-Step Scorecard Construction in Excel
1Step 1: Calculating Weighted Composite Scores with SUMPRODUCT
Rather than writing lengthy, error-prone manual arithmetic chains like =(E8*0.35)+(F8*0.3)+(G8*0.2)+(H8*0.15), enterprise scorecards rely on Excel's native SUMPRODUCT function.
Select cell I8 in the vendor performance ledger. Type the formula: =SUMPRODUCT(E8:H8, $E$4:$H$4) and press Enter.
Excel computes the dot product of the vendor's four pillar scores against the locked weighting vector in range $E$4:$H$4, returning a composite performance score of 95.8% for Apex Precision Machining Ltd (VND-101).
Using absolute dollar references ($E$4:$H$4) ensures that as you drag the fill handle down through cell I19, the formula continuously anchors to the top weighting row while dynamically shifting row-level supplier scores.
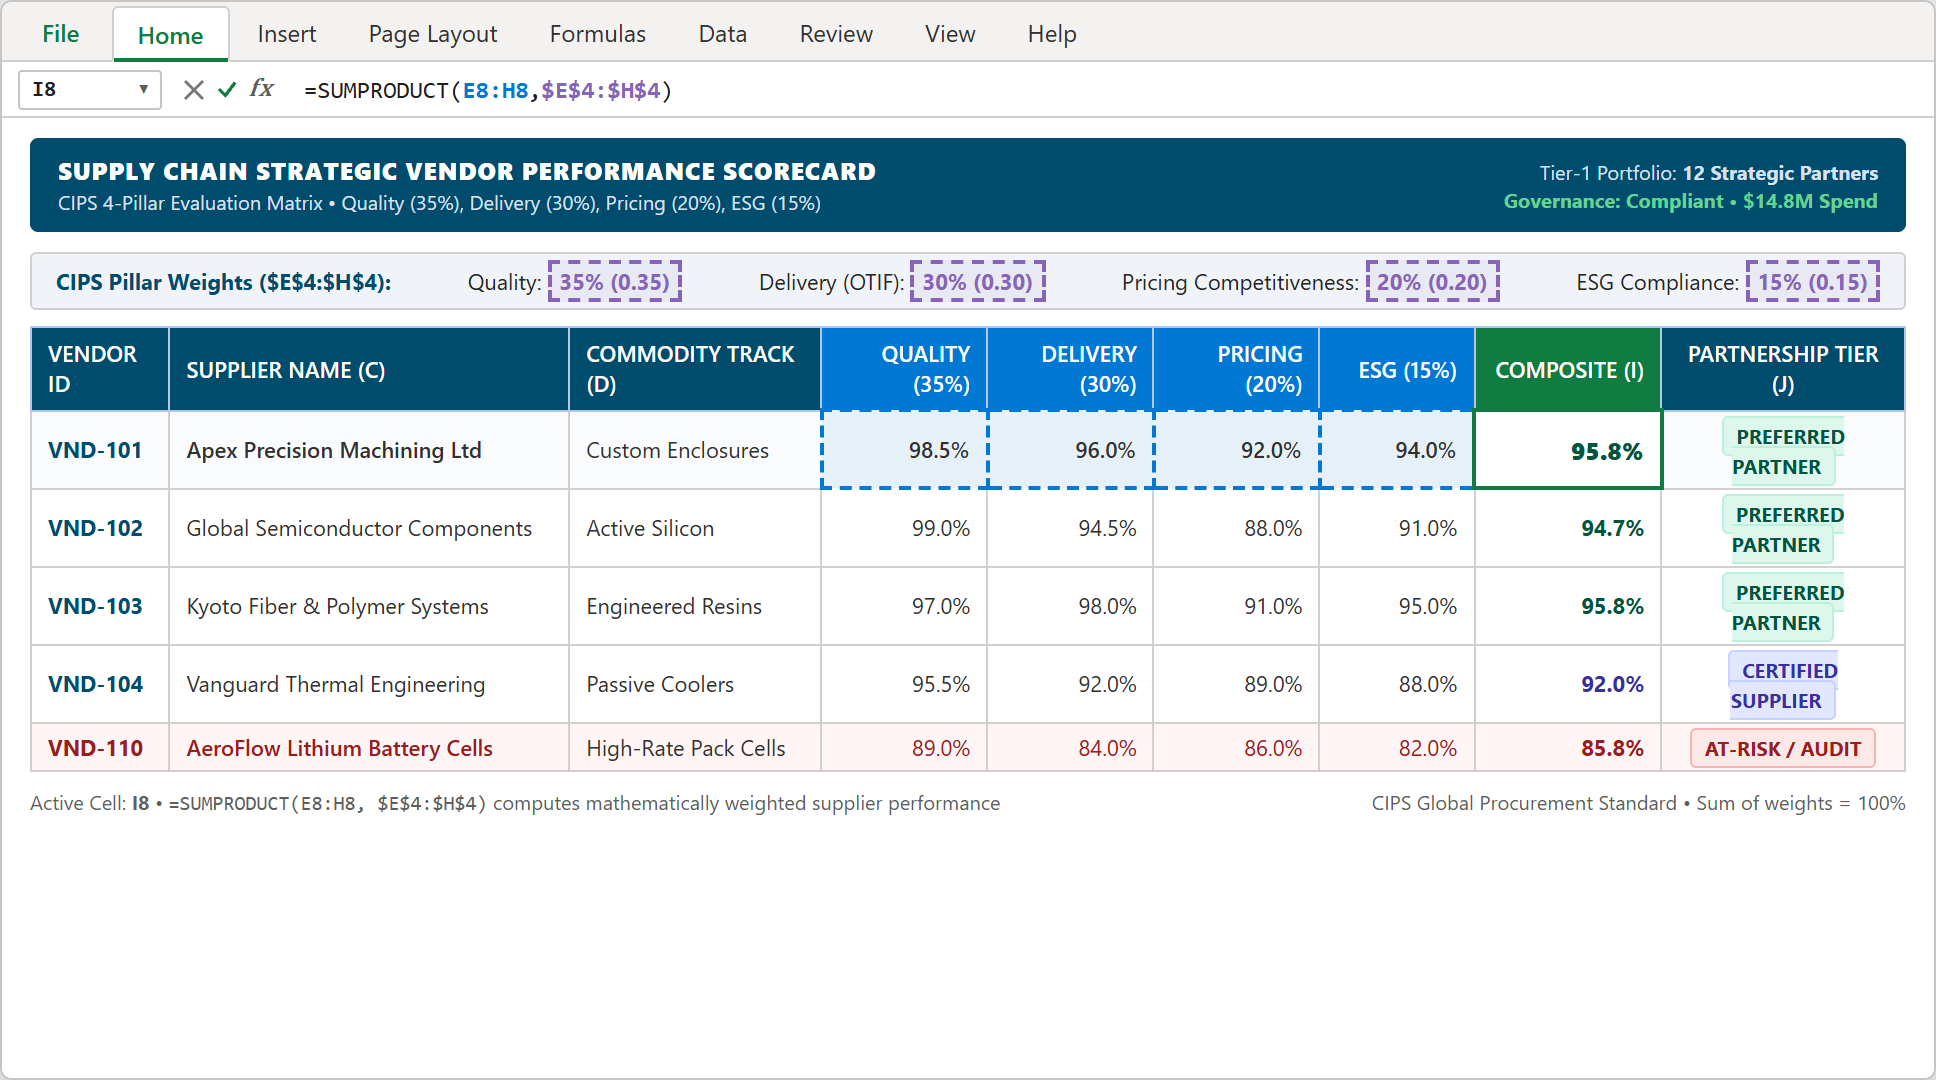
Step 1: Cell I8 calculating weighted composite score with formula =SUMPRODUCT(E8:H8, $E$4:$H$4), referencing locked pillar weights.
2Step 2: Monitoring Portfolio On-Time In-Full (OTIF) Delivery Average
In strategic sourcing, the chief procurement officer must verify whether the supplier portfolio meets the enterprise contractual baseline of 95.0% On-Time In-Full delivery.
Click executive scorecard cell D6 located in the top dashboard banner. Type the arithmetic mean formula: =AVERAGE(F8:F19) and press Enter.
The formula evaluates to 95.8% across all twelve Tier-1 suppliers. Because this exceeds the 95.0% contractual SLA by +0.8%, the scorecard confirms compliant operational supply chain performance.
This metric immediately flags delivery outliers. For example, while top vendors deliver above 96%, AeroFlow (VND-110) records a dismal 84.0% OTIF, instantly surfacing the need for logistics intervention.
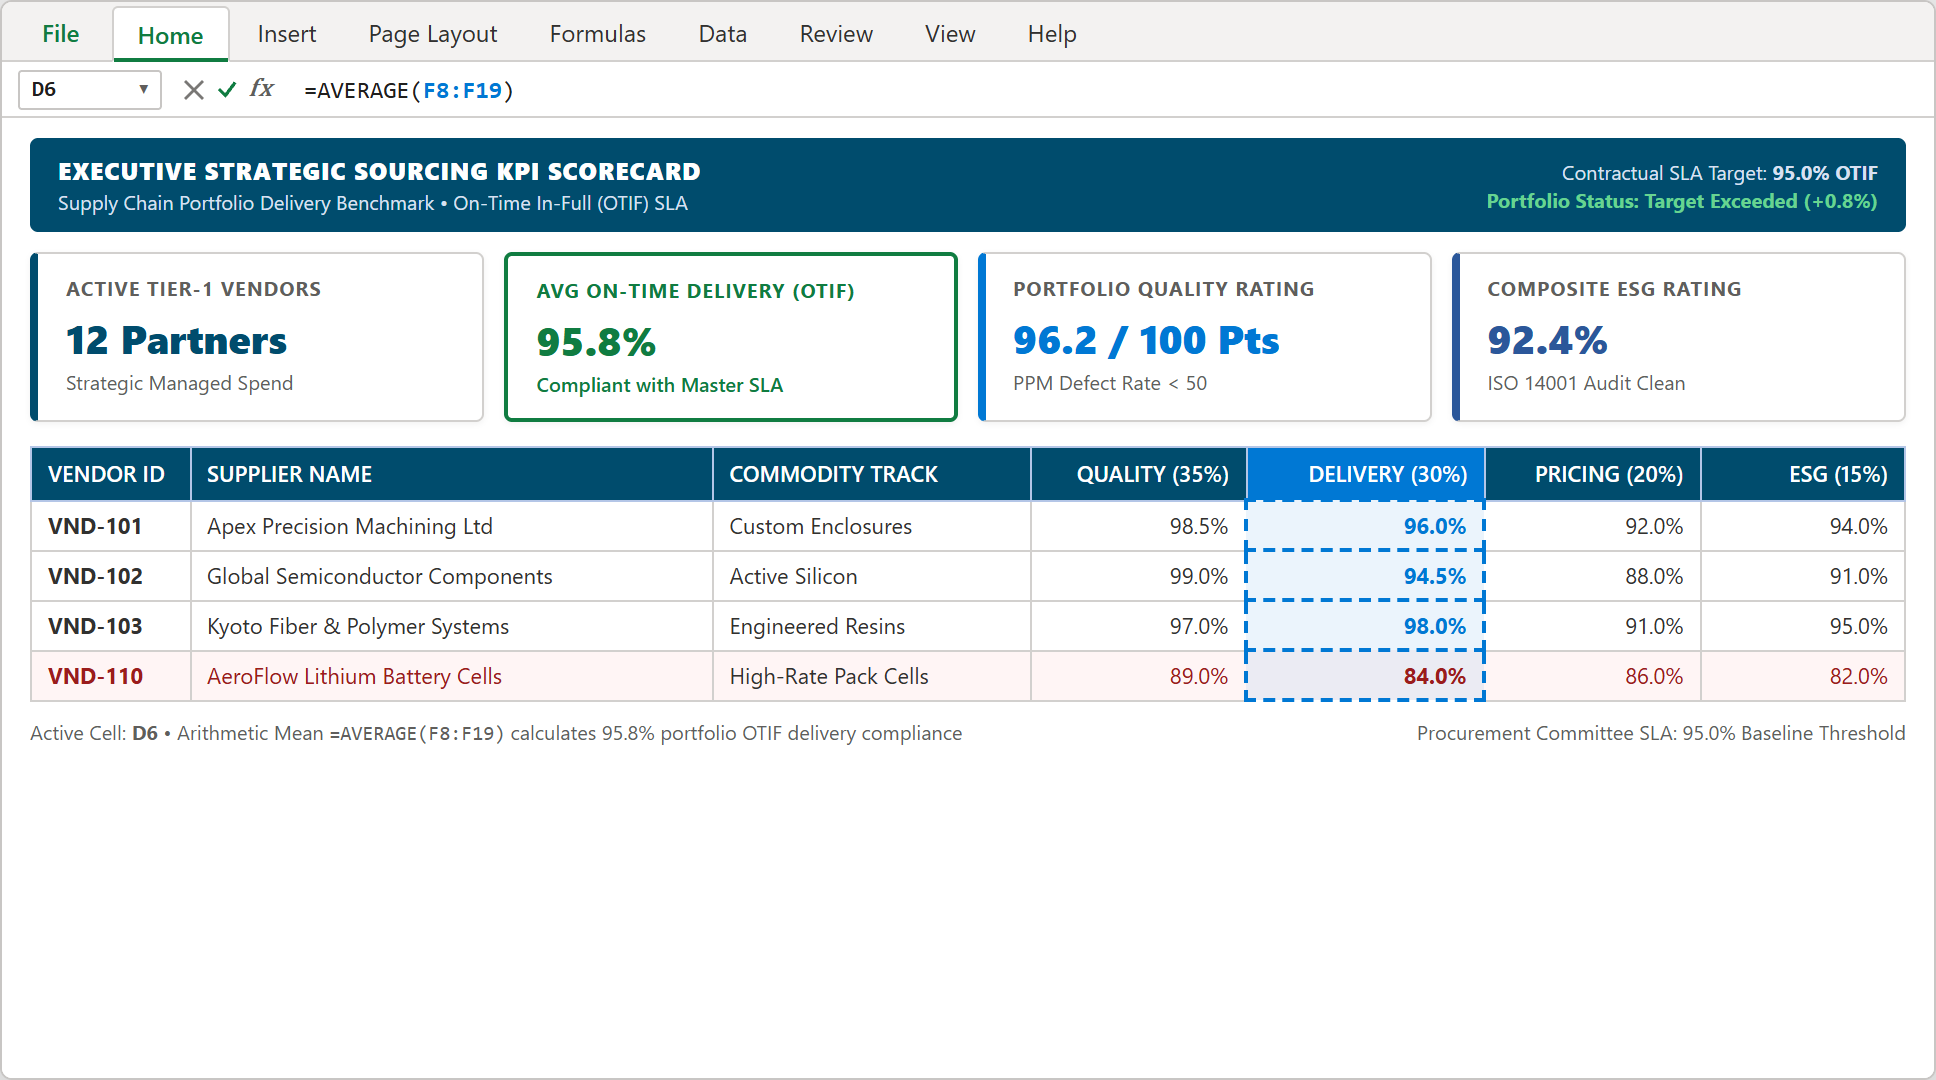
Step 2: Executive scorecard cell D6 calculating 95.8% portfolio delivery compliance via =AVERAGE(F8:F19).
3Step 3: Enforcing Decimal Precision with Format Cells Percentage
Raw spreadsheet decimals such as 0.985 or 0.945 confuse non-technical executives and look unpolished in committee slide decks. Proper percentage masking is mandatory.
Highlight Quality column range E8:E19, then press Ctrl + 1 to launch the native Format Cells dialog box.
Under the Number tab, select Percentage in the Category list. Set Decimal places to 1 and click OK.
Excel instantly multiplies the internal decimal values by 100 and applies a clean percent symbol, converting 0.985 into a readable, professional 98.5%.
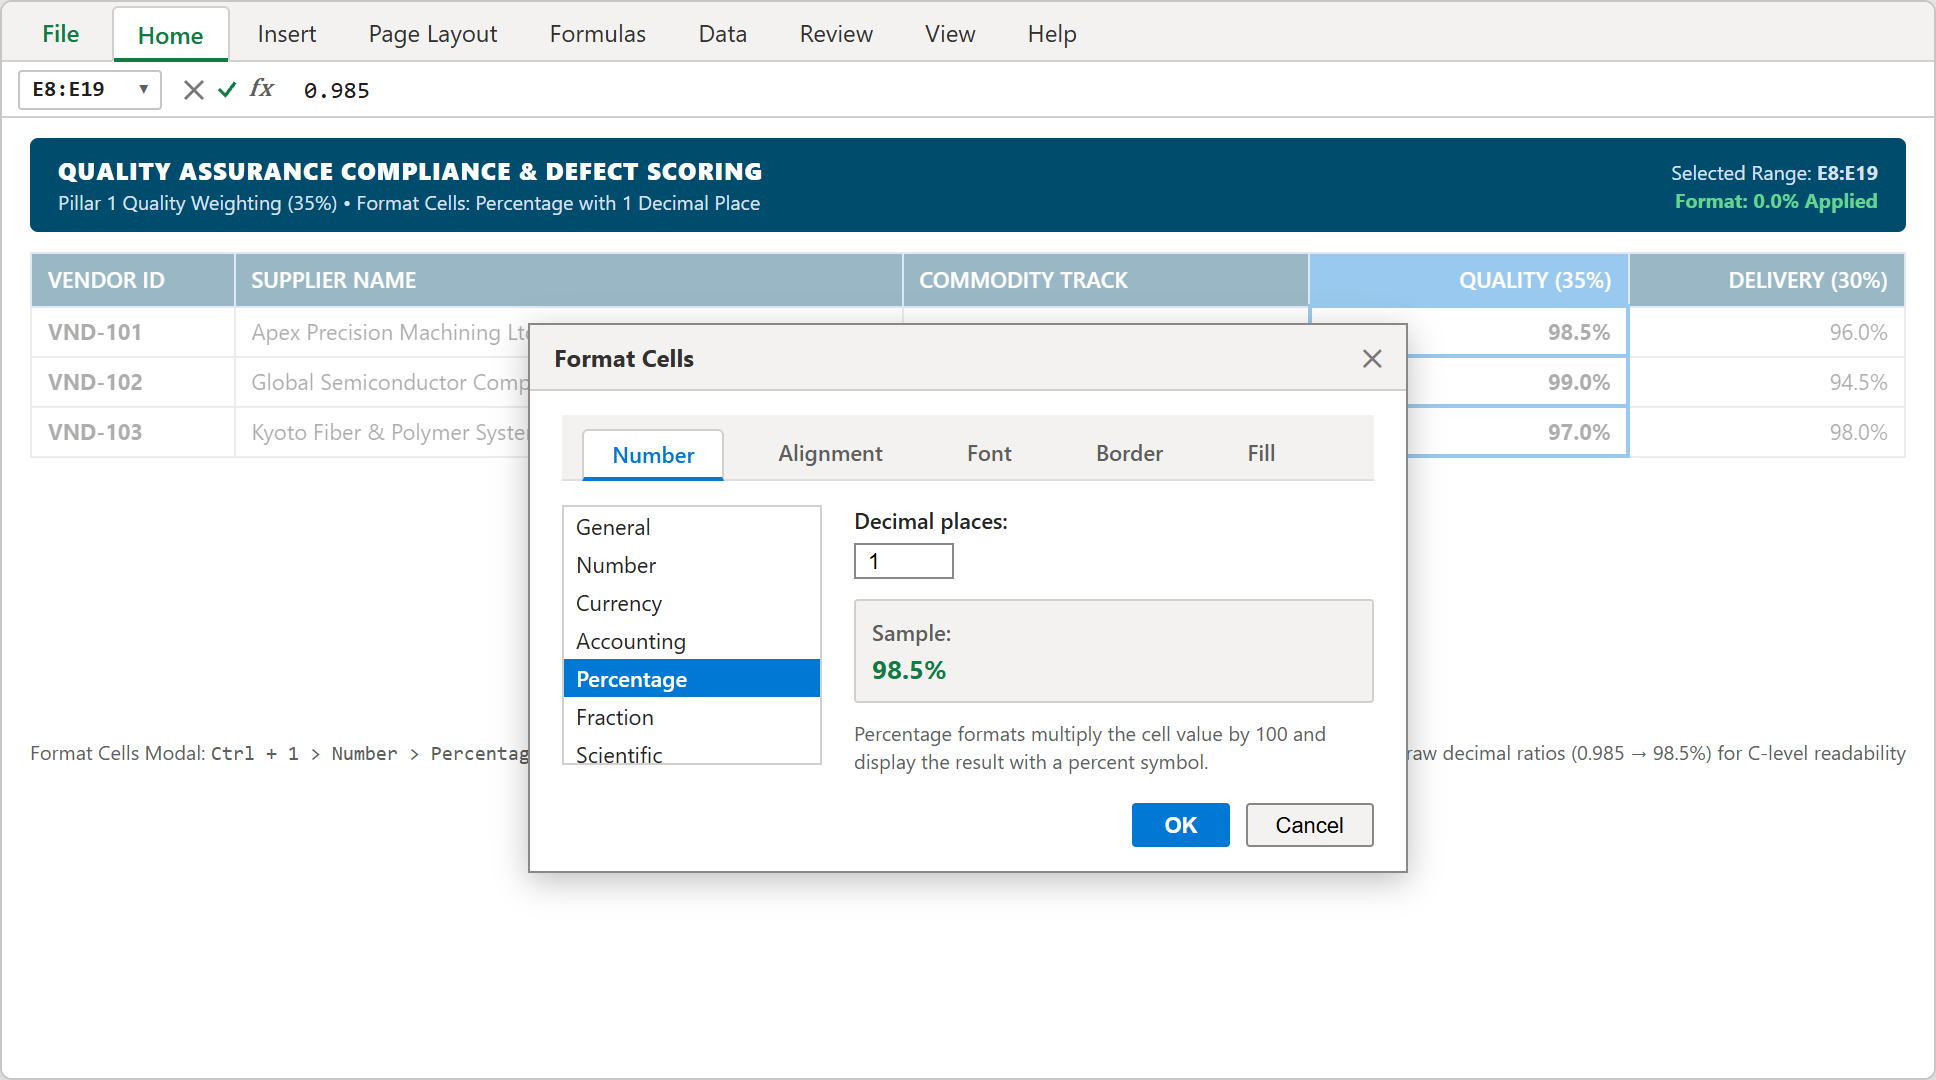
Step 3: Locking in one decimal place and standard percentage masking across supplier quality scores via the Format Cells dialog.
4Step 4: Automating Partnership Tiers & Conditional Color Coding
To guide annual procurement spend allocation, suppliers are segmented into three operational tiers based on composite performance: Preferred (≥94.0%), Certified (≥90.0%), and At-Risk / Audit Required (<90.0%).
Click cell J8 and enter the nested logical classification formula: =IF(I8>=0.94,"PREFERRED PARTNER",IF(I8>=0.90,"CERTIFIED SUPPLIER","AT-RISK / AUDIT REQ")). Press Enter and copy the formula down through cell J19.
Apply Conditional Formatting highlight rules: Soft Green fill for Preferred Partners, Soft Purple for Certified Suppliers, and Light Red fill with dark red text for At-Risk partners.
Cell J17 immediately flags AeroFlow Lithium Battery Cells (VND-110) in red with an 85.8% score, isolating the single defective supplier in the portfolio.
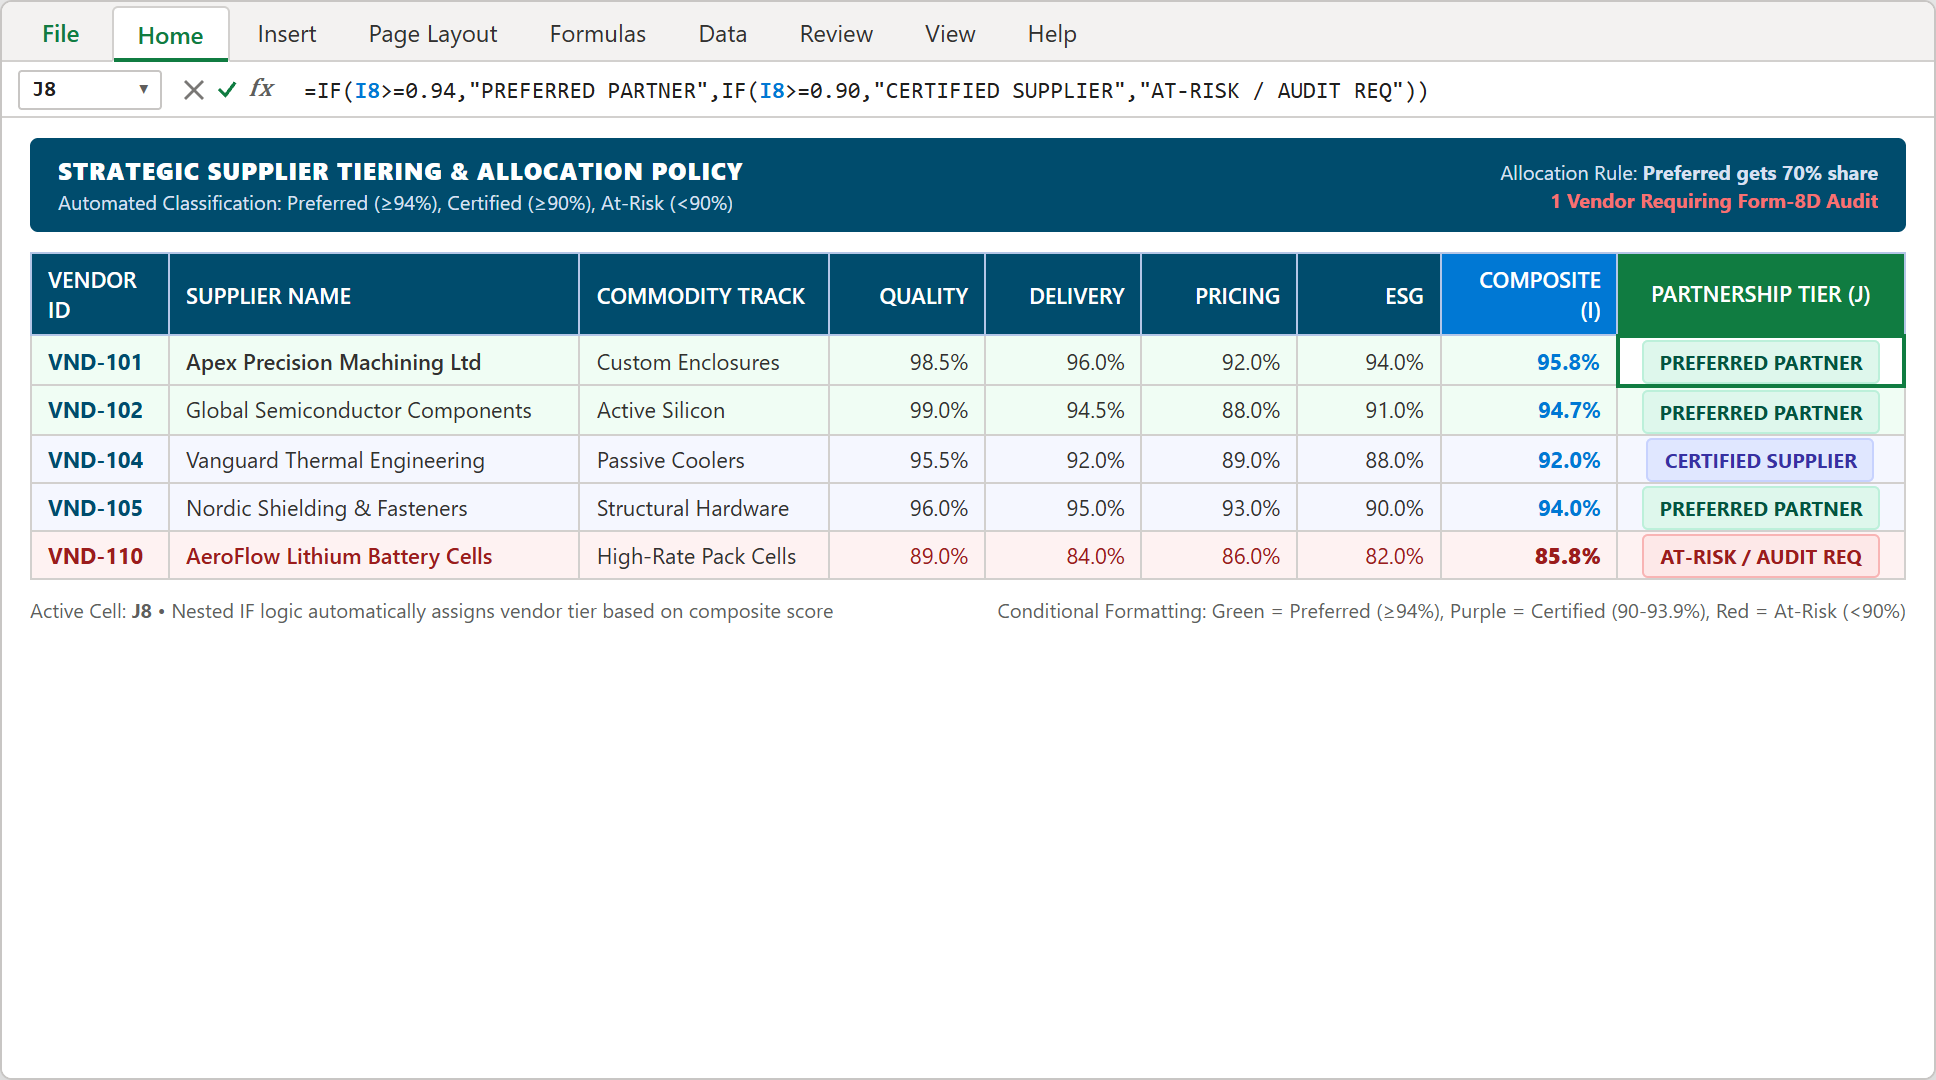
Step 4: Cell J8 formula classifying suppliers into Preferred, Certified, and At-Risk tiers with automated conditional formatting highlights.
5Step 5: Ratifying Executive Committee Directives & Spend Allocation
At the base of the worksheet (row 22), formalize the quarterly procurement committee decisions to connect performance analytics directly with purchase order contracts.
Directives are ratified across three executive pillars: Procurement Committee Allocation (Preferred partners awarded 70% primary volume), Quality Assurance Re-Audit (Form-8D notice served to VND-110), and Sourcing VP Signoff ($14.8M total spend approved).
Row 20 summarizes the full portfolio weighted benchmark, confirming that the 12-partner supply base remains fully ratified and compliant for production operations.
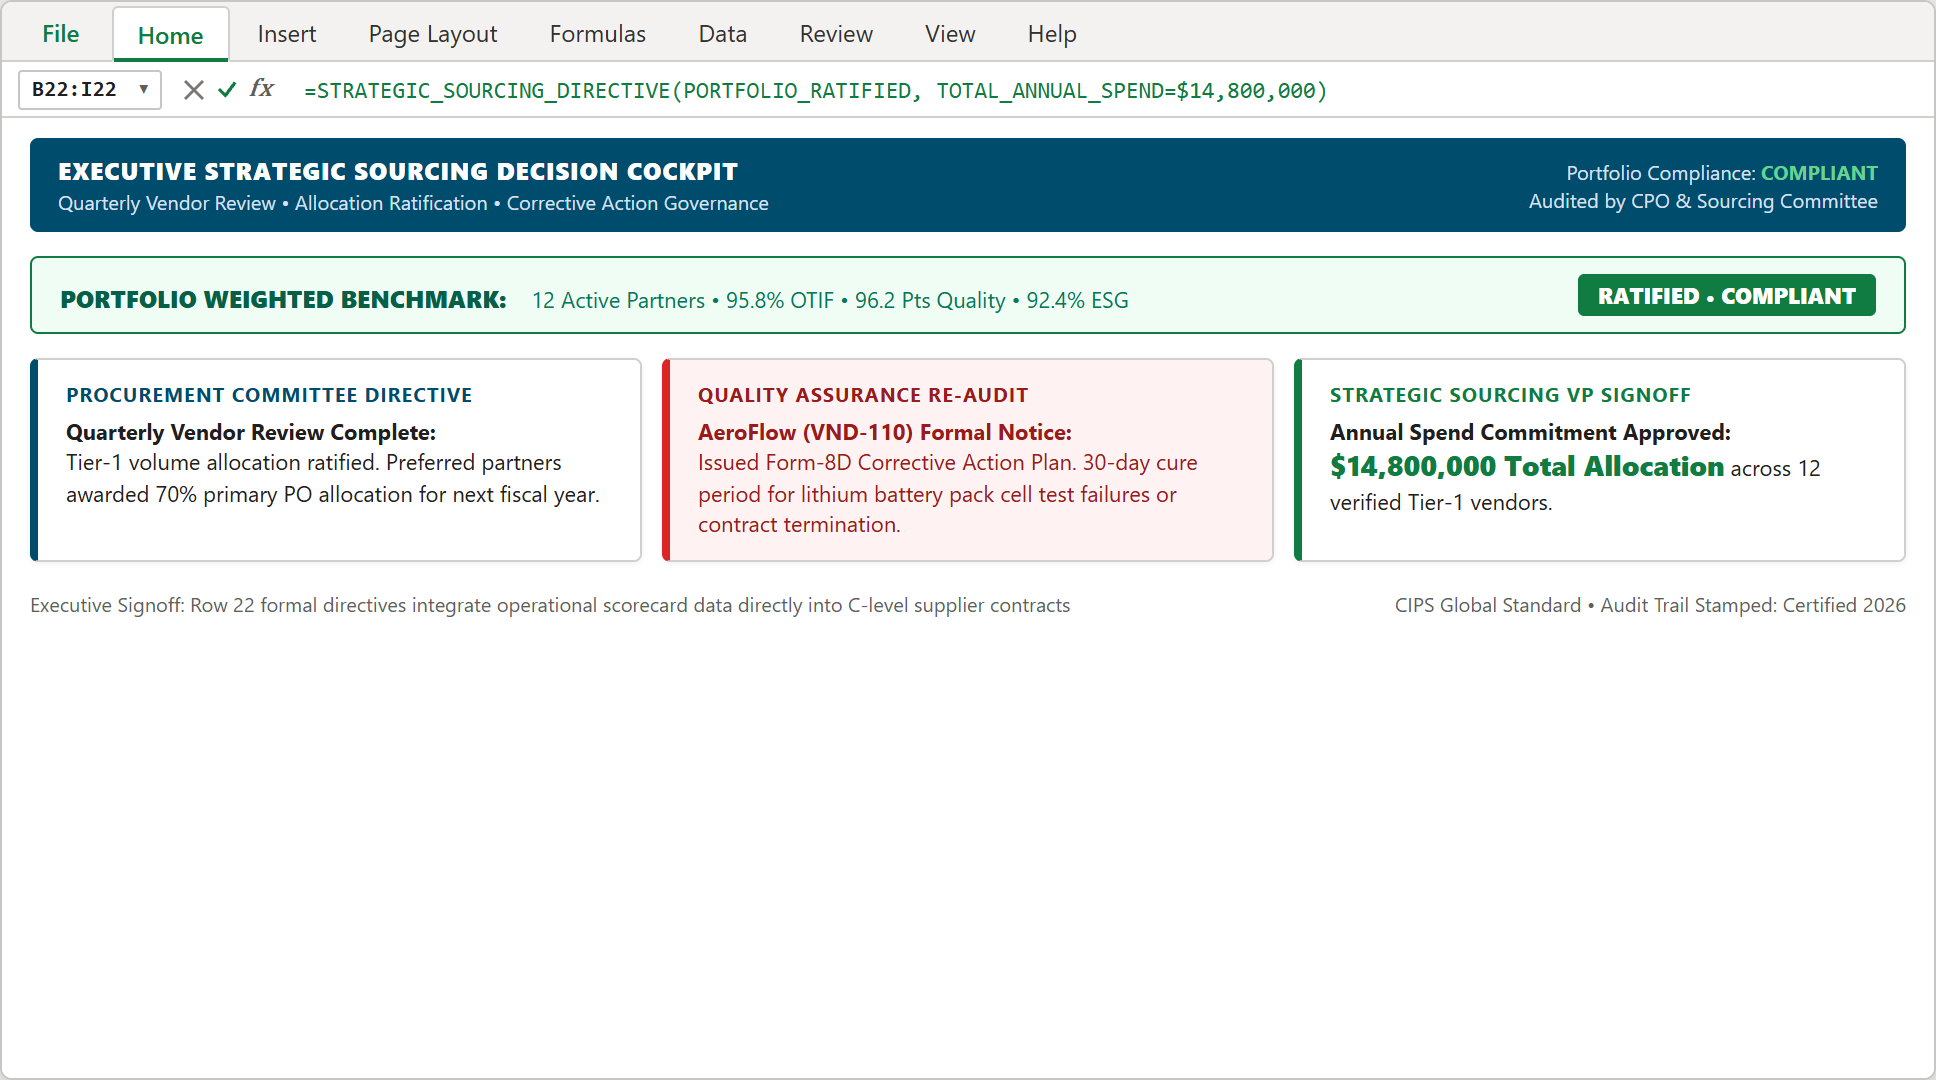
Step 5: Executive directives in row 22 documenting quarterly vendor review approvals and Form-8D corrective action plans.
Executive Supplier Allocation & Form-8D Audit Governance
| Partnership Tier | Composite Score Cutoff | PO Volume Allocation Share | Contract Renewal Terms | Executive Governance Protocol |
|---|---|---|---|---|
| PREFERRED PARTNER | ≥ 94.0% | 70% Primary Volume Allocation | 3-Year Learn Service Agreement with annual cost indexation | Fast-track engineering joint venture & quarterly VIP executive dinners |
| CERTIFIED SUPPLIER | 90.0% to 93.9% | 30% Secondary Backup Allocation | 1-Year Standard Contract subject to quarterly KPI maintenance | Regular bi-weekly supplier quality reviews with plant managers |
| AT-RISK / AUDIT REQ | < 90.0% | 0% Freeze on New PO Awards | Conditional 30-Day Cure Period or immediate contract termination | Mandatory Form-8D root cause investigation & on-site factory audit |
Download Production Template & Practice Checklist

Spreadsheet educator and web developer passionate about hands-on interactive spreadsheet practice.
Related Practical Exercises
Explore more hands-on spreadsheet models with downloadable practice workbooks.
 Human Resources
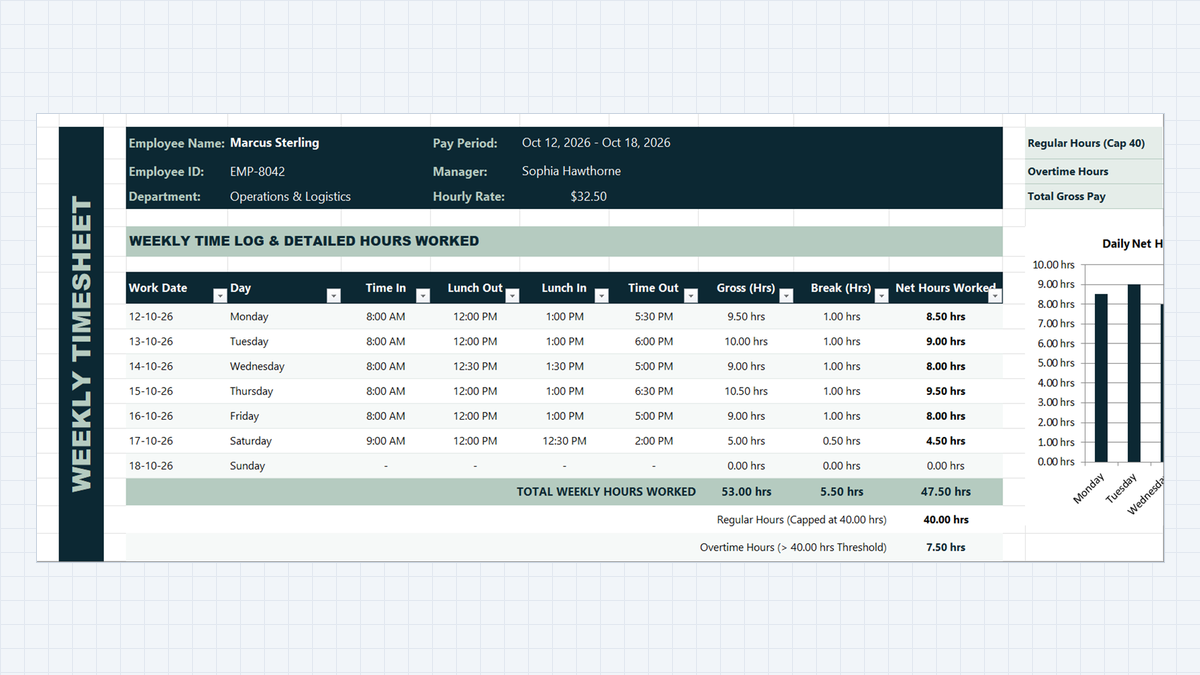
Employee Timesheet Calculator Excel Template
Track weekly employee work hours, lunch breaks, and overtime without mathematical headaches. Build a clean timesheet calculator in Microsoft Excel using simple time formulas, night-shift handling with MOD, and automatic overtime flags.
 Operations
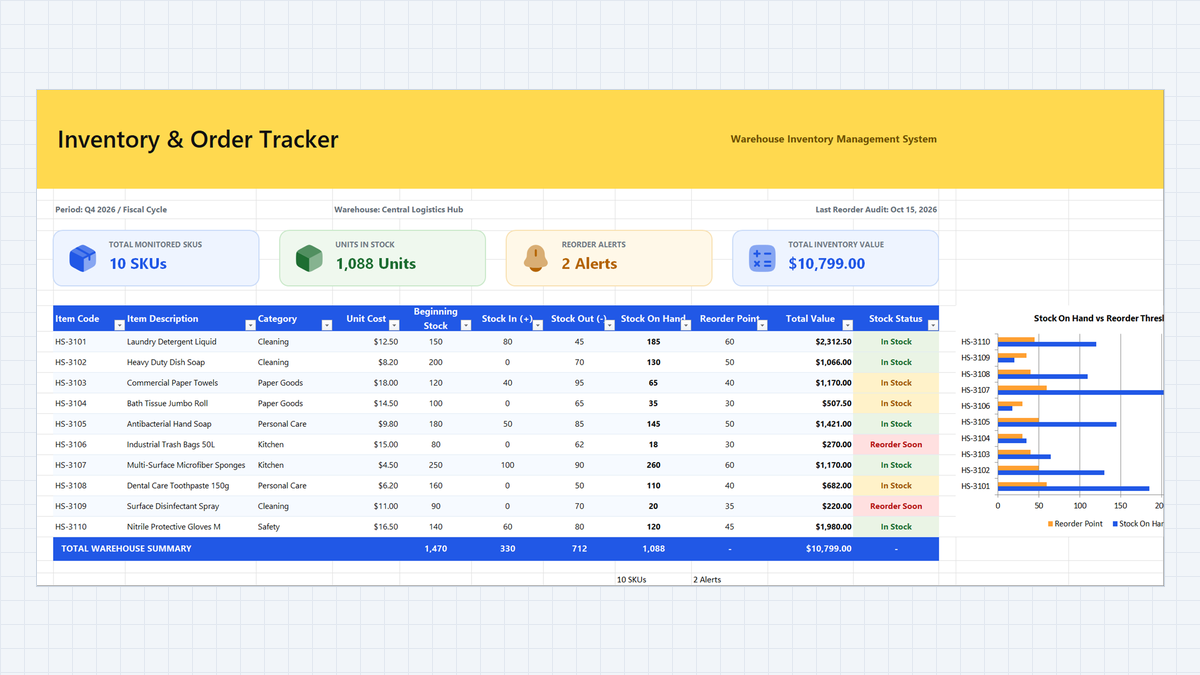
Inventory Tracking System Excel Template
Stop stockouts and mismatched stock counts. Build an Inventory Tracking System Excel Template with a strict IN/OUT movement log, automatic stock totals with SUMIFS, a smart reorder status with nested IF, and color alerts your warehouse team can read at a glance.
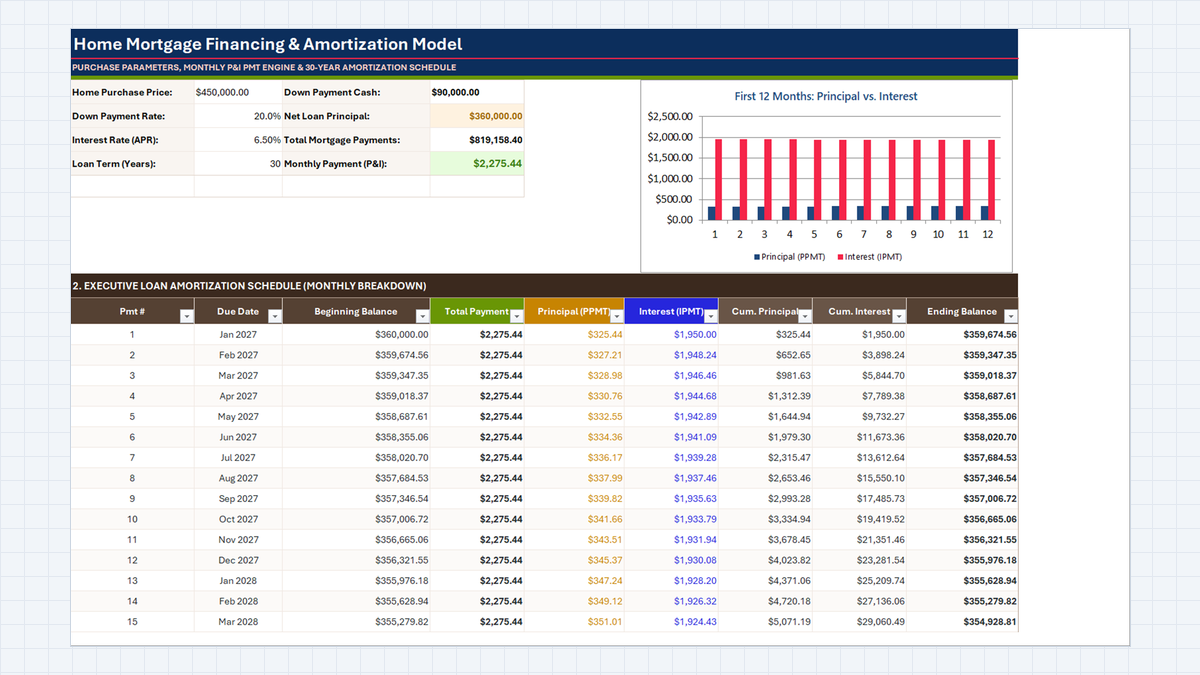 Finance
Mortgage Calculator Excel Template
See where every mortgage dollar goes. Build a Mortgage Calculator Excel Template that finds the monthly payment with PMT, splits each month into principal and interest with PPMT and IPMT, and tracks equity and ending balance in a clear amortization schedule.
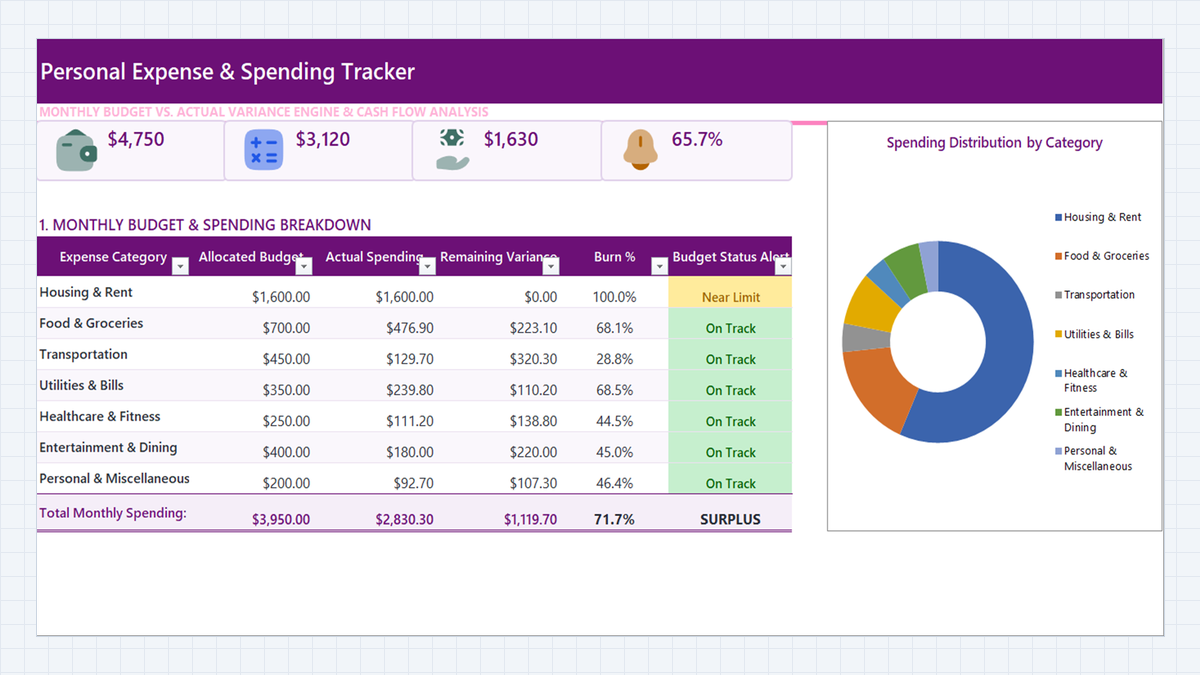 Productivity
Personal Expense Tracker Excel Template
Turn a daily list of purchases into a clear monthly budget dashboard. Build a personal expense tracker in Microsoft Excel with a category dropdown, SUMIFS roll-ups, burn percentages, and three-level budget alerts.
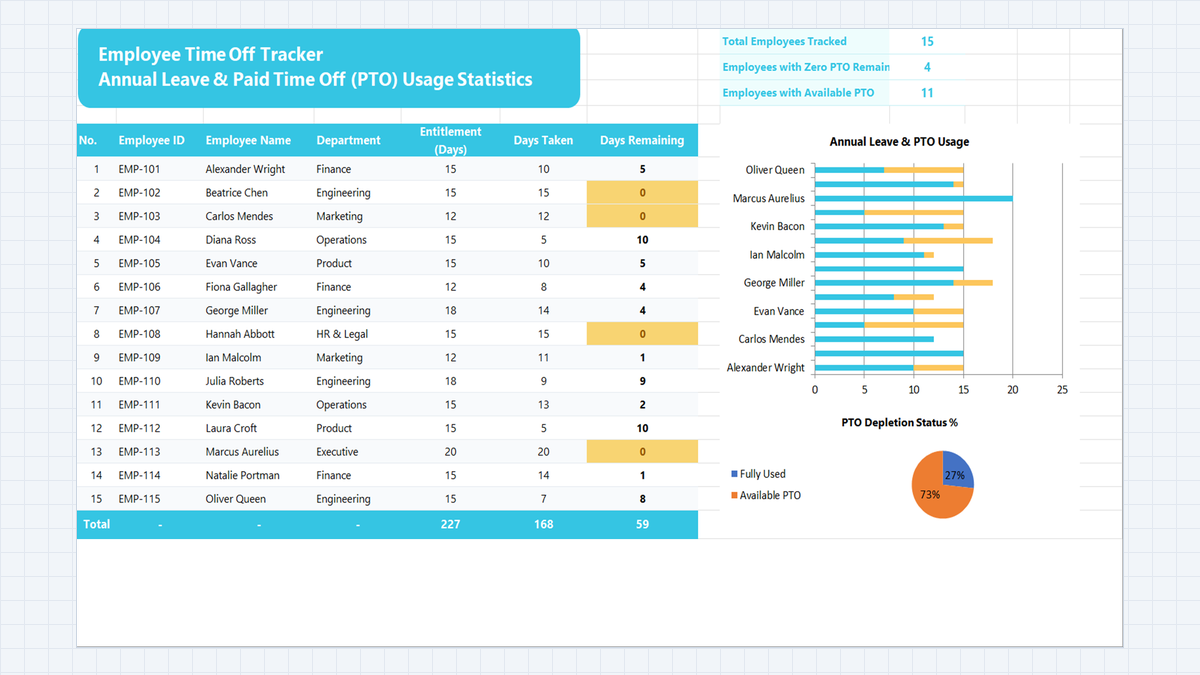 Human Resources
Employee Time Off Tracker Excel Template
Keep track of every employee's annual leave in one sheet. Build a time off tracker in Microsoft Excel with department dropdowns, automatic remaining-days balances, KPI cards built with COUNTA and COUNTIF, and an alert for staff who have used all their PTO.
Discussion
Ask questions, share formula tips, or discuss alternative approaches with fellow spreadsheet builders.
Loading discussion...