Plenty of people earn enough and still wonder why their savings never grow. The money does not vanish in one big purchase. It leaks out through coffees, subscriptions, and dinners that nobody wrote down.
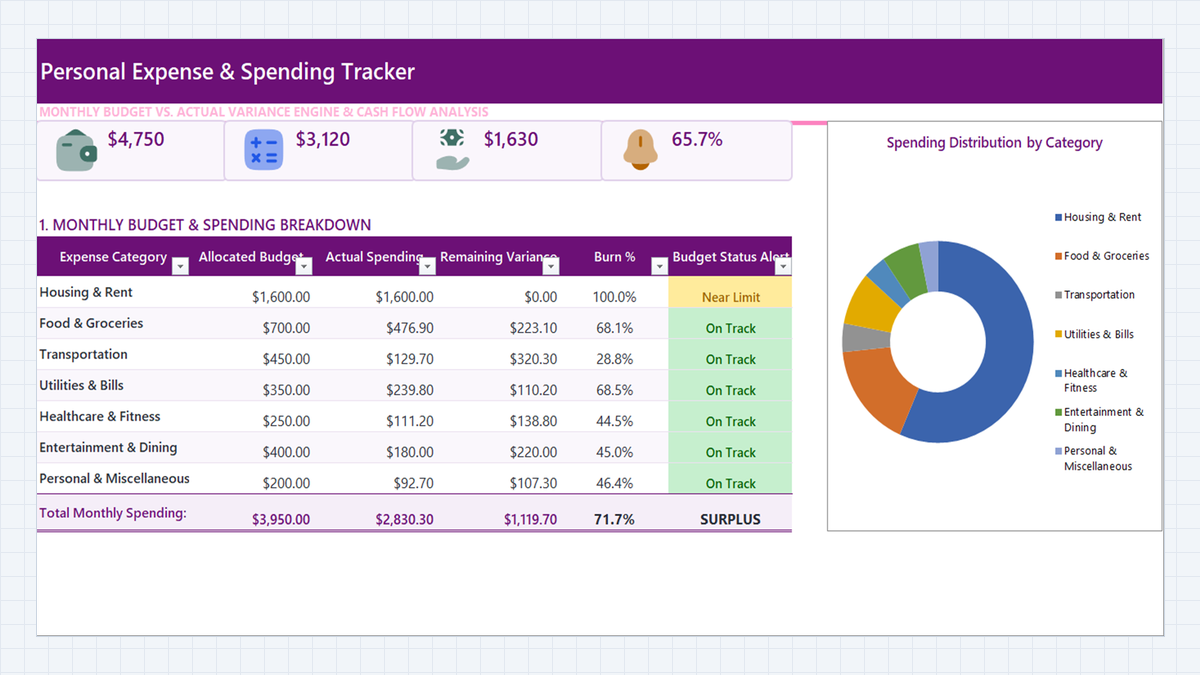
This Personal Expense Tracker Excel Template connects a daily log to a monthly dashboard. Every purchase you enter flows into a category total, and the sheet tells you when a budget is getting tight.
Why Savings Never Grow: Spending You Never Wrote Down
What a Personal Expense Tracker Excel Template Must Contain
- Category budgets: a spending limit for each area of life.
- Daily ledger: date, category, description, amount, and payment account for every purchase.
- SUMIFS roll-up: automatic totals from the ledger into each budget line.
- Burn % and remaining balance: how much of each budget is used, and how much is left.
- Budget alert: On Track, Near Limit (85% or more), or Over Budget.
| Part | Sheet and Cells | What It Does |
|---|---|---|
| Category budgets | Monthly Dashboard, B9:C15 | Seven categories with budgets from $200 to $1,600 |
| Daily ledger | Daily Expense Log, B4:F24 | Twenty purchases from October 1 to 29 |
| Actual spending | Monthly Dashboard, D9:D15 | Pulls each category total from the ledger |
| Variance and burn % | Monthly Dashboard, E9:F15 | Shows money left and percentage used |
| Status alert | Monthly Dashboard, G9:G15 | Labels each category and colors it |
| Totals row | Monthly Dashboard, row 16 | $3,950.00 budget, $2,830.30 spent, SURPLUS |
Build the Tracker in 5 Steps
Daily Expense Log and Monthly Dashboard. List the seven categories and their budgets on the dashboard first, because the log will borrow those names.1Step 1: Add a Category Dropdown to the Log
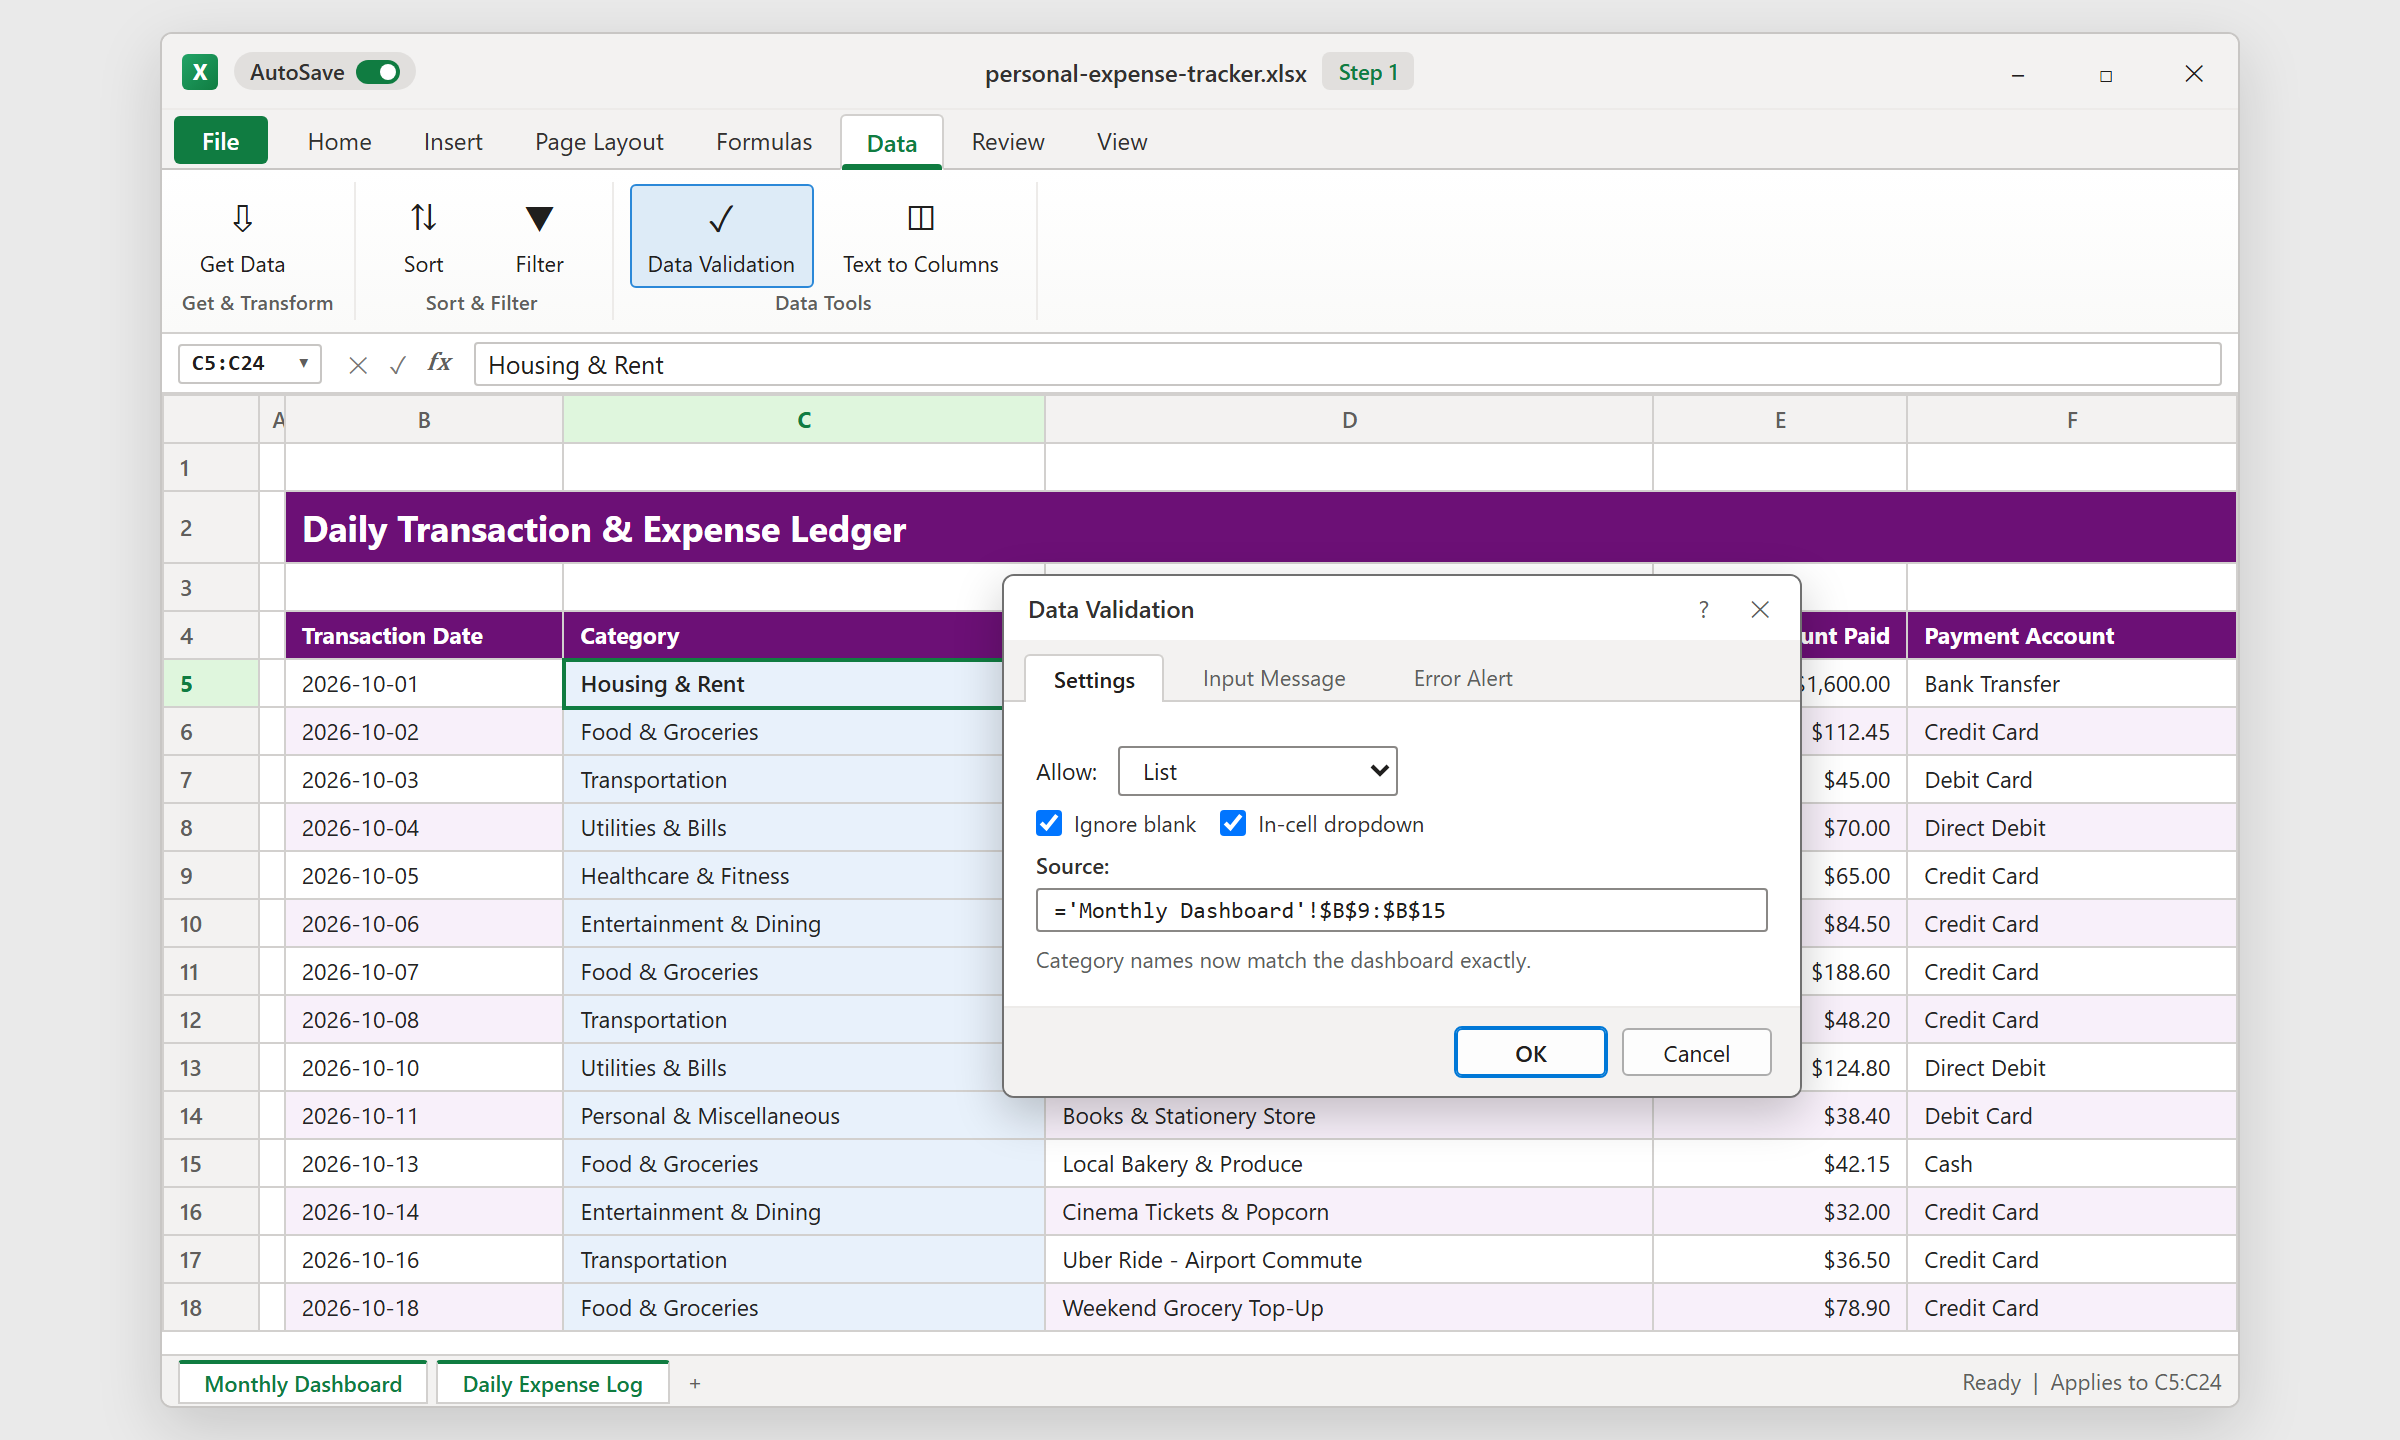
A single typo, like "Groceries" instead of "Food & Groceries", and the purchase never reaches the dashboard. A dropdown prevents that.
In the Daily Expense Log, select the Category column and open Data > Data Validation. Allow a List and point the source at the category names on the dashboard. Now every entry comes from the same list, and renaming a category in one place updates the dropdown automatically.
2Step 2: Pull Spending into the Dashboard with SUMIFS
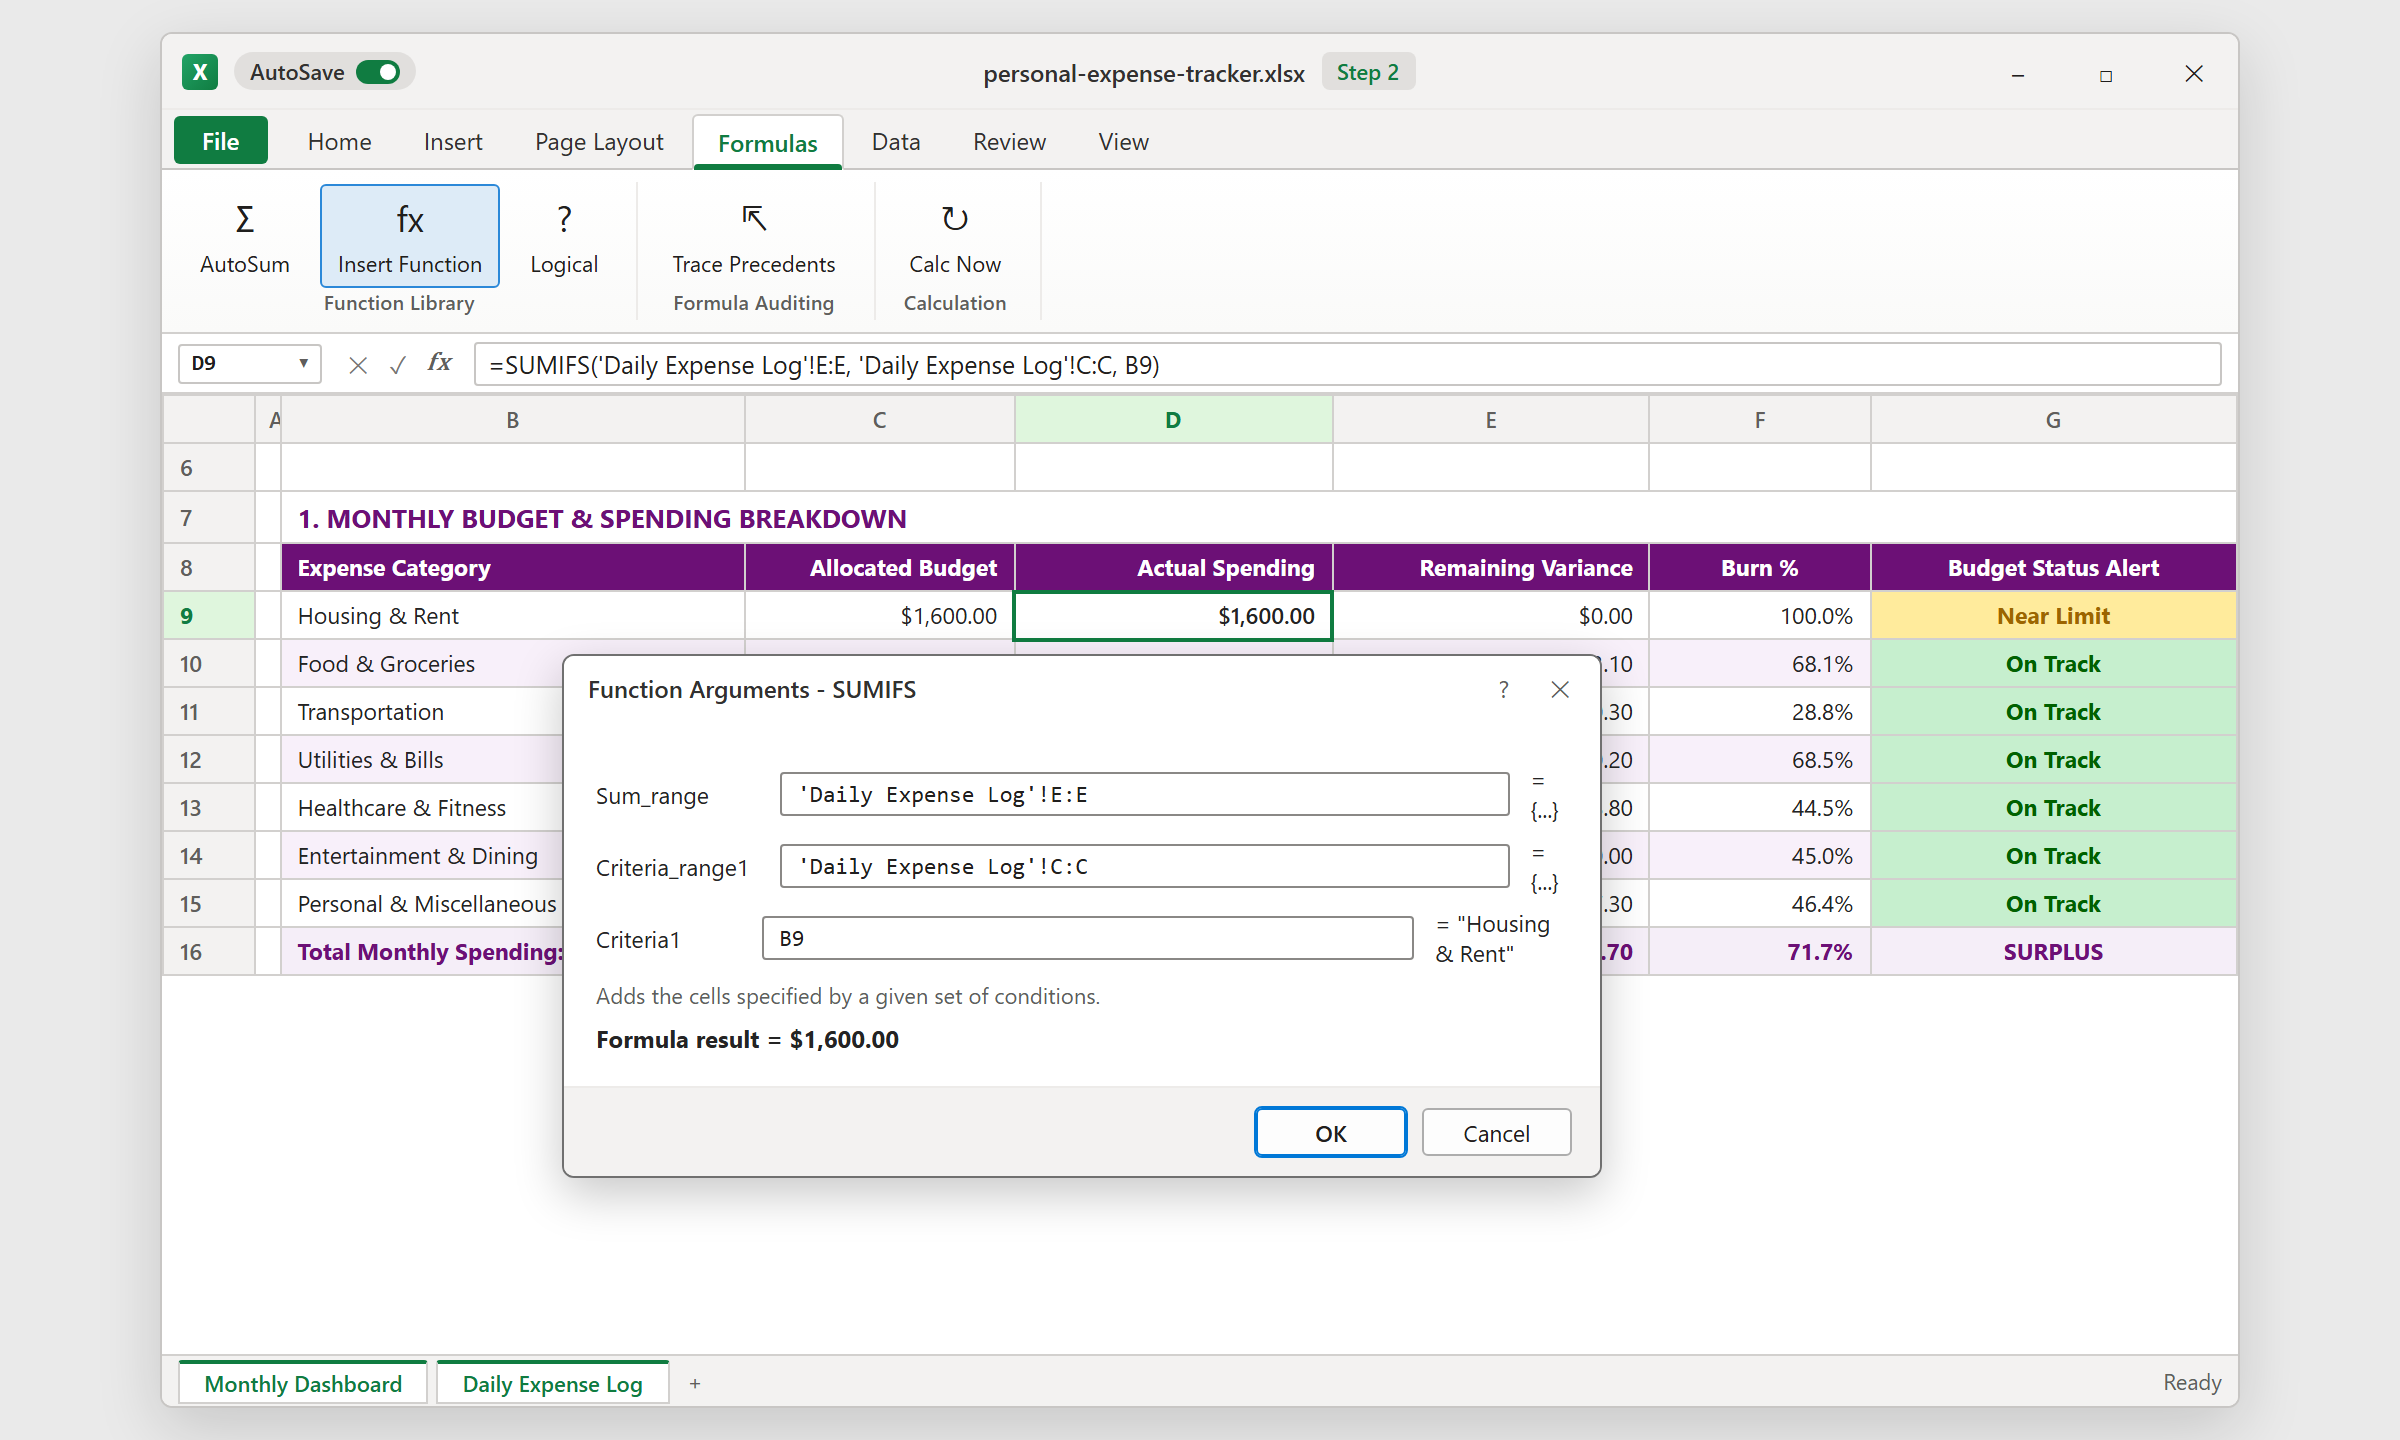
Open Insert Function and choose SUMIFS. It asks for three things: the column to add up (Amount Paid), the column to check (Category), and the value to look for, which is the category name on the same dashboard row.
Because the ranges cover whole columns, new purchases are picked up the moment you type them. Housing & Rent returns $1,600.00 and Food & Groceries returns $476.90. Keep the category cell in the log's total row empty, so that row never matches a category.
3Step 3: Calculate Burn % and Format It
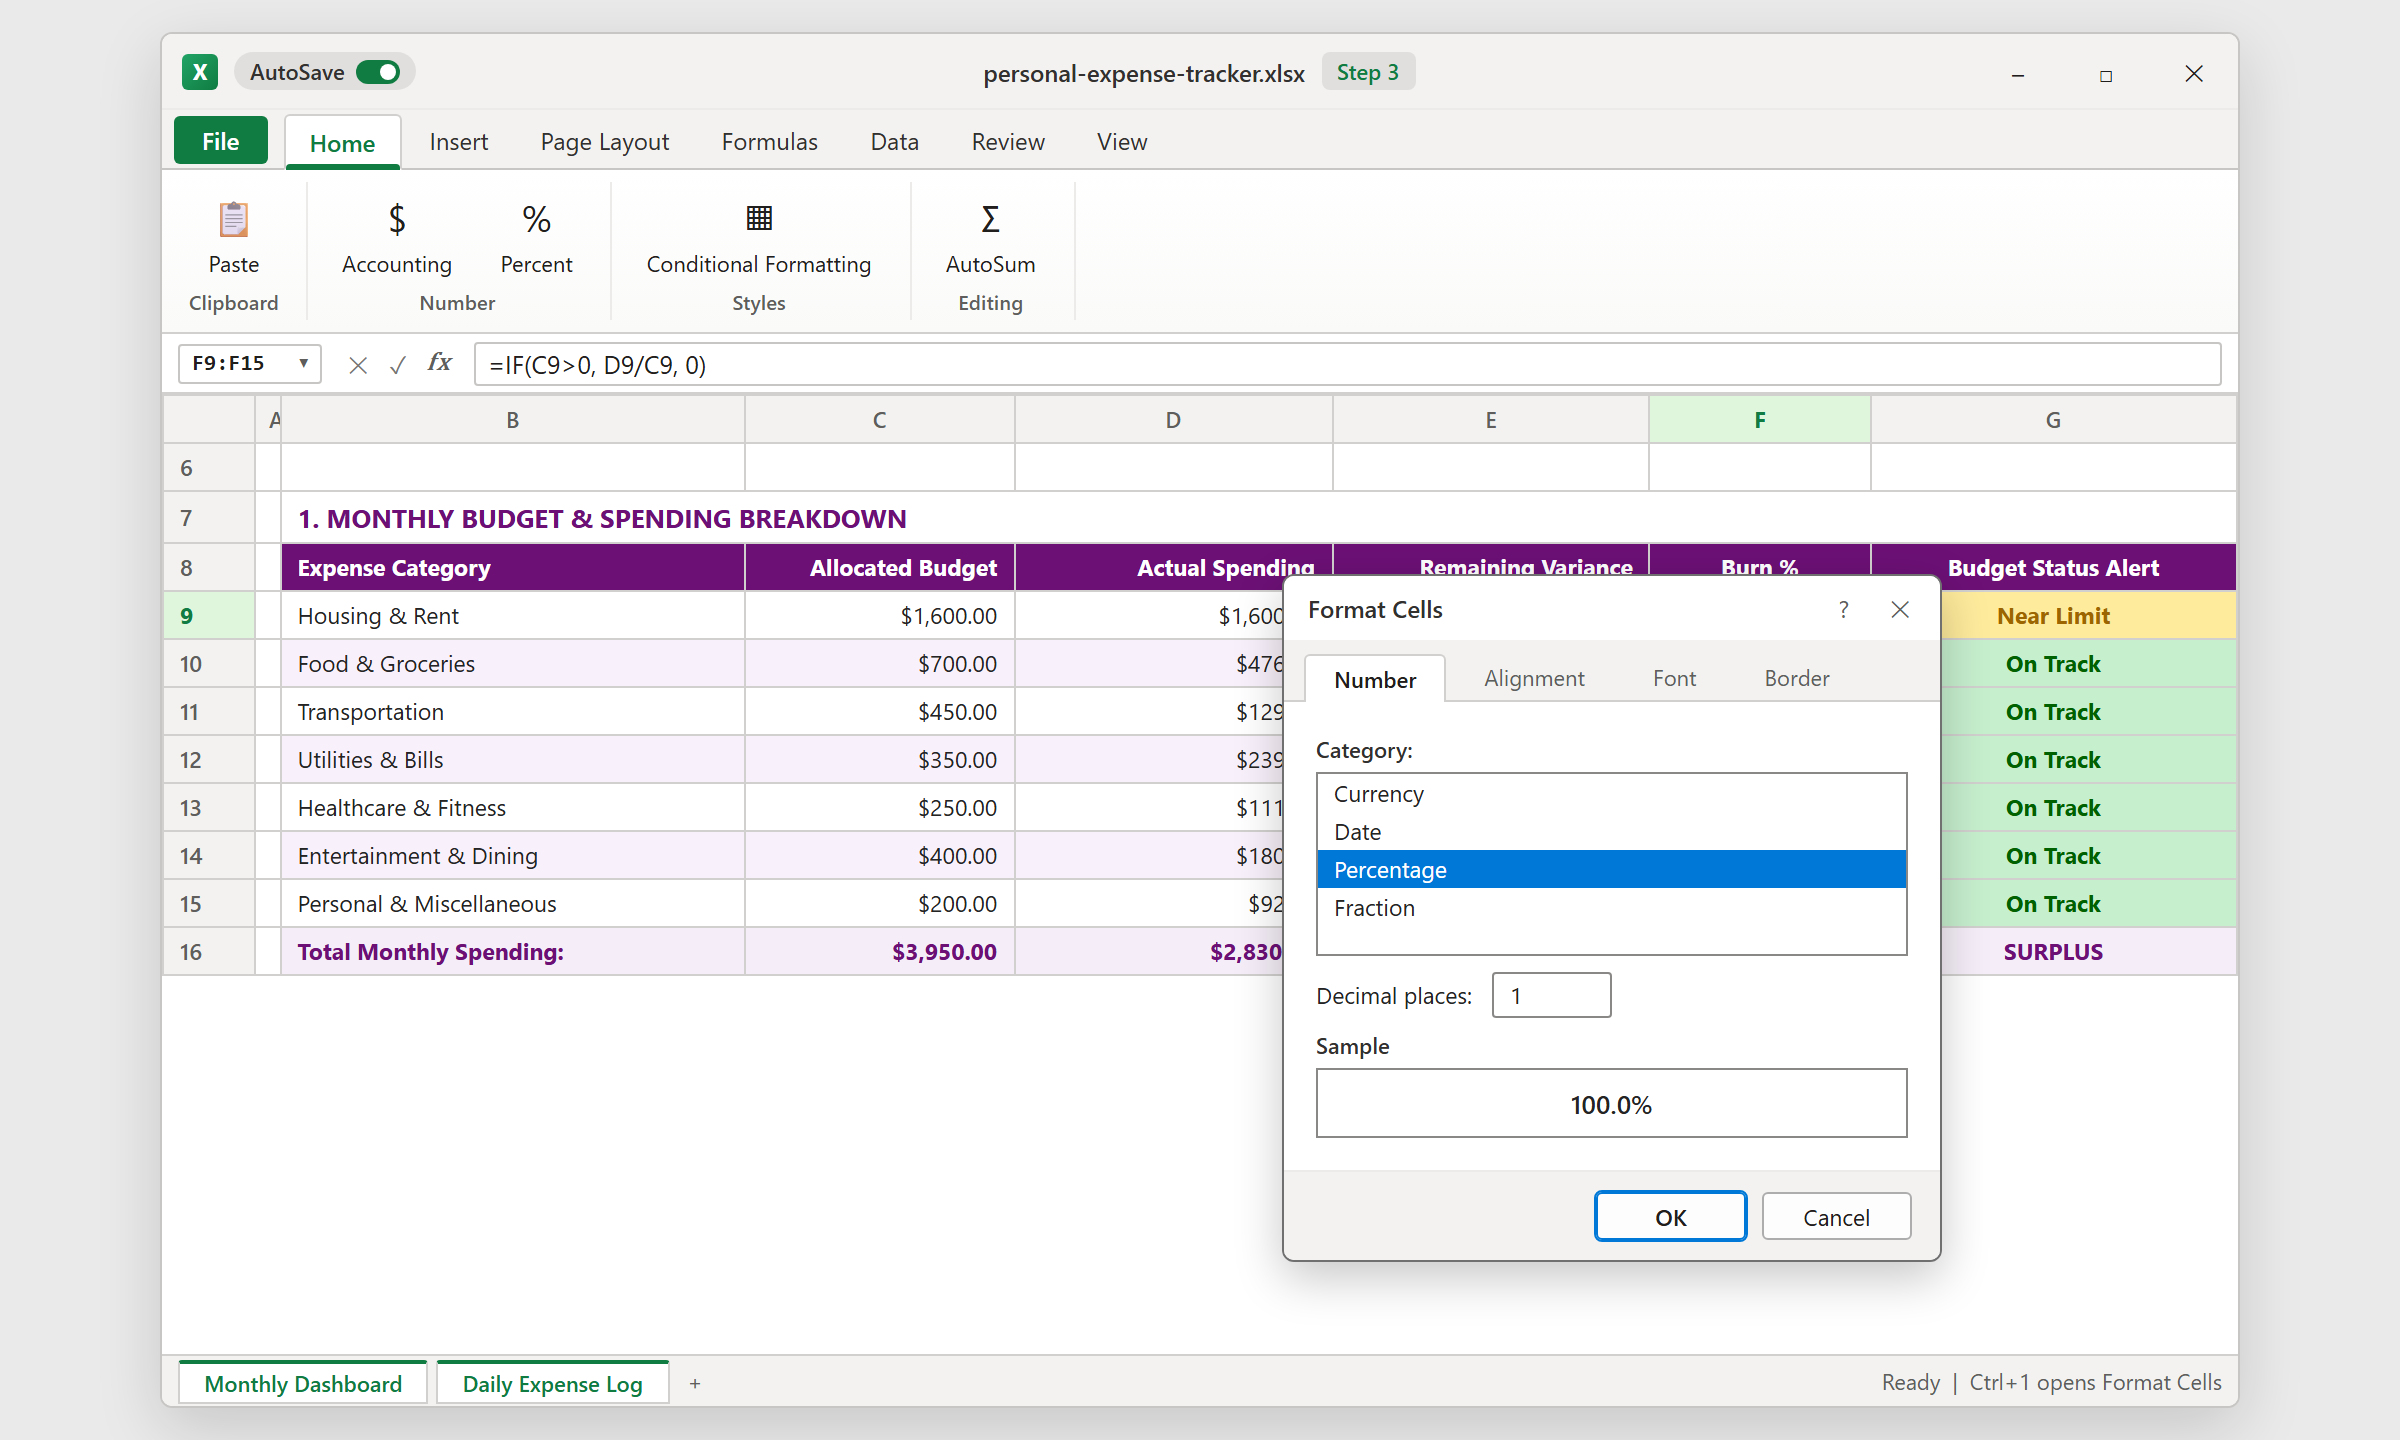
Remaining variance is budget minus actual. Burn % is actual divided by budget, wrapped in an IF that returns zero when a budget is empty. That guard avoids a #DIV/0! error if you leave a category blank for a month.
The raw result is a decimal such as 0.681286. Select the Burn % cells, press Ctrl+1, choose Percentage, and set one decimal place. The number now reads 68.1%, which is clear without looking cluttered.
4Step 4: Build the Three-Level Alert
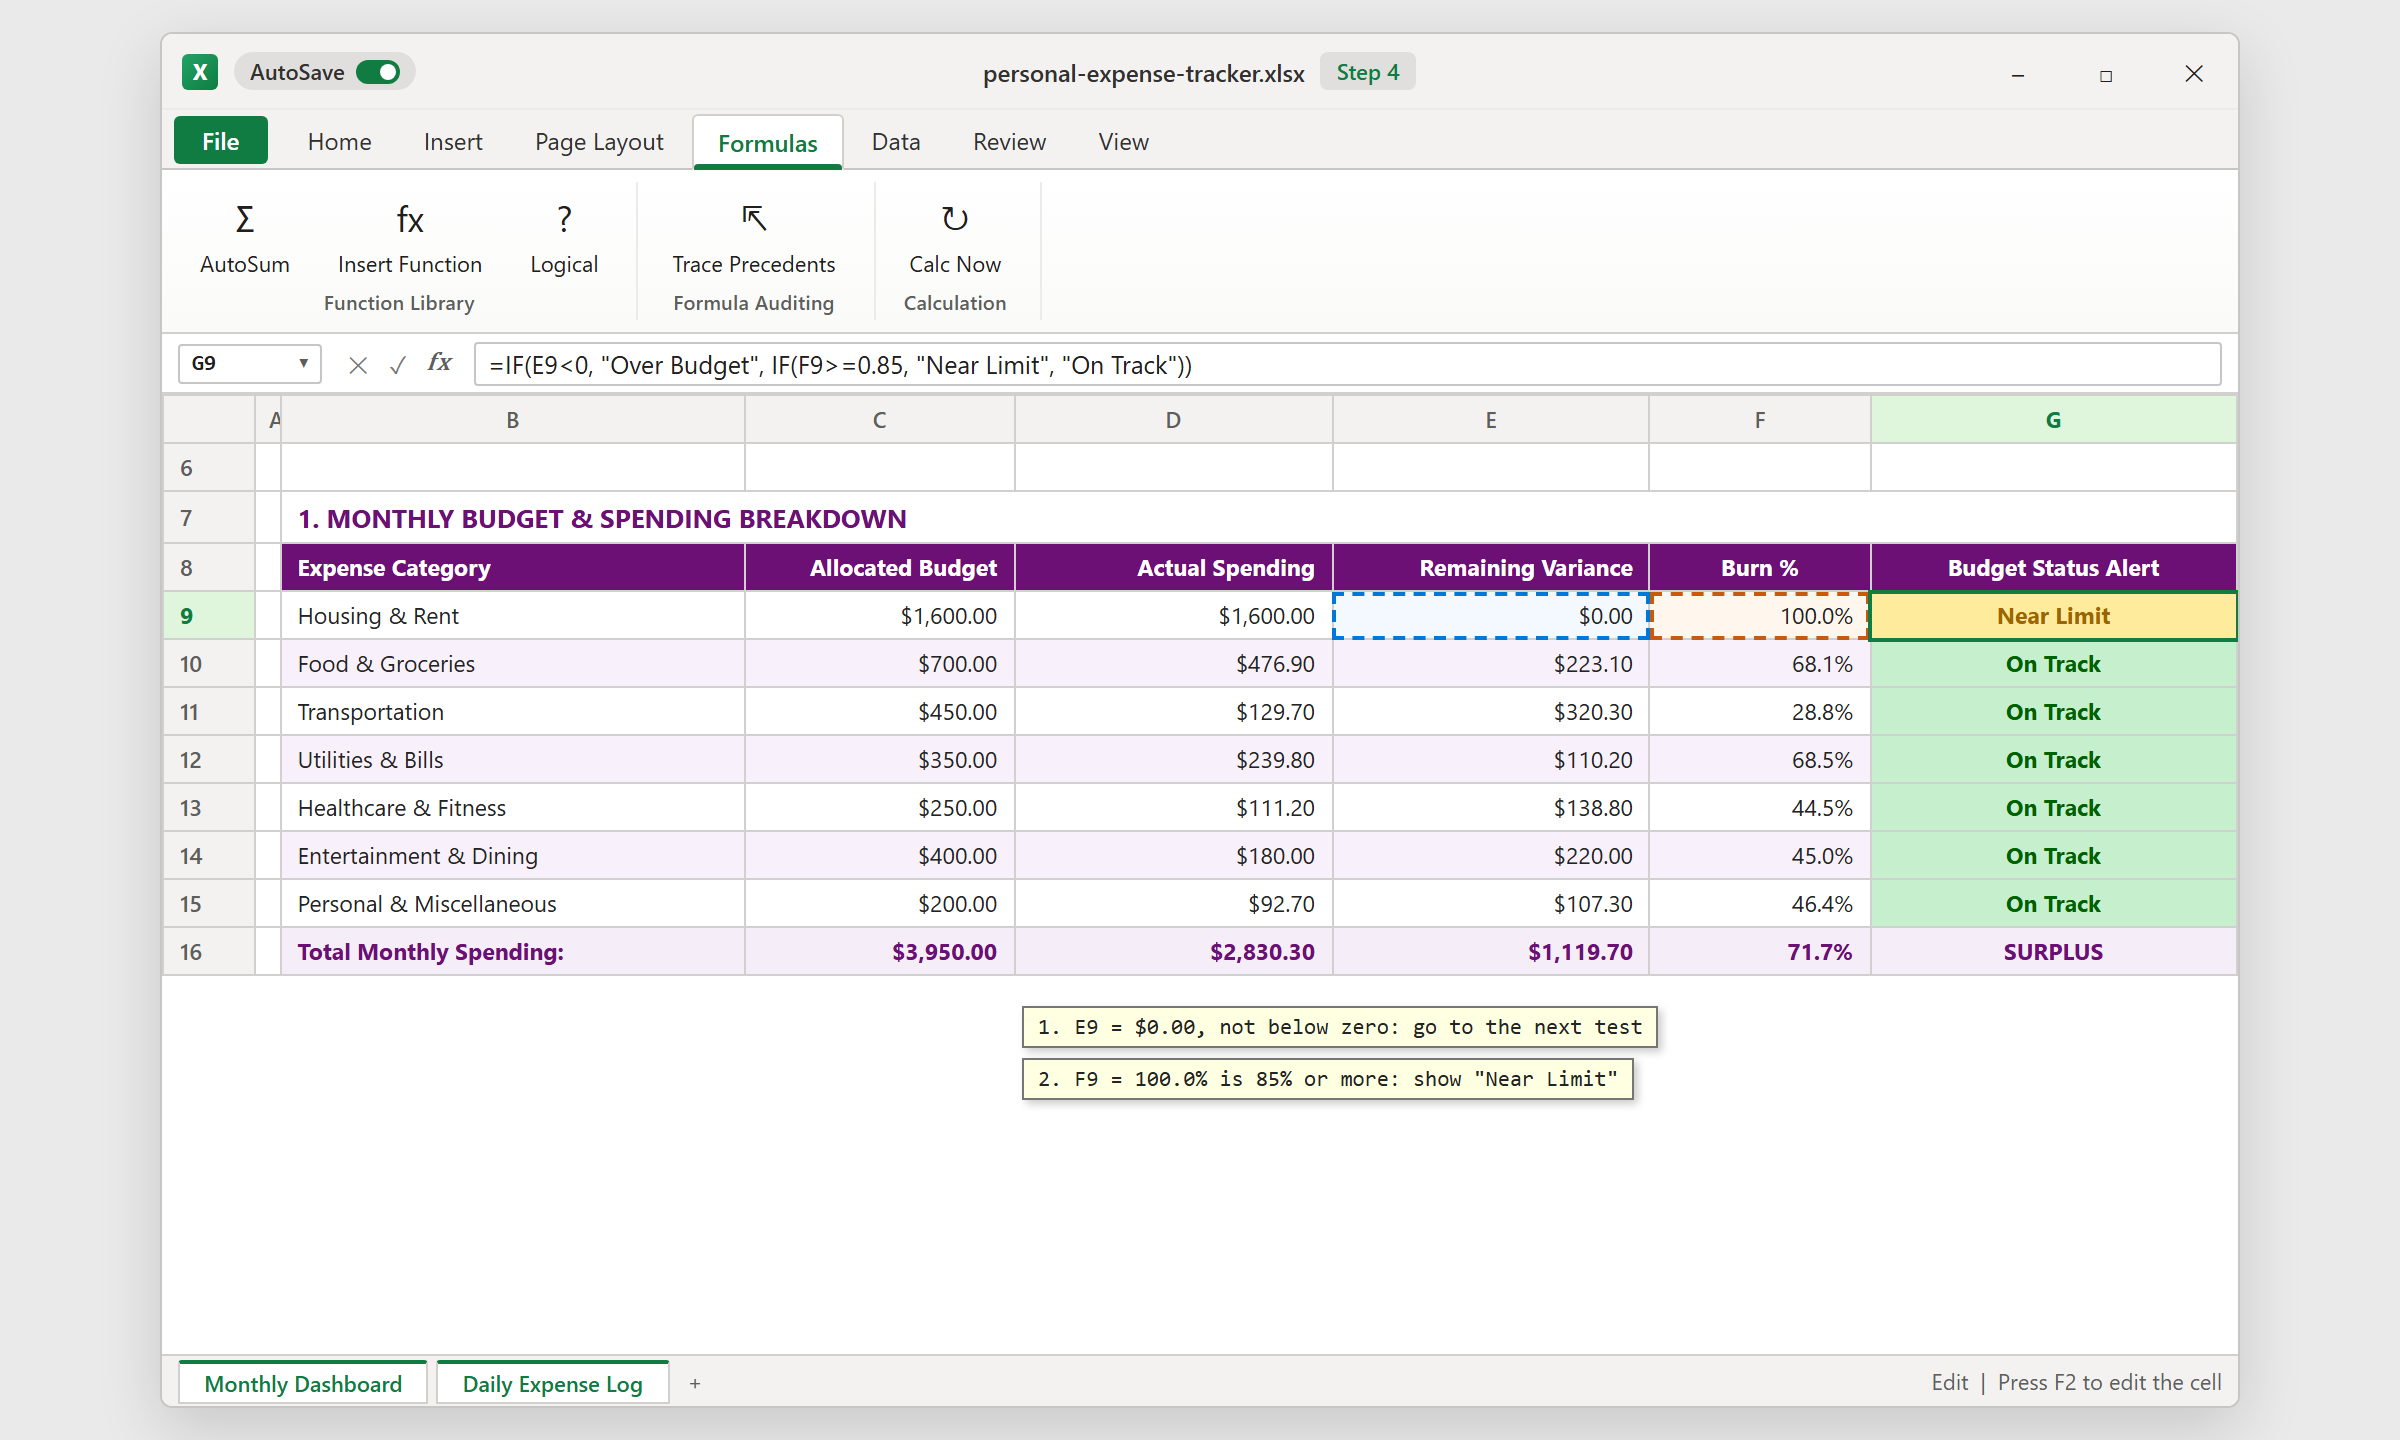
Use two IF functions, one inside the other. The first test checks whether the remaining variance is below zero, which means Over Budget. If not, the second test checks whether burn is 85% or more, which means Near Limit. Anything else is On Track.
Order matters. An overspent category also has burn above 85%, so the Over Budget test has to come first. Press F2 on the cell to see which cells feed it. Housing & Rent is a good example: its variance is exactly $0.00 and its burn is 100.0%, so it shows Near Limit, not Over Budget.
5Step 5: Color the Alerts
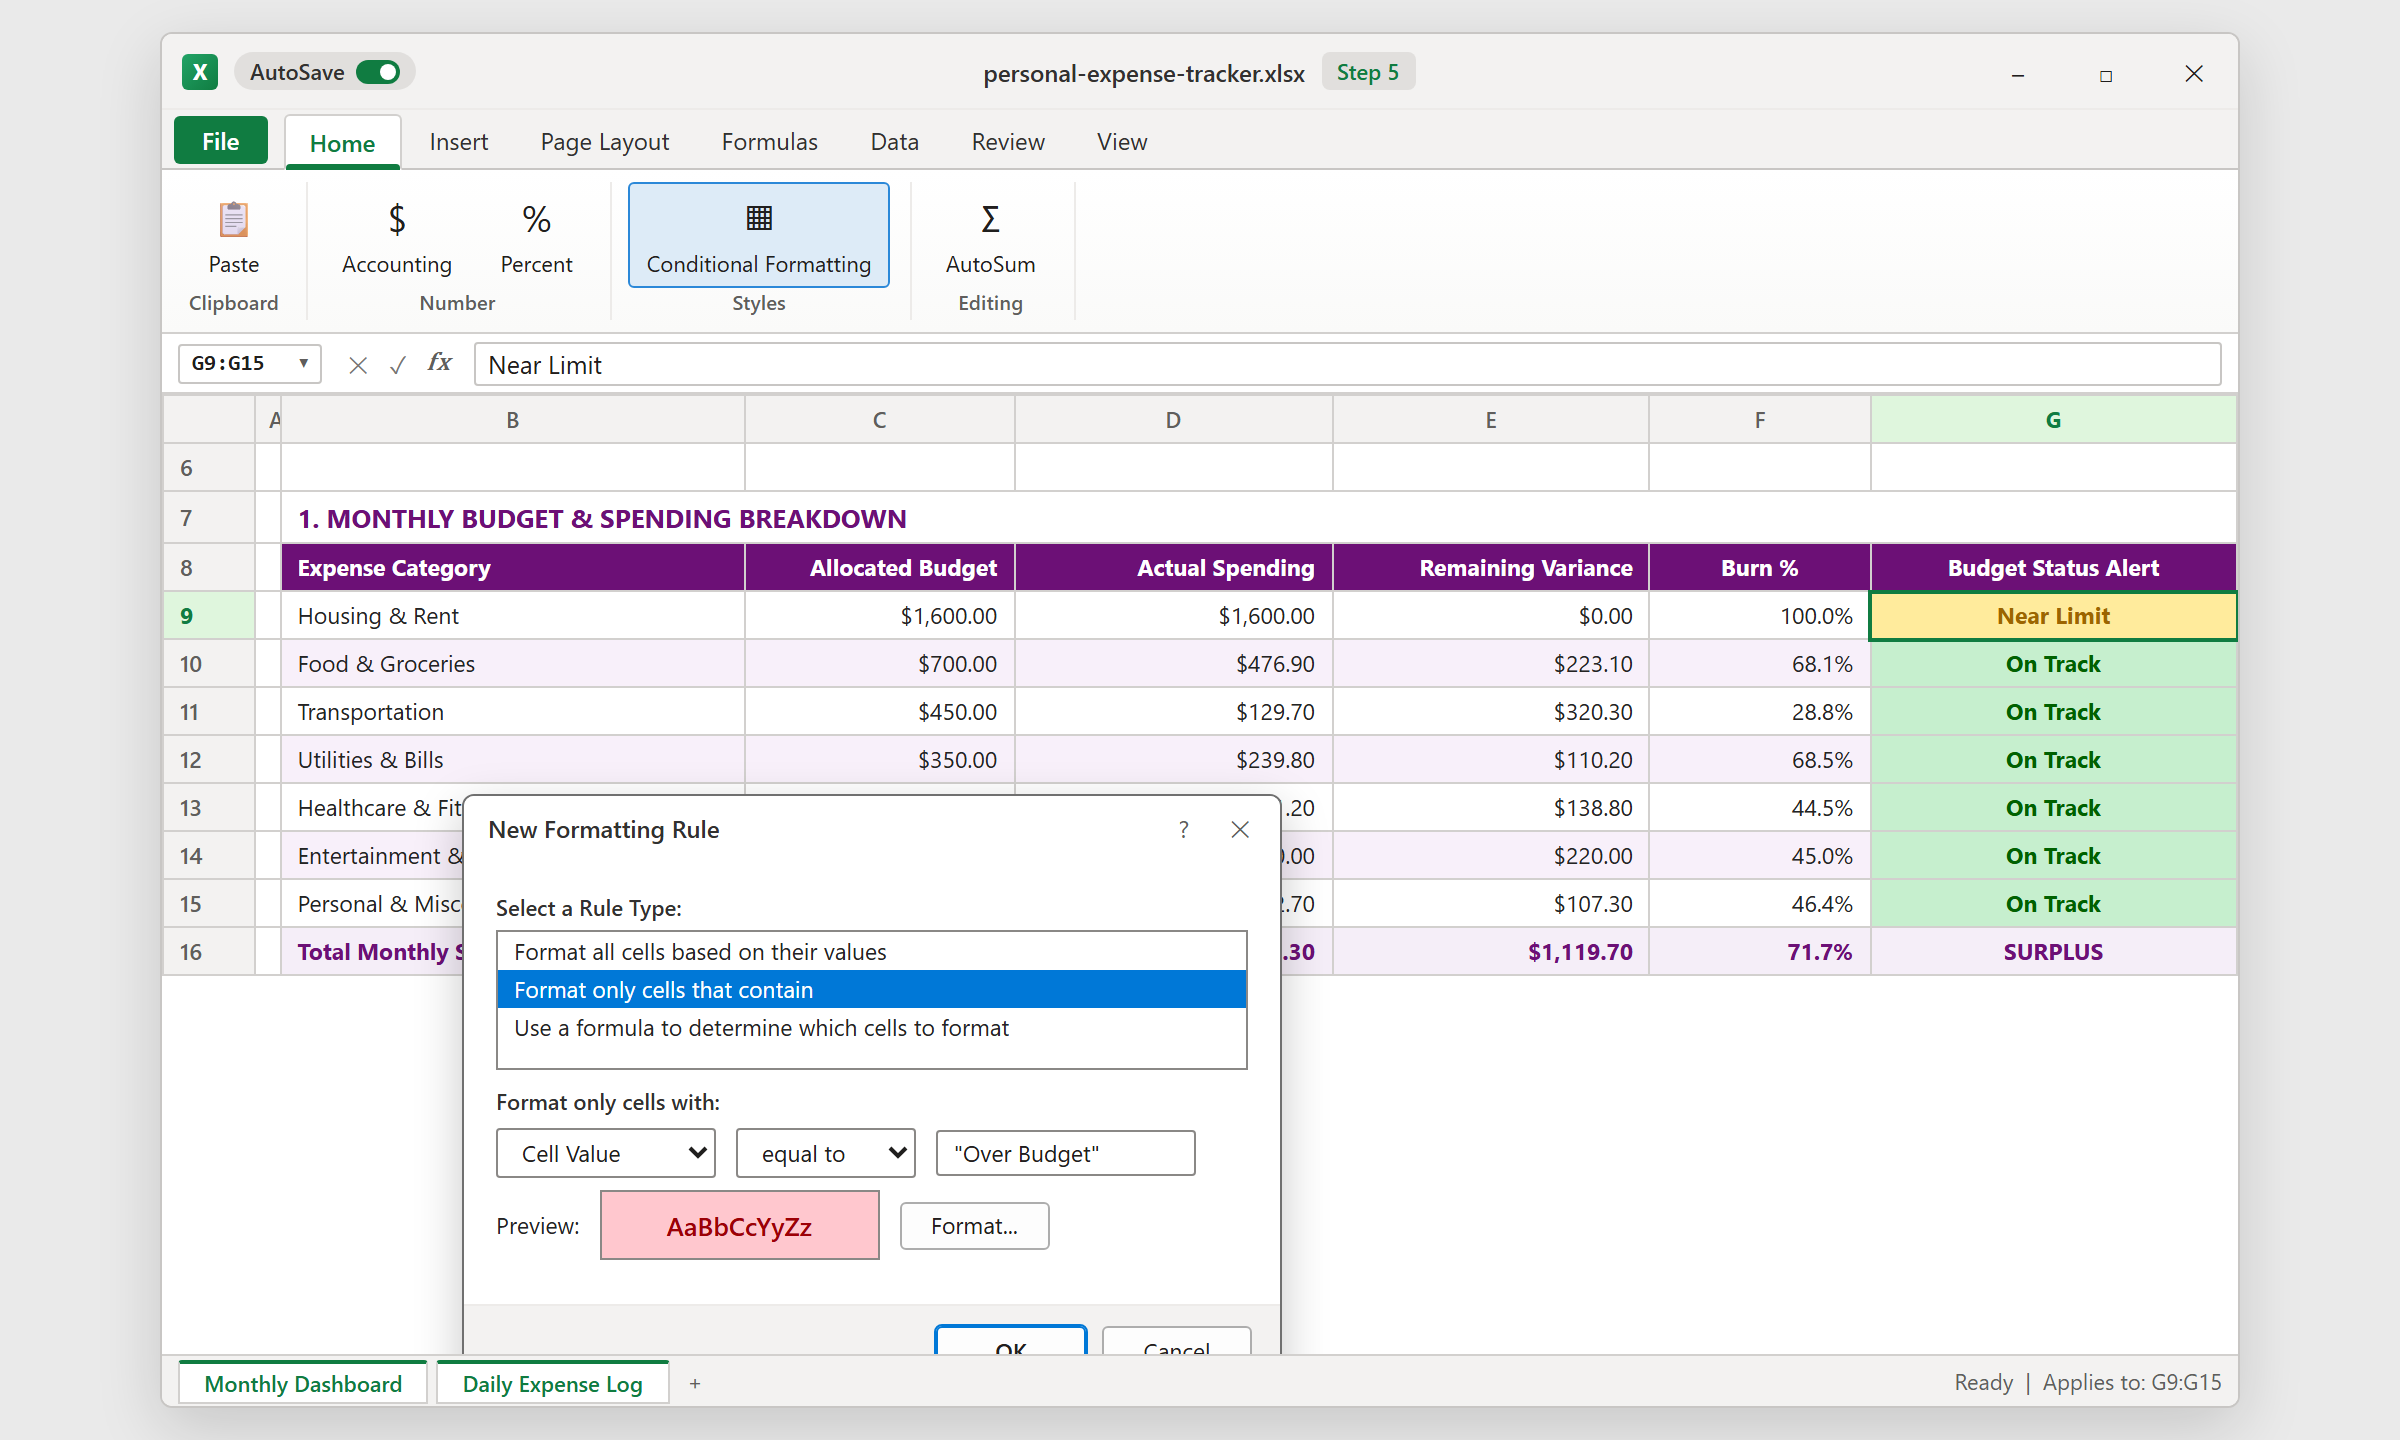
Select the status cells and open Home > Conditional Formatting > New Rule. Choose "Format only cells that contain", set Cell Value equal to "Over Budget", and pick a light red fill with dark red text.
Repeat for Near Limit with a light yellow fill and dark yellow text, and for On Track with light green. Now the dashboard works like a traffic light, and your eye lands on the one cell that needs attention.
The 85% Threshold Rule: How Mid-Month Budget Alerts Prevent End-of-Month Deficits
- Food & Groceries: $343.20, or 49.0% of budget.
- Utilities & Bills: $194.80, or 55.7%.
- Entertainment & Dining: $116.50, or 29.1%.
Download the Template

Spreadsheet educator and web developer passionate about hands-on interactive spreadsheet practice.
Related Practical Exercises
Explore more hands-on spreadsheet models with downloadable practice workbooks.
 Human Resources
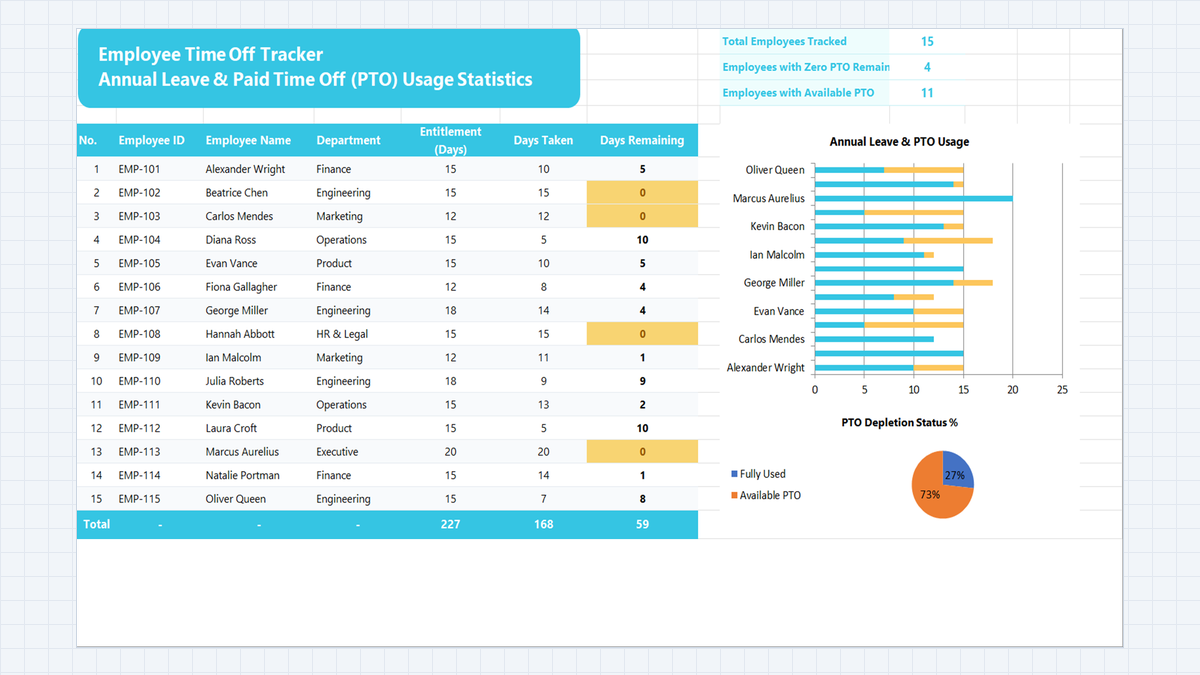
Employee Time Off Tracker Excel Template
Keep track of every employee's annual leave in one sheet. Build a time off tracker in Microsoft Excel with department dropdowns, automatic remaining-days balances, KPI cards built with COUNTA and COUNTIF, and an alert for staff who have used all their PTO.
 Finance
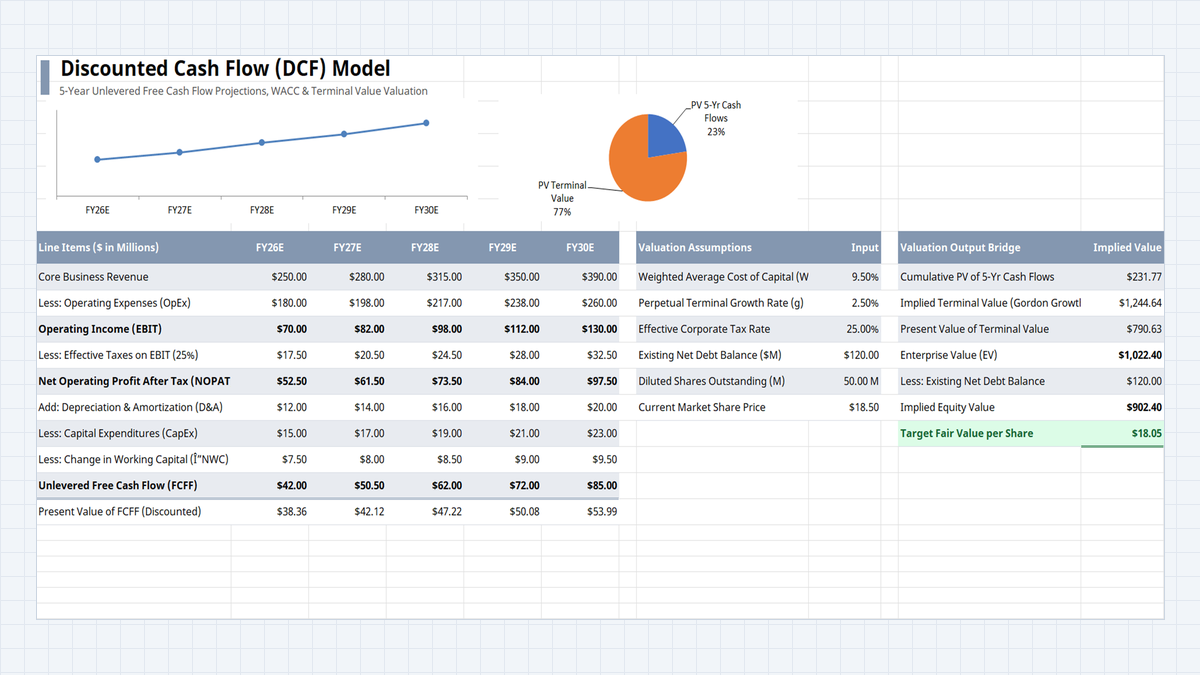
Discounted Cash Flow (DCF) Model Excel Template
Find out what a company is worth from the cash it will generate, not from a guess. Build a one-sheet DCF in Excel: five years of free cash flow, a WACC discount, a terminal value, and a fair value per share you can compare with the market price.
 Finance
Auto Loan Calculator Excel Template
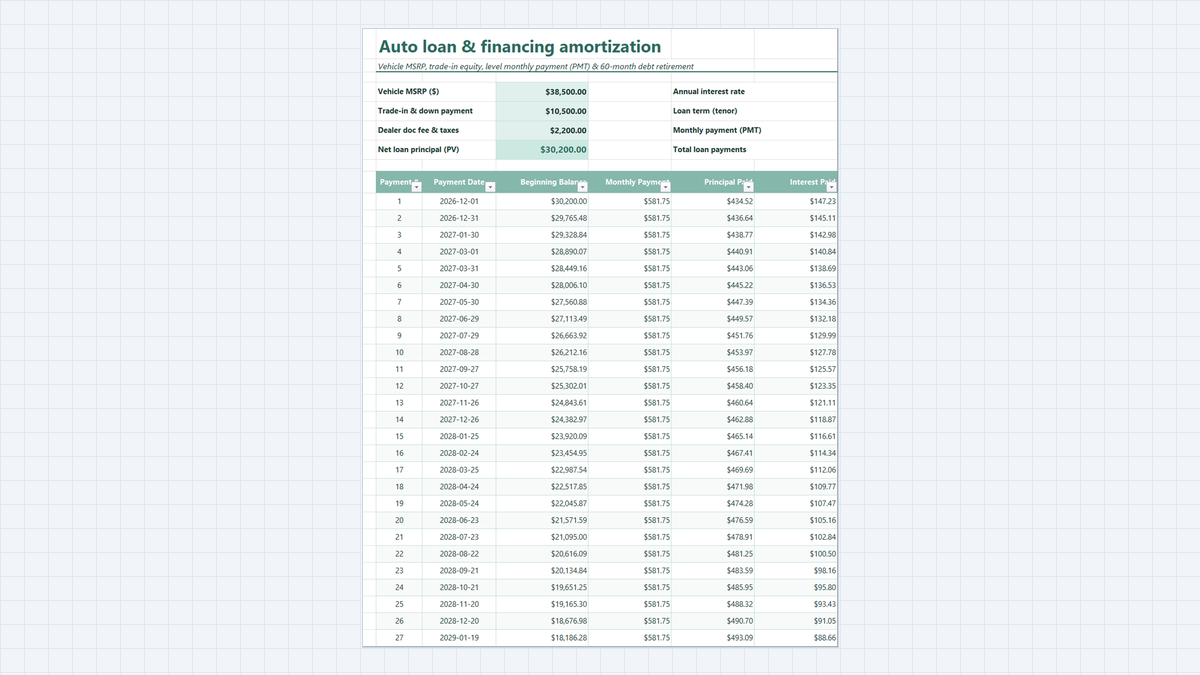
Know your exact monthly car payment and total loan interest before you visit the dealership. Learn how this auto loan calculator works, explore its workbook structure, and follow a clear step-by-step guide to build it in Excel with PMT and amortization formulas.
 Productivity
Household Budget Planner Excel Template
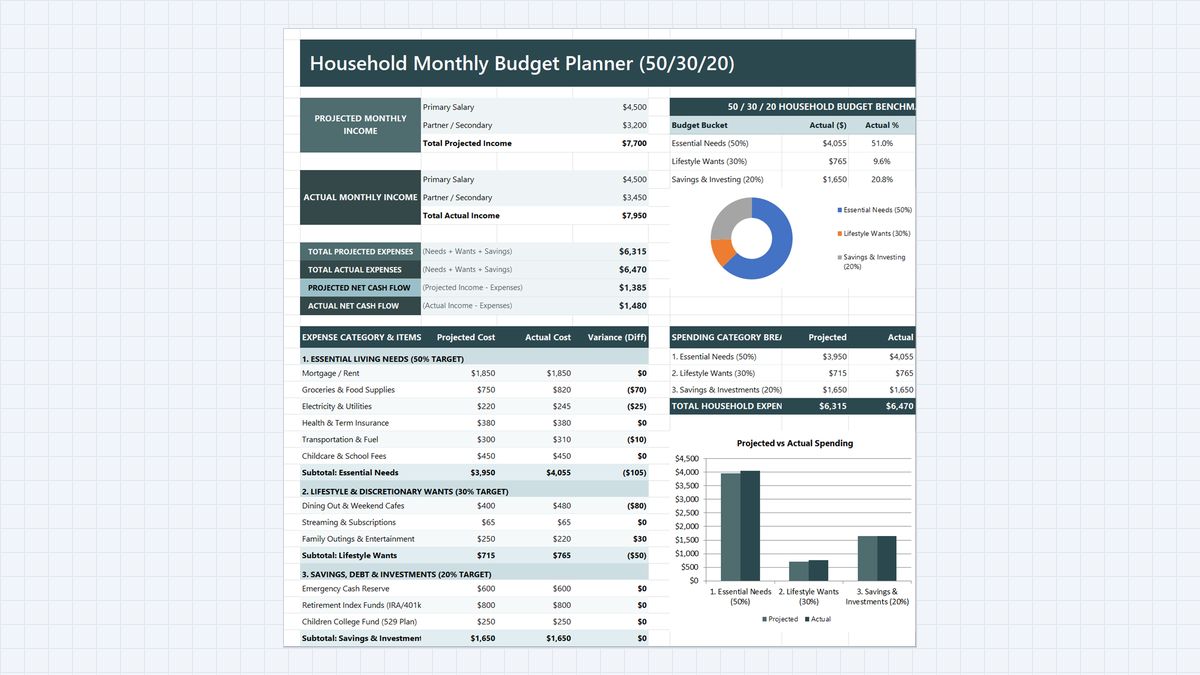
Find out where a two-income family's money really goes. Build a household budget planner in Microsoft Excel with 50/30/20 buckets, projected vs actual variance, a net cash flow card, and automatic over-budget alerts.
 Project Management
Project Timeline Tracker Excel Template
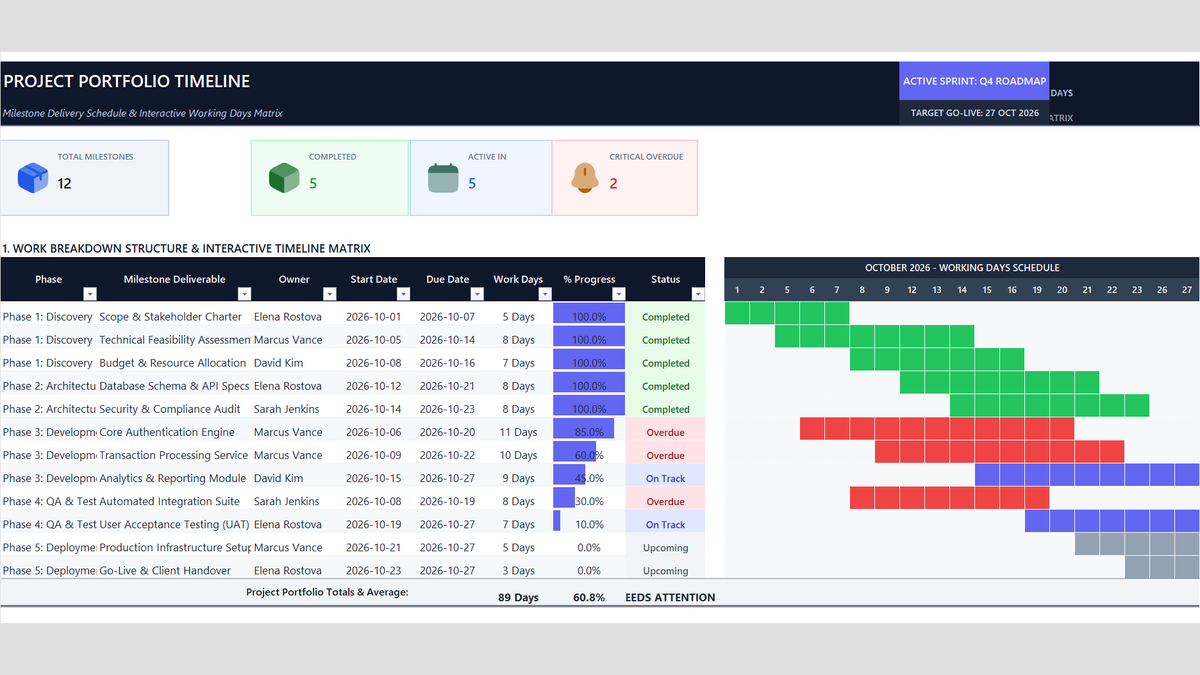
Keep sprint deadlines and client milestones on track without messy calendar math. Build a Project Timeline Tracker Excel Template with automatic working days using NETWORKDAYS, single-owner dropdowns, progress bars, and portfolio health alerts.
Discussion
Ask questions, share formula tips, or discuss alternative approaches with fellow spreadsheet builders.
Loading discussion...