It is October, and the cloud bill is far bigger than anyone planned. Nobody flagged it in March or June, because nobody put plan and spending side by side. A Budget vs Actual Variance Analysis Excel Template closes that gap in one sheet.
In this guide we build one together. It tracks a $550,000 monthly revenue plan, two cost centers (Engineering and Marketing), and an executive card that shows cost discipline at a glance. It is plain Excel, with no add-ins.
Why Budgets Leak: The Month Nobody Checked
- No side-by-side view. A bill on its own says nothing. It only means something next to the plan.
- Mixed-up signs. For costs, spending less than planned is good, so the math is Projected minus Actual. Flip it by accident and an overrun looks like a saving.
- No visual alarm. Nobody reads 19 line items in a monthly review. The big misses must jump out.
Anatomy of the Variance Analysis Template
Budget Variance. The executive summary sits at the top. Below it, Engineering and Marketing sit side by side, so you can compare cost centers without scrolling. This is the core of any Corporate Budget Tracker.| Col | Field Name | Type | Format | Role |
|---|---|---|---|---|
| B | Engineering | Text | General | Cost line, such as Cloud servers & AWS hosting. |
| C-D | Projected cost / Actual cost | Currency | $#,##0 | Approved plan and real spending. |
| E | Difference | Formula | $#,##0 | Projected minus Actual. |
| G-J | Marketing block | Text / Currency / Formula | $#,##0 | Same four fields for Marketing lines. |
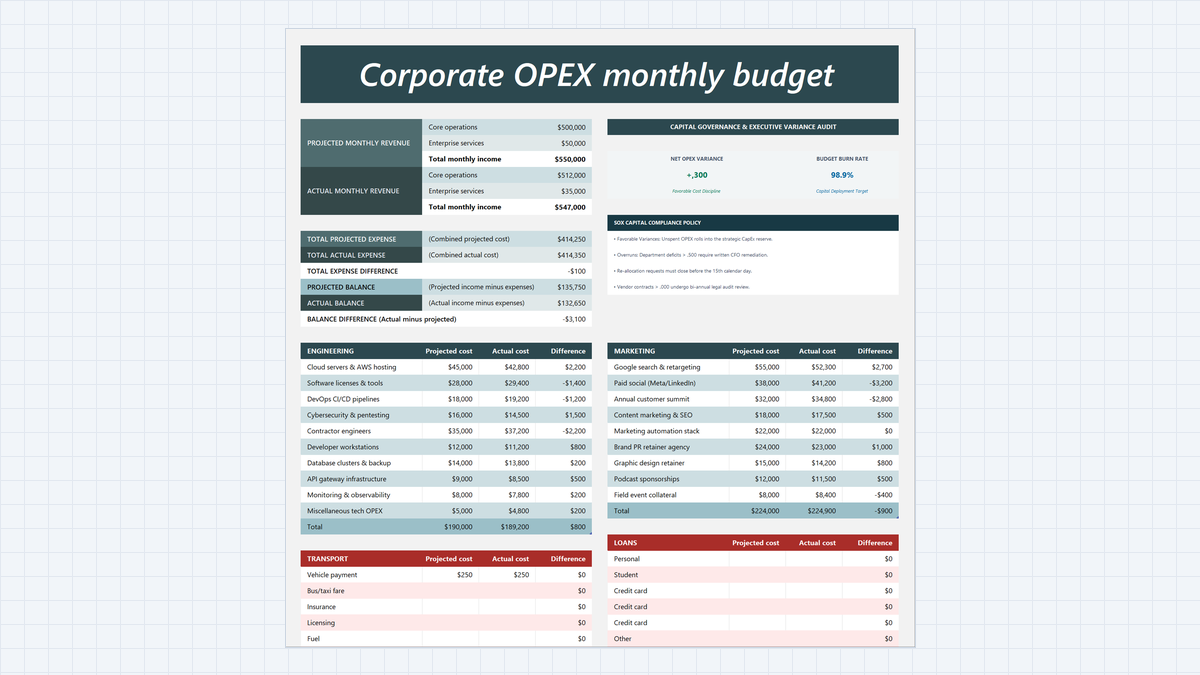
The finished layout: revenue cards and SOX policy on top, Engineering and Marketing cost centers below.
How to read it: a positive Difference is Favorable (you spent less). A negative Difference is Unfavorable (you spent more).
5 Steps to Build Your Budget vs Actual Excel Template
1Step 1: Turn Each Cost List Into an Excel Table
Select B18:E28 (the Engineering list) and press Ctrl + T. In the Create Table box, tick My table has headers and click OK. Then name the table Engineering under Table Design.
A real Excel Table fills formulas down by itself and grows when you add a new cost line. Do the same for the Marketing list in G18:J27.

Step 1: The Create Table dialog converting B18:E28 into an official Engineering table.
2Step 2: Calculate the Variance With Column Math
Click E19, type =, click the Projected cell, type a minus sign, then click the Actual cell. Excel writes =[@[Projected cost]]-[@[Actual cost]] and fills the whole column.
Cloud servers & AWS hosting gives $45,000 - $42,800 = +$2,200, a Favorable result. Contractor engineers gives $35,000 - $37,200 = -$2,200, an Unfavorable one. Repeat for Marketing in column J.

Step 2: Cell E19 holding the structured formula that subtracts Actual cost from Projected cost.
3Step 3: Add Filter-Proof Totals With SUBTOTAL 109
Turn on Total Row in Table Design. Then click C29 and open Formulas > Math & Trig > SUBTOTAL. Set Function_num to 109 and Ref1 to Engineering[Projected cost].
Number 109 means SUM that skips hidden rows. Filter the table to show only overruns and the total still stays honest. Engineering lands at $190,000 planned, $189,200 actual, and +$800 Favorable. Marketing shows $224,000 against $224,900, which is -$900 Unfavorable.

Step 3: Function Arguments for SUBTOTAL with 109 and the Engineering Projected cost column.
4Step 4: Highlight Cost Overruns in Red
Select J19:J27, then go to Home > Conditional Formatting > Highlight Cells Rules > Less Than. Type 0 and pick Light Red Fill with Dark Red Text.
Now Paid Social (-$3,200) and Annual customer summit (-$2,800) glow pink. Apply the same rule to E19:E28 for Engineering.

Step 4: The Less Than dialog coloring negative Marketing differences light red.
5Step 5: Finish the Executive SOX Compliance Card
Select the totals, press Ctrl + 1, and open the Border tab. Choose the double line and click the bottom edge. This is the classic accounting underline. Use the Fill tab for the card header.
The card then reads Net OPEX Variance +$7,300 with the note Favorable Cost Discipline, and Budget Burn Rate 98.9%. The SOX note says overruns above $2,500 need a written CFO remediation letter, and both lines from Step 4 cross that mark.

Step 5: Format Cells with a double bottom border, next to the executive compliance card.
Favorable vs Unfavorable Variances: When Under-Spending Is a Warning
- Why is it under? A better contract is a win. A delayed project is not.
- Is it timing? Check if the invoice simply lands next month.
- Who pays later? A skipped security test can cost far more than $1,500.
Download the Budget vs Actual Variance Analysis Excel Template

Spreadsheet educator and web developer passionate about hands-on interactive spreadsheet practice.
Related Practical Exercises
Explore more hands-on spreadsheet models with downloadable practice workbooks.
 Finance
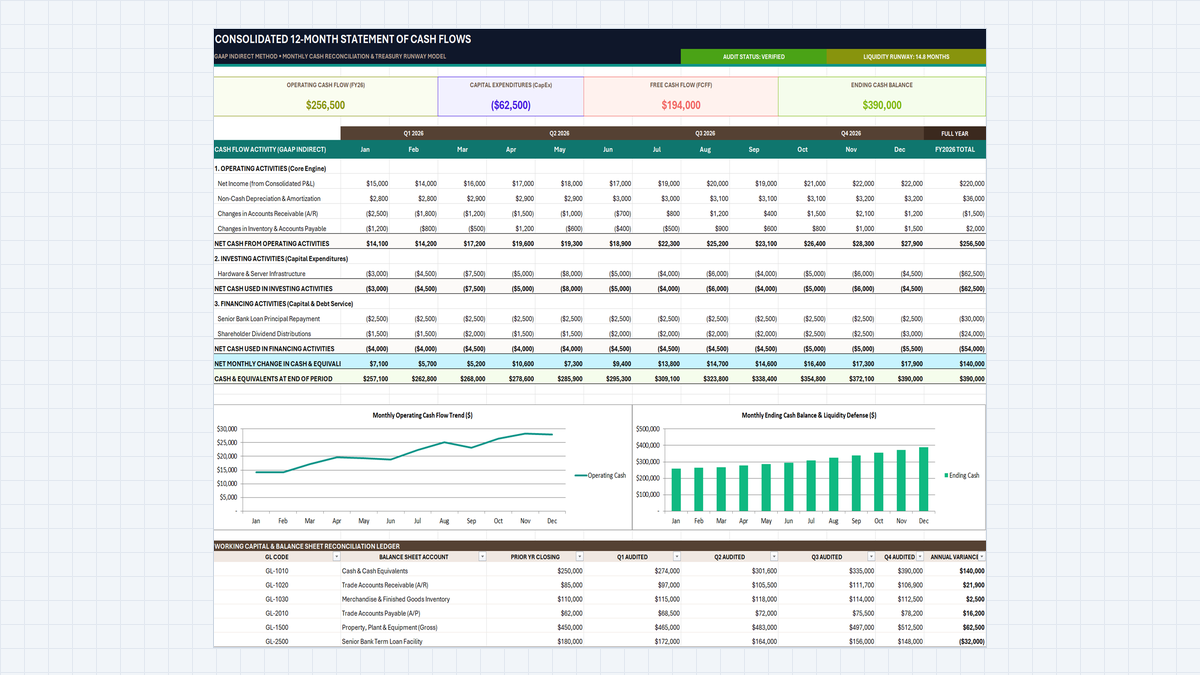
12-Month Cash Flow Statement Excel Template
Build a 12-month cash flow statement in Excel with the indirect method: operating, investing and financing sections, a rolling cash balance, a Free Cash Flow to Firm (FCFF) card and a simple low-cash alert.
 Human Resources
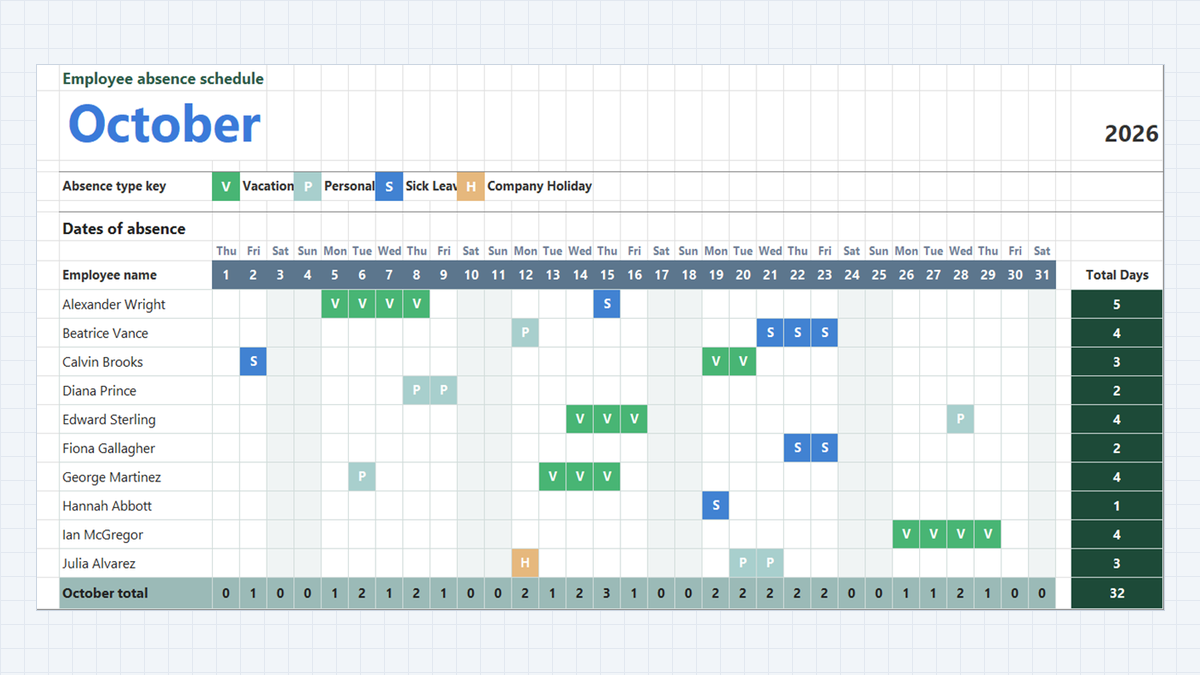
Employee Attendance Tracker Excel Template
Manage team attendance, vacation days, and sick leave in Microsoft Excel. Build a clean monthly absence schedule featuring dropdown absence keys with Data Validation, automatic color-coded badges via Conditional Formatting, and dynamic attendance totals with COUNTA.
 Human Resources
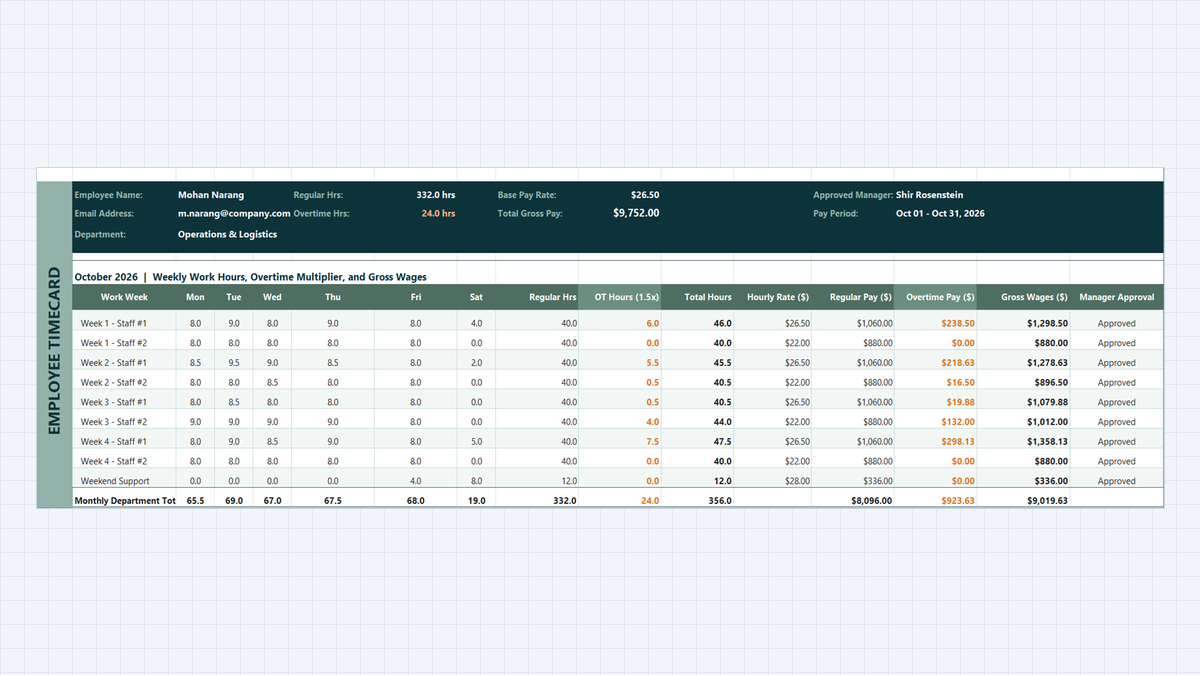
Employee Payroll Calculator Excel Template
Payroll Friday should not be stressful. Learn how to build an employee payroll calculator in Microsoft Excel that automatically tallies timecards, caps regular hours at 40 with MIN, computes 1.5x overtime with MAX, and locks penny-perfect wages with ROUND.
 Finance
Loan Amortization Schedule Excel Template
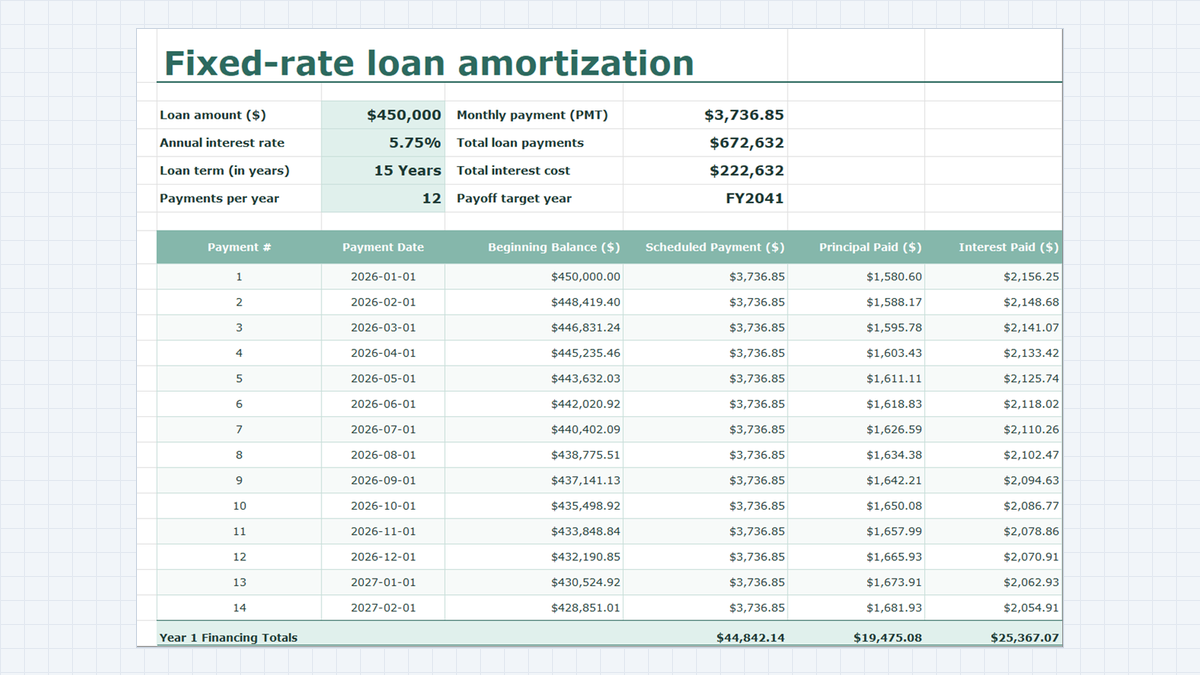
Learn fixed-rate commercial debt structuring in Microsoft Excel. Build a rigorous amortization schedule featuring level debt service calculations with =PMT(), interest and principal bifurcation, dynamic balance rollforwards, accounting ledger formatting, and annual debt covenant rollups.
 Productivity
Daily Habit Tracker Excel Template
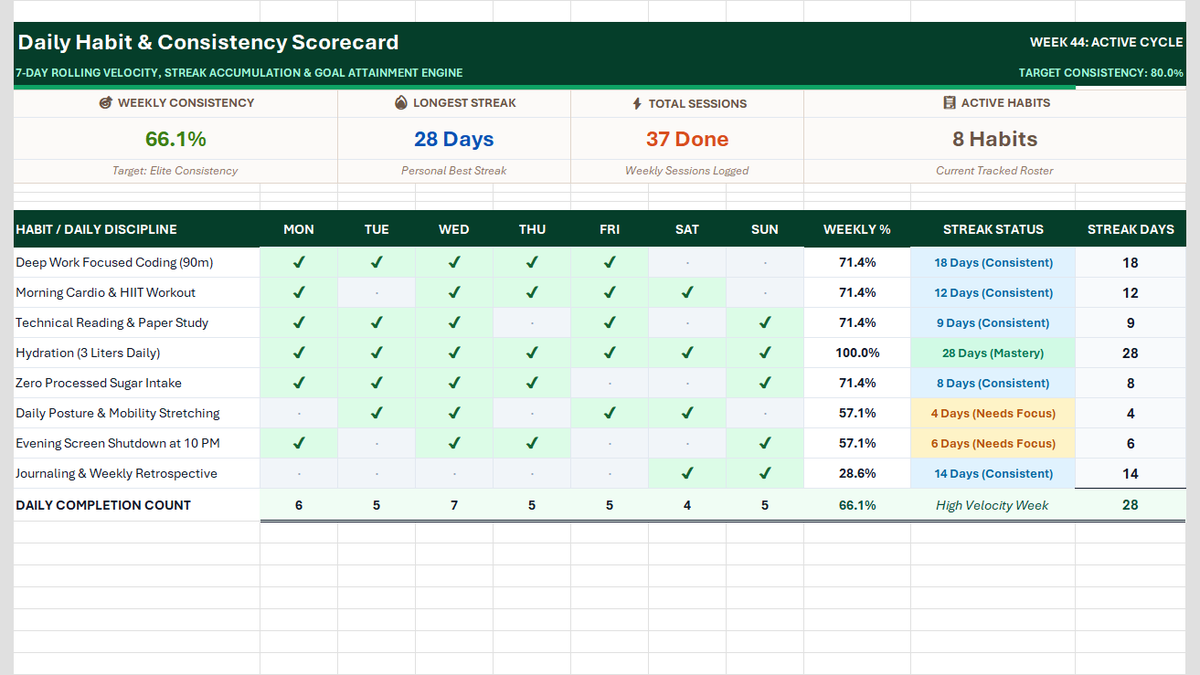
Build a Daily Habit Tracker in Excel: a 7-day grid of checkmarks and dots, COUNTIF completion rates, daily volume, streaks, and a four-card weekly scorecard.
Discussion
Ask questions, share formula tips, or discuss alternative approaches with fellow spreadsheet builders.
Loading discussion...