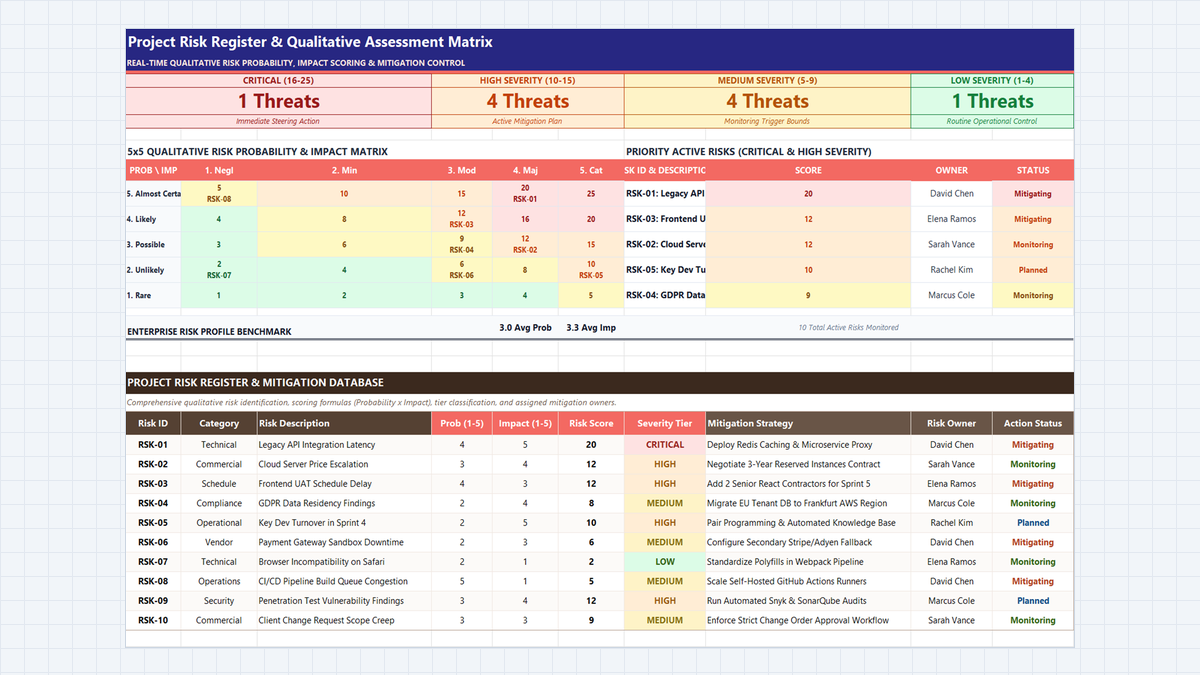
Every engineering program manager and enterprise PMO lead has lived through this boardroom crisis: a mission-critical release suffers a catastrophic outage because a known vulnerability was buried inside an unstructured meeting memo as "something to watch out for." Without quantitative scoring and clear ownership boundaries, critical threats hide behind polite subjective opinions.
Modern project governance demands rigor. When you transition from informal bullet points to a formalized ISO 31000 qualitative risk register, every potential disruption is mapped across two objective axes: Probability (1 to 5) and Impact (1 to 5). That single multiplication instantly separates routine technical noise from executive-level threats.
In this comprehensive tutorial, we will construct an enterprise-grade Project Risk Register from scratch. You will implement automated scoring formulas, build nested IF severity tiering ladders, configure an interactive 5x5 visual heatmap matrix, enforce strict mitigation workflows with Excel Data Validation, and aggregate executive KPI scorecards for steering committee review.
Why Subjective Risk Registers Fail Enterprise Audits
PMBOK Ledger Architecture & Qualitative Scoring Grid
| Col | Field Name | Type | Format | Operational Role |
|---|---|---|---|---|
| B | Risk ID | Alphanumeric Code | Text | Primary key identifying the risk item across change control tickets (`RSK-01` to `RSK-10`). |
| C | Category | Text Category | Text | Work breakdown stream responsible for risk oversight (Technical, Commercial, Schedule, Compliance). |
| D | Risk Description | Text String | General | Specific failure mode, root cause, and business consequence statement. |
| E | Probability | Integer (1-5) | 0 | Likelihood score (1: Rare to 5: Almost Certain) of risk materializing prior to completion. |
| F | Impact | Integer (1-5) | 0 | Severity score (1: Negligible to 5: Catastrophic) of operational disruption or financial loss. |
| G | Risk Score | Calculated Integer | 0 | Composite qualitative severity score spanning 1 to 25 (`=E23*F23`). |
| H | Severity Tier | Calculated Category | Text | Standardized PMO escalation band (`=IF(G23>=16,"CRITICAL",...)`). |
| I | Mitigation Strategy | Text Action Plan | General | Concrete architectural, commercial, or operational plan to eliminate or curb risk impact. |
| J | Risk Owner | Named Individual | Text | Single accountable program lead or engineer driving countermeasure execution. |
| K | Action Status | Controlled List | Data Validation | Current execution phase: Planned, Mitigating, Monitoring, or Closed. |
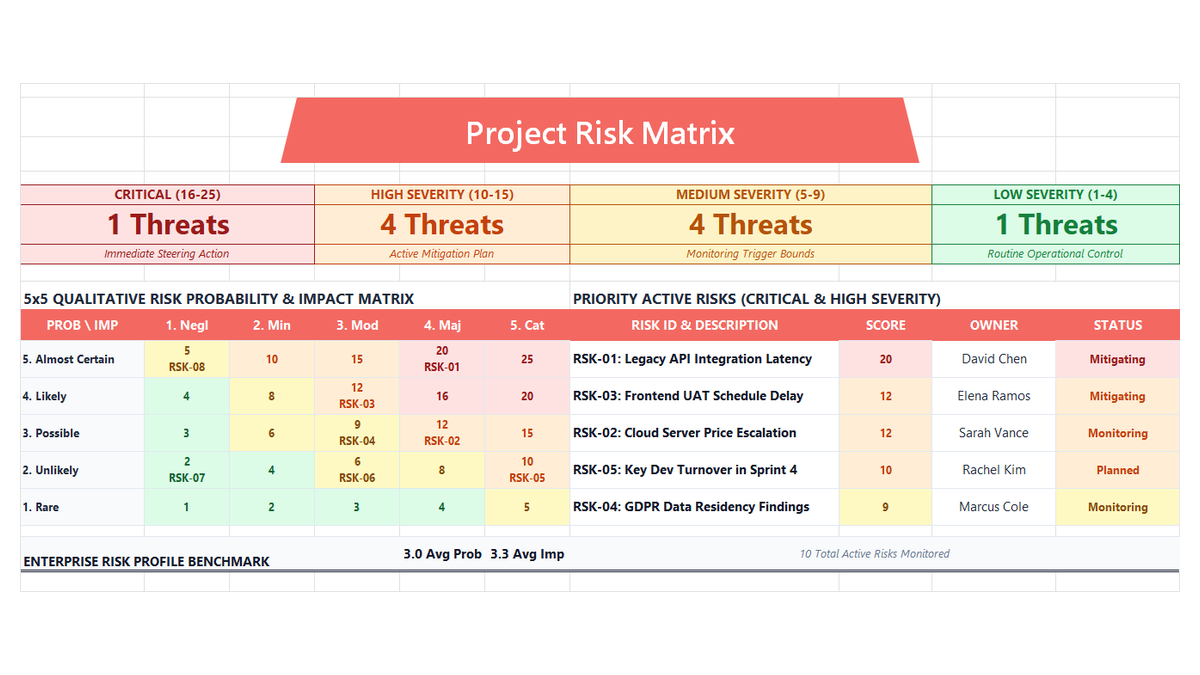
Workbook Blueprint: The Project Risk Register architecture showing top summary scorecards, the 5x5 qualitative matrix, and the detailed active mitigation ledger.
Now that the architecture is locked in, let us build each formula and interactive control step by step.
Step-by-Step Risk Engine Construction in Excel
1Step 1: Automating Composite Risk Scoring (=Probability * Impact)
Qualitative risk frameworks calculate exposure by multiplying Likelihood by Consequence. In your Excel risk register, this prevents subjective guessing by establishing an objective 1-to-25 scoring scale.
Select cell G23 in the active risk ledger. Type the formula: =E23*F23 and press Enter.
Excel multiplies Probability (4 in cell E23) by Impact (5 in cell F23), returning a composite risk score of 20 for RSK-01 (Legacy API Integration Latency).
Double-click the fill handle at the corner of cell G23 to copy the formula down through cell G32 across all logged project risks.
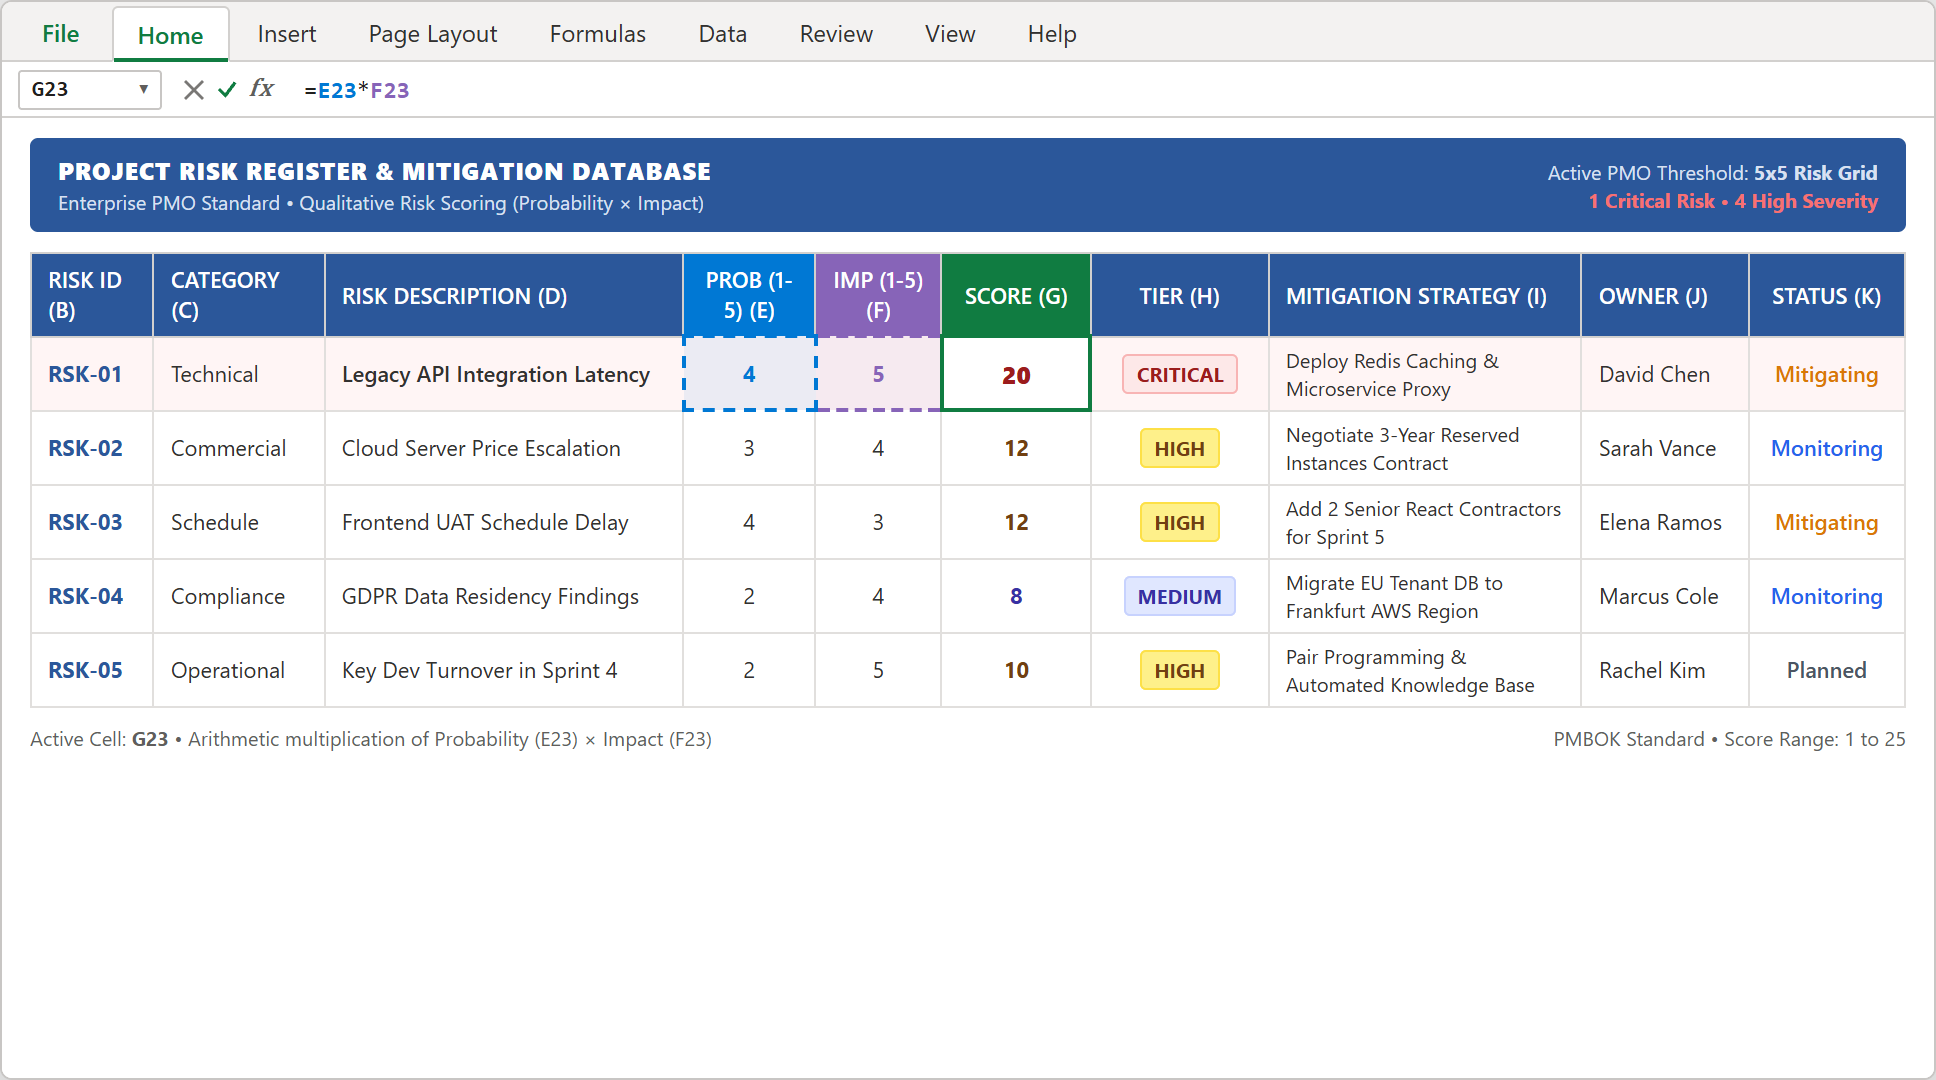
Step 1: Cell G23 calculating composite risk score with formula =E23*F23, highlighting source cells with dashed colored outlines.
2Step 2: Automating 4-Tier Severity Classification with Nested IF Logic
Raw numbers alone do not inform executives how quickly they must act. We must translate scores into actionable PMO tiers: Critical, High, Medium, and Low.
Click cell H23. Type the nested logical classification formula: =IF(G23>=16,"CRITICAL",IF(G23>=10,"HIGH",IF(G23>=5,"MEDIUM","LOW"))) and press Enter.
Because RSK-01 evaluates to 20 (which is ≥ 16), cell H23 instantly resolves to CRITICAL.
Replicate the formula down through cell H32. Risks scoring 10 to 15 become "HIGH", scores from 5 to 9 evaluate to "MEDIUM", and scores below 5 display "LOW".
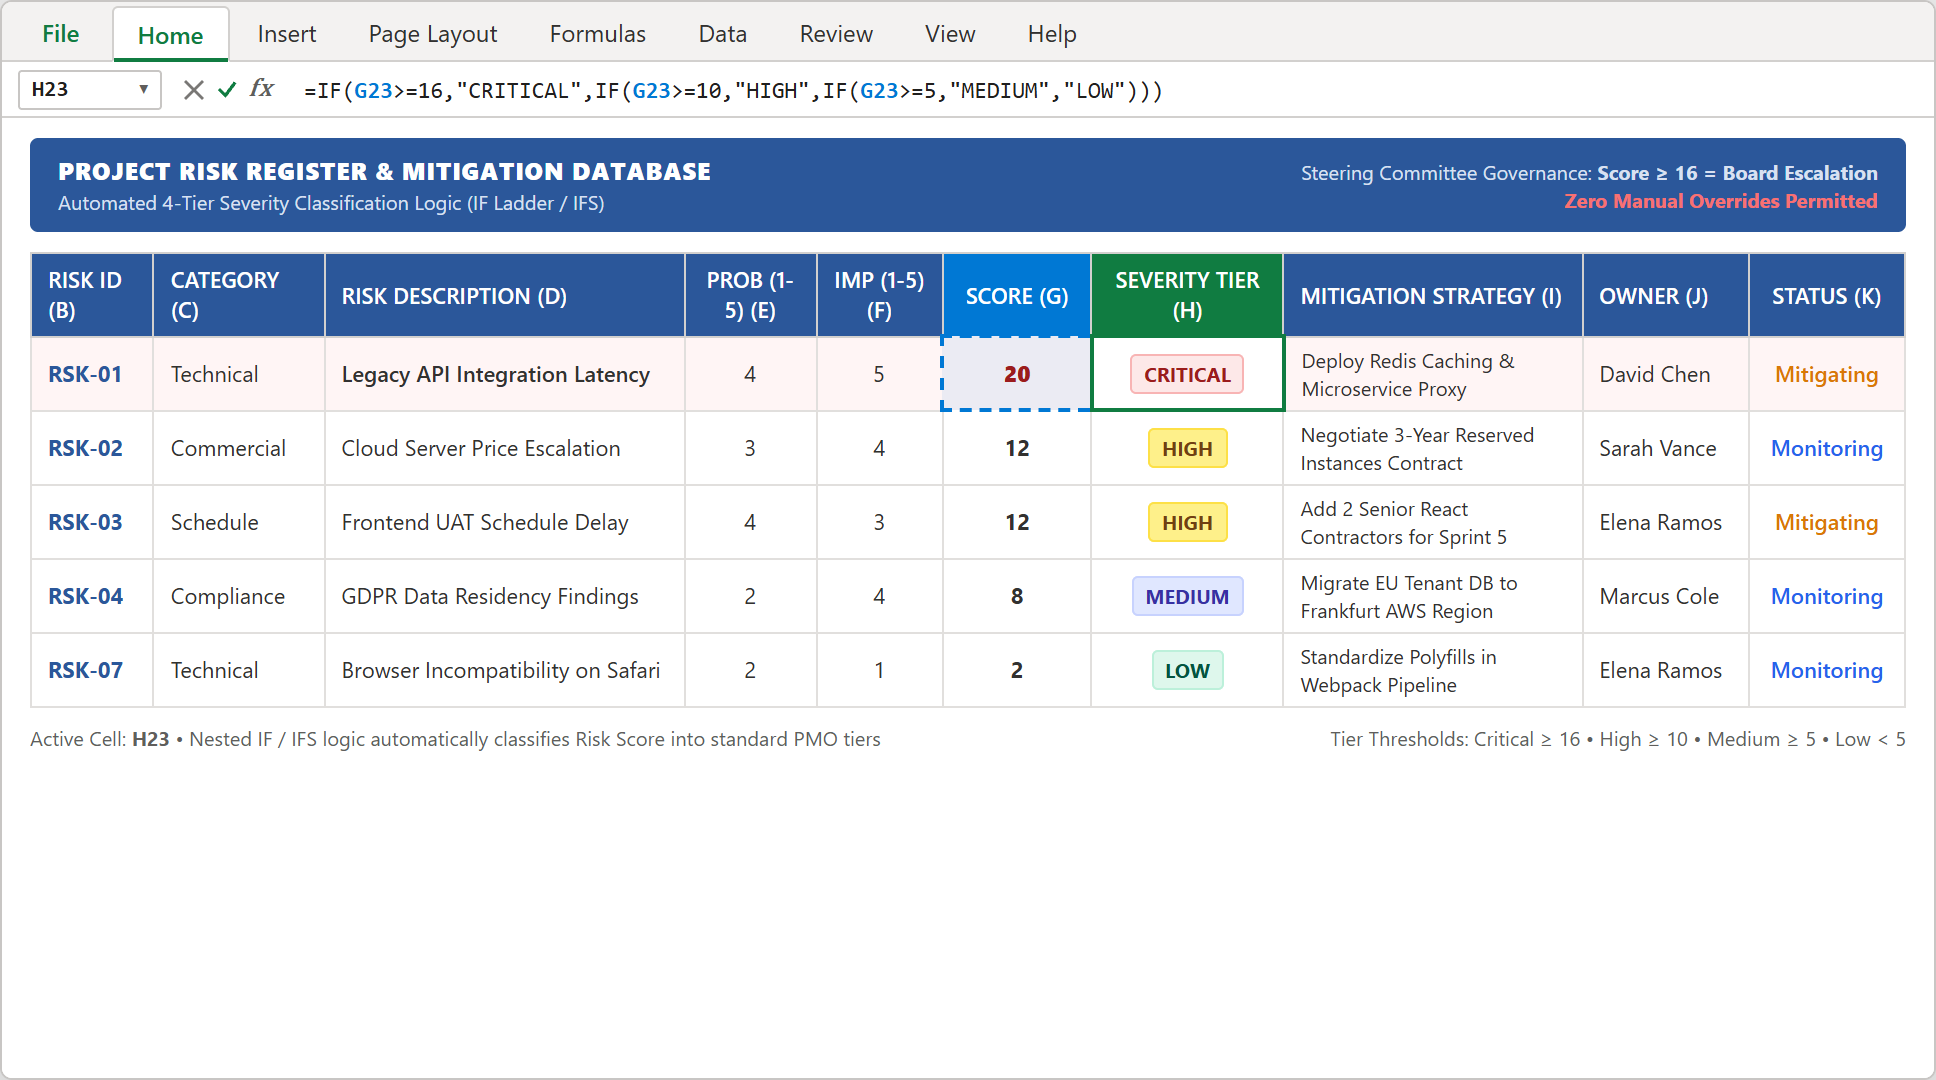
Step 2: Cell H23 evaluating nested IF logic to classify numerical risk scores into standardized governance bands.
3Step 3: Constructing the 5x5 Qualitative Matrix Heatmap Grid
Steering committees and executive sponsors need a bird's-eye view of project vulnerability without reading line-by-line entries.
Navigate to matrix range B10:G15. Set columns for 1. Negligible through 5. Catastrophic, and rows for 5. Almost Certain down to 1. Rare.
Apply a 4-tier Conditional Formatting color scale: Red for scores 16-25, Amber for 10-15, Soft Blue for 5-9, and Light Green for 1-4. Map active risk identifiers into their respective coordinates.
RSK-01 stands out immediately in the upper-right red danger zone (Probability 4, Impact 5), directing executive focus straight to critical architectural bottlenecks.
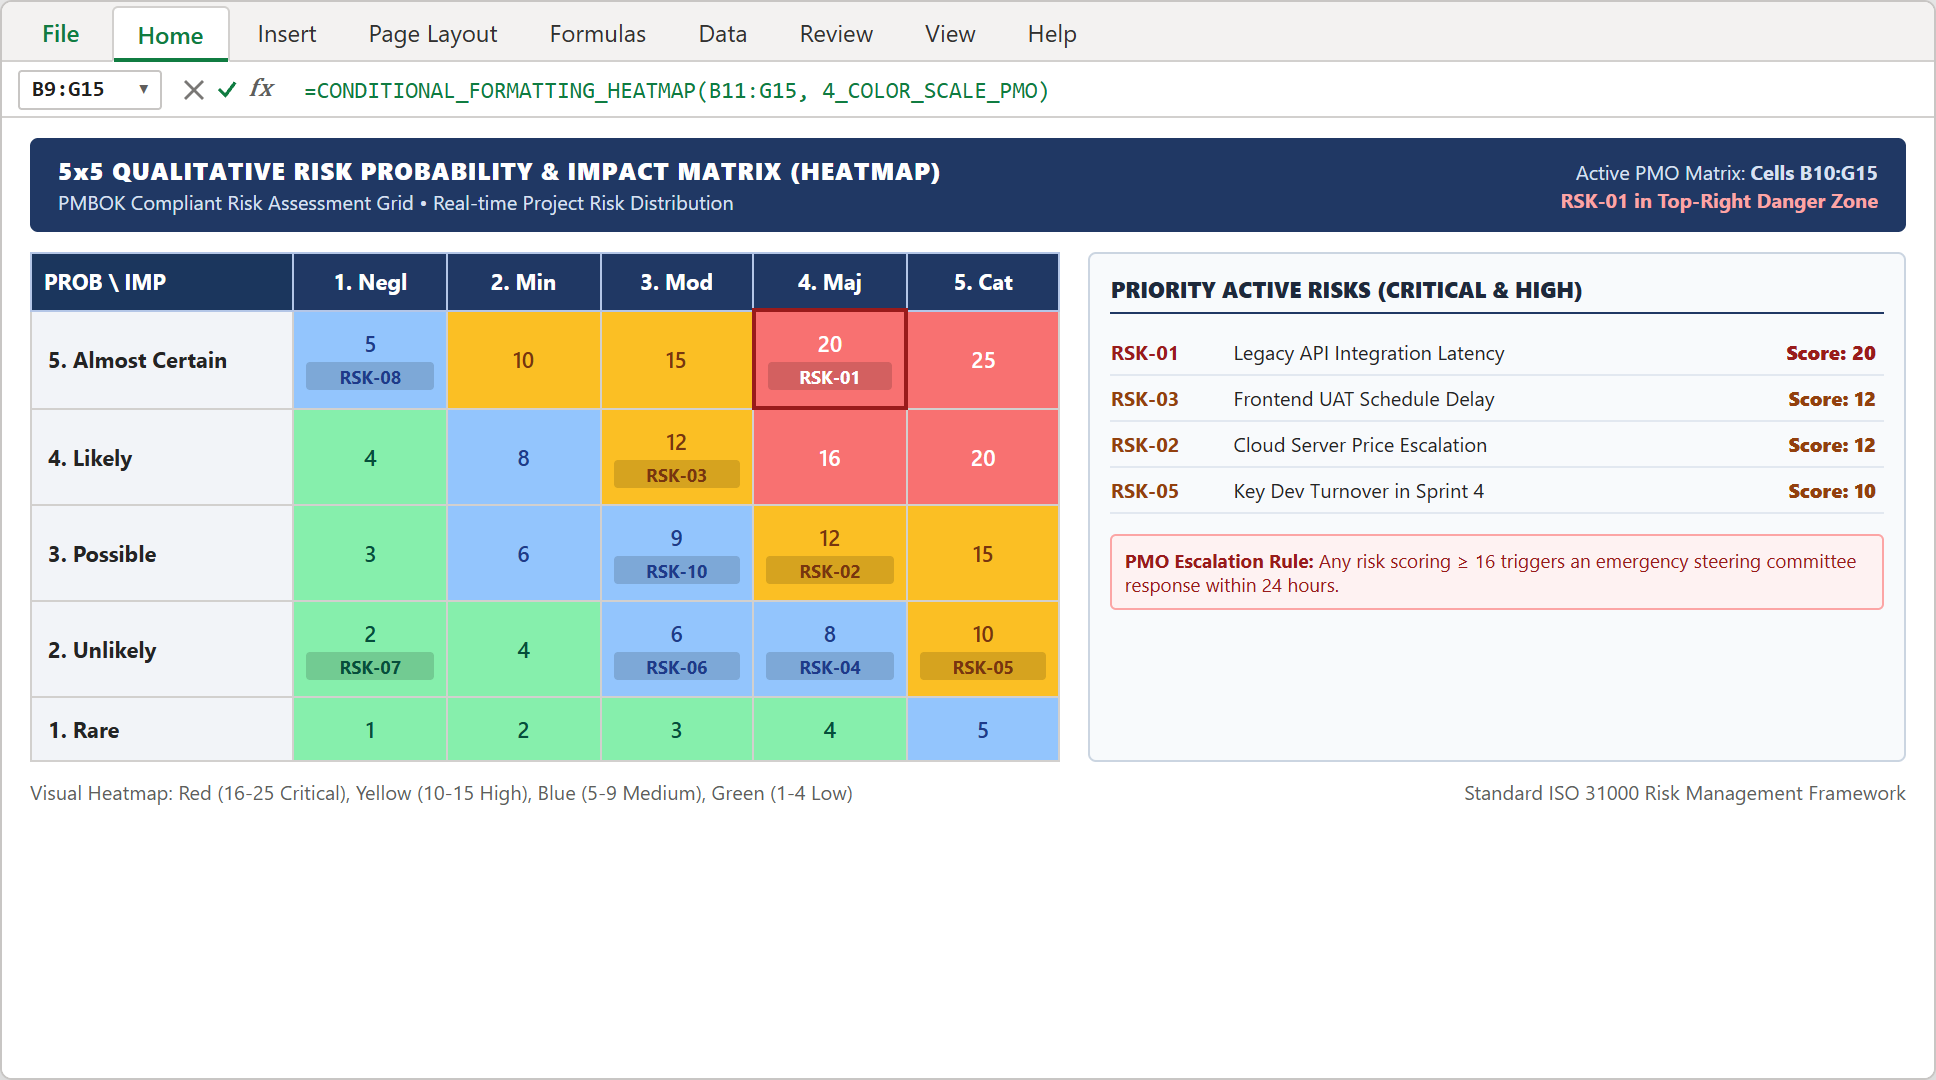
Step 3: Visual 5x5 qualitative risk matrix with color-coded severity quadrants and active risk tags.
4Step 4: Standardizing Mitigation Statuses with In-Cell Data Validation
Uncontrolled text entry in status columns creates messy variations like "In Progress", "WIP", or "underway", which breaks automated PMO tracking formulas.
Highlight range K23:K32. Open Data > Data Validation. Under Allow, choose List.
In the Source field, enter: Planned, Mitigating, Monitoring, Closed, then click OK.
Every cell in column K now features an in-cell selection dropdown arrow, guaranteeing clean, standardized inputs across all risk owners.
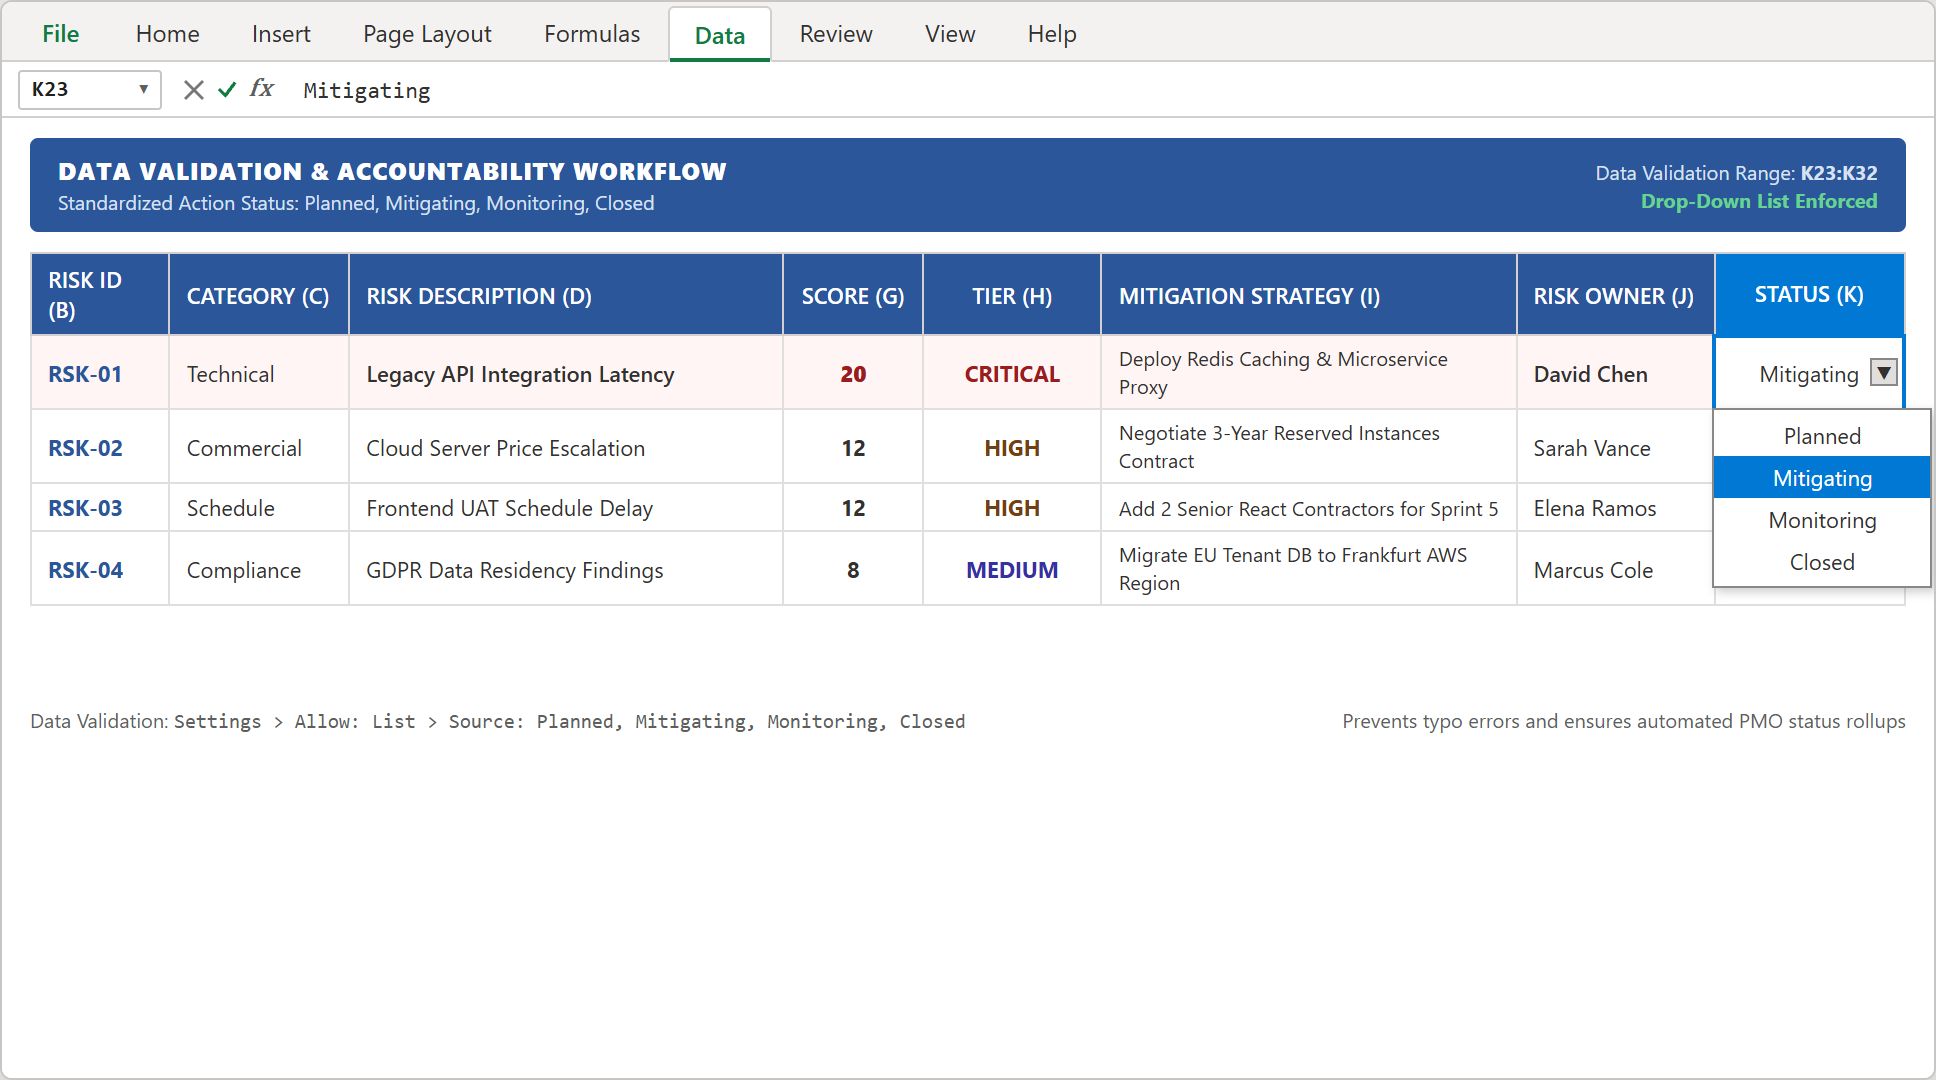
Step 4: In-cell dropdown arrow active on cell K23 displaying controlled mitigation status options.
5Step 5: Aggregating Executive Steering Committee KPI Scorecards
At the top of the worksheet (rows 5 to 7), build executive summary KPI scorecards that summarize the risk landscape at a glance.
In cell B5, enter =COUNTIF(H23:H32, "CRITICAL") to track existential threats. In cell E5, enter =COUNTIF(H23:H32, "HIGH") for active high-severity items.
The dashboard dynamically tallies 1 Critical Risk and 4 High Severity Risks, immediately establishing the agenda for weekly executive steering reviews.
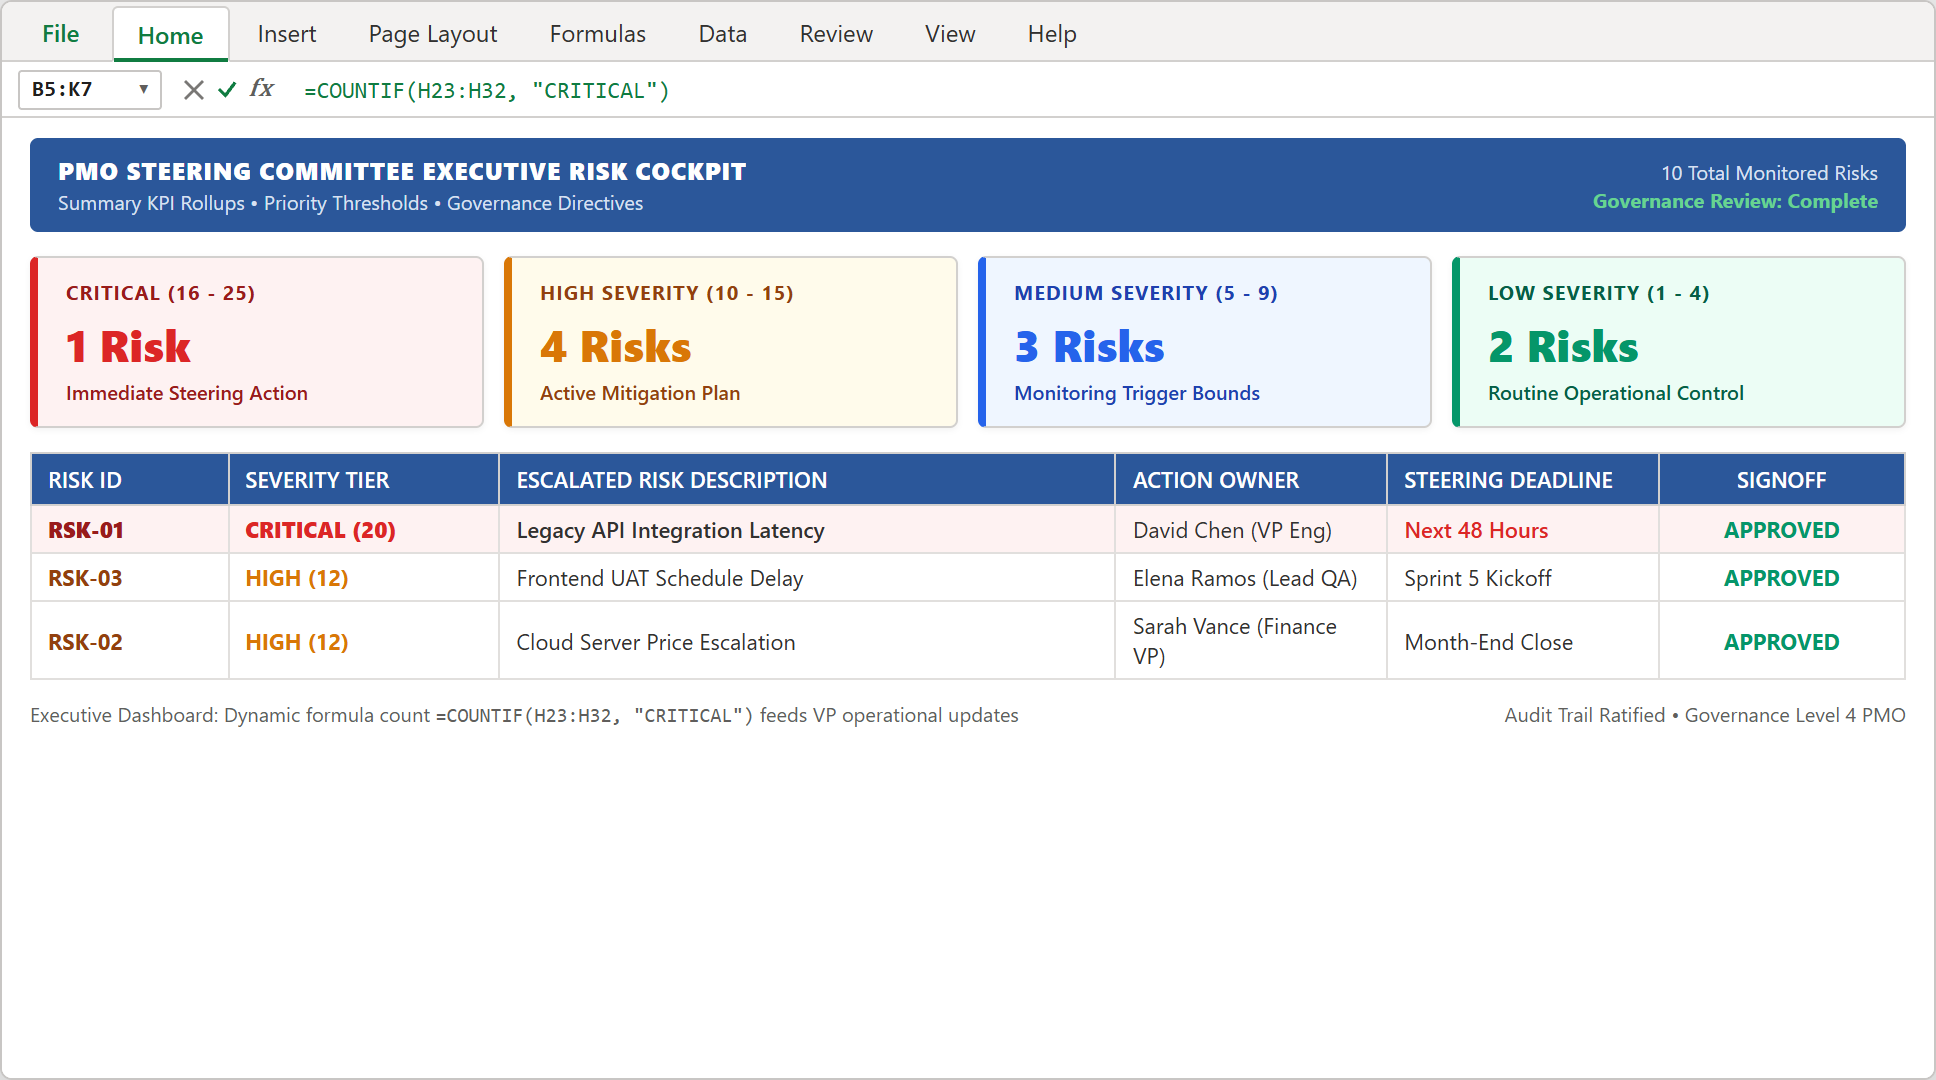
Step 5: Dynamic KPI cards aggregating Critical, High, Medium, and Low risk counts via COUNTIF formulas.
Steering Committee Governance & Escalation Bounds
Download Production Template & Practice Checklist

Spreadsheet educator and web developer passionate about hands-on interactive spreadsheet practice.
Related Practical Exercises
Explore more hands-on spreadsheet models with downloadable practice workbooks.
 Operations
Purchase Order Tracker Excel Template
Learn how to engineer a commercial procurement and purchase order tracker in Microsoft Excel featuring line item commitment multiplication, vendor fulfillment status monitoring, and accounts payable settlement reconciliations.
 Operations
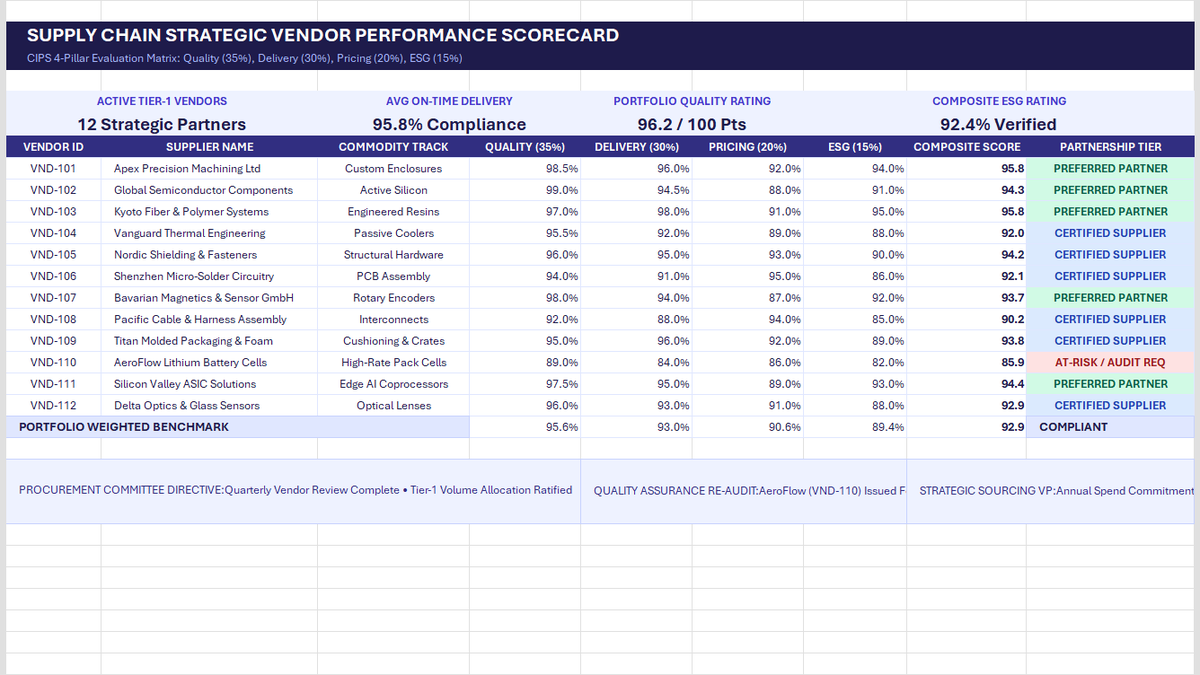
Vendor Performance Scorecard Excel Template
Learn strategic vendor evaluation in Microsoft Excel. Build a CIPS-compliant 4-pillar scorecard weighting Quality (35%), Delivery (30%), Pricing (20%), and ESG (15%). Automate weighted composite scores with SUMPRODUCT, calculate portfolio OTIF delivery, and establish tier-based purchase order allocations.
 Human Resources
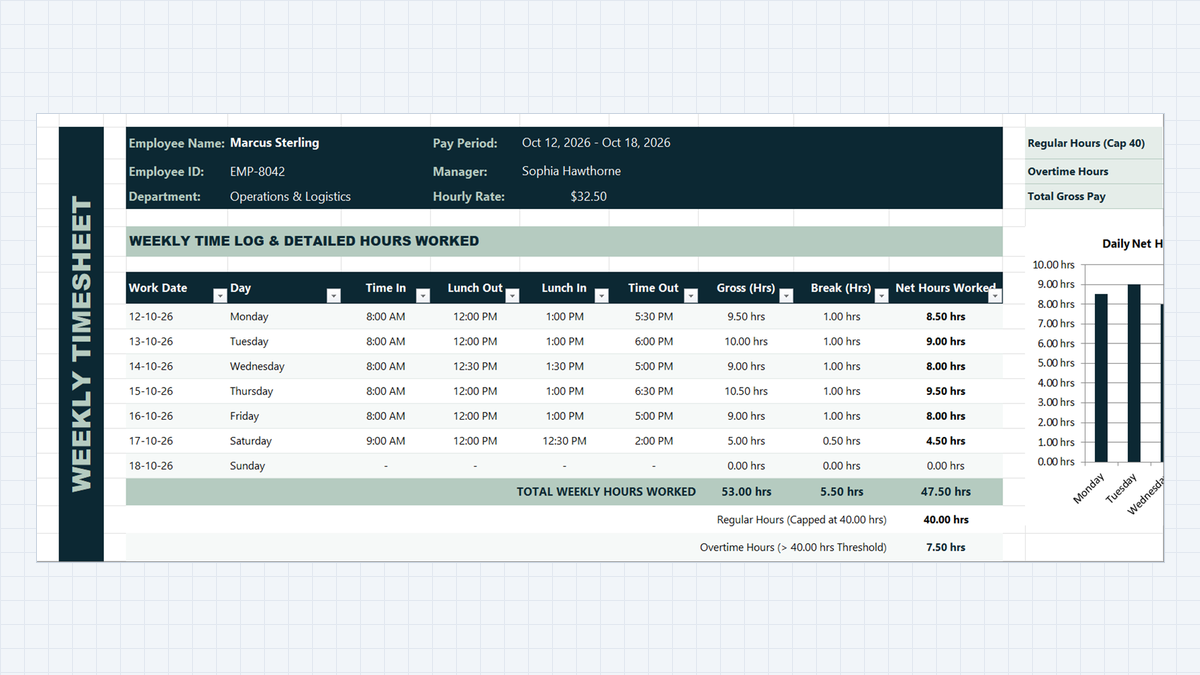
Employee Timesheet Calculator Excel Template
Track weekly employee work hours, lunch breaks, and overtime without mathematical headaches. Build a clean timesheet calculator in Microsoft Excel using simple time formulas, night-shift handling with MOD, and automatic overtime flags.
 Operations
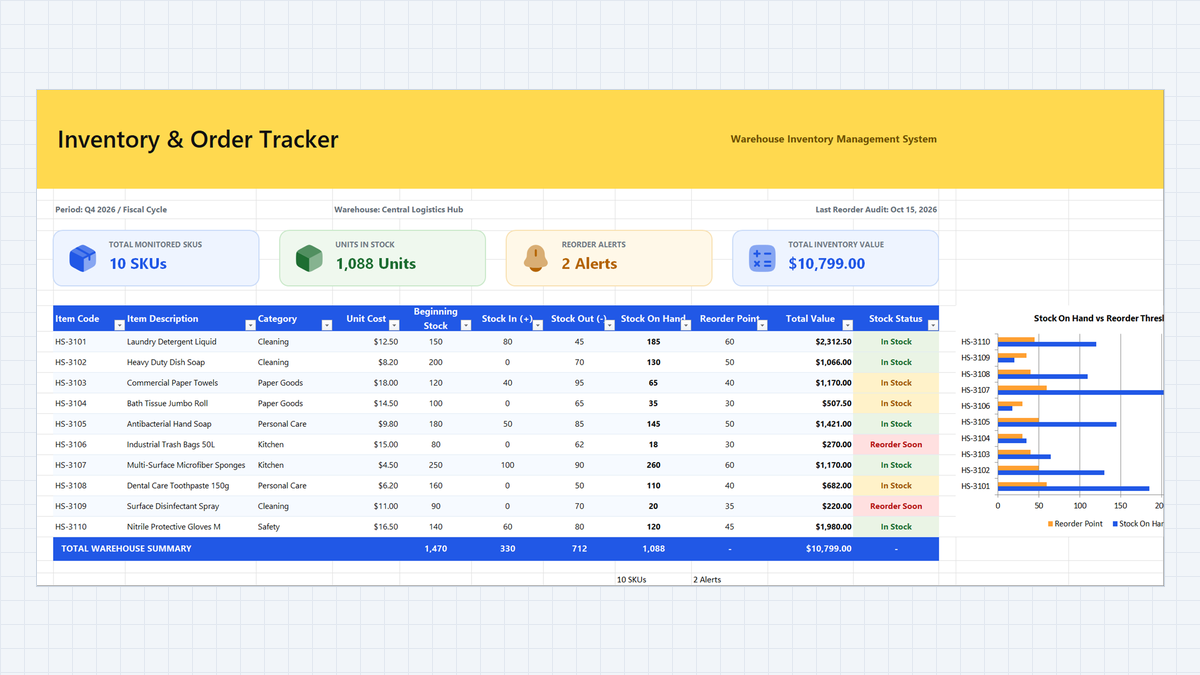
Inventory Tracking System Excel Template
Stop stockouts and mismatched stock counts. Build an Inventory Tracking System Excel Template with a strict IN/OUT movement log, automatic stock totals with SUMIFS, a smart reorder status with nested IF, and color alerts your warehouse team can read at a glance.
 Finance
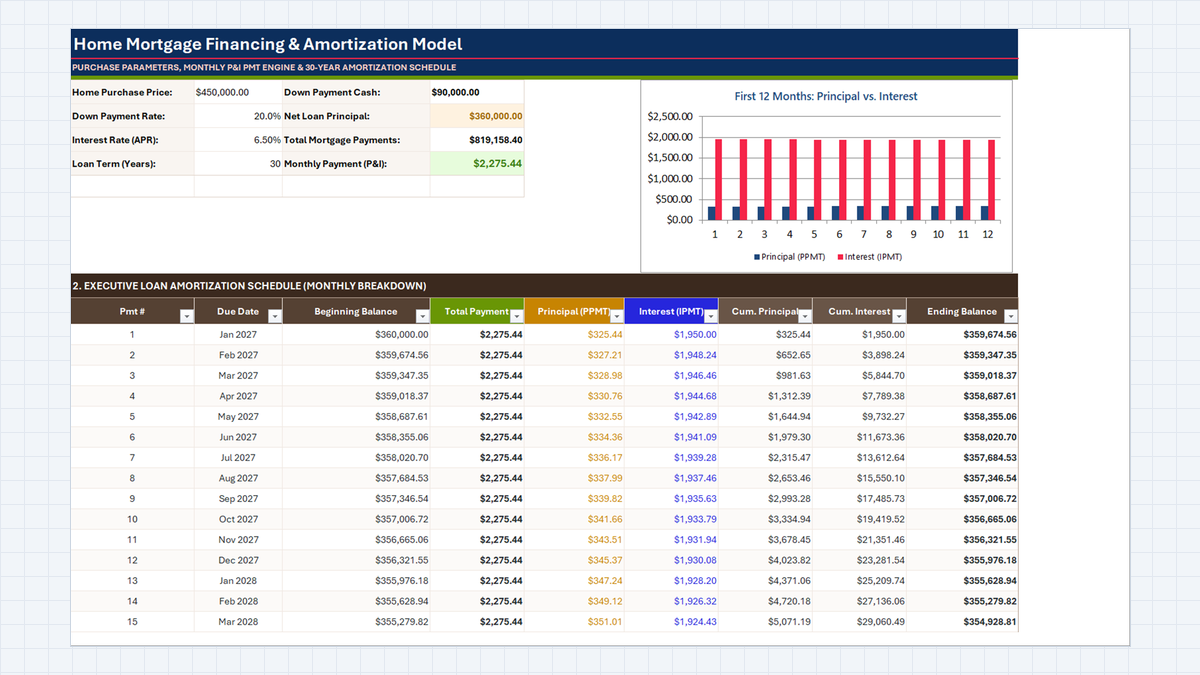
Mortgage Calculator Excel Template
See where every mortgage dollar goes. Build a Mortgage Calculator Excel Template that finds the monthly payment with PMT, splits each month into principal and interest with PPMT and IPMT, and tracks equity and ending balance in a clear amortization schedule.
Discussion
Ask questions, share formula tips, or discuss alternative approaches with fellow spreadsheet builders.
Loading discussion...