Most delivery projects do not fail in one big moment. They slip one week at a time. A database setup takes six weeks instead of five. An API build takes nine instead of eight. Nobody panics, because each delay looks small, but together they push your launch date.
In this guide you will build a Project Budget Estimator in Excel. It tracks 22 delivery workstreams across 26 weeks, compares plan against actual duration, and draws a Gantt chart inside the cells. You will also see how eight small one-week delays add up to a real risk for the Week 22 cutover.
Structuring a Work Breakdown Schedule (WBS)
| Phase | Activities | Weeks | Status |
|---|---|---|---|
| 1. Discovery & Architecture | 01 to 06: Scoping & Charter Sign-off through Design System & Component Token | 1-8 | All 6 at 100% |
| 2. Core Engineering & Integrations | 07 to 14: PostgreSQL HA Database Setup through Internal Alpha Sandbox Release | 6-17 | In progress, 7 of 8 slipped |
| 3. Security, QA & Handover | 15 to 20: Static Code Analysis & CVE Fixes through Operational Runbooks & Handover | 14-22 | Just starting |
| 4. Cutover & Hypercare | 21 to 22: Production Cutover & Deployment, Post-Launch Hypercare Support | 20-26 | Not started |
H2, and row 4 holds the period numbers.| Col | Field Name | Type | Format | Example From the Workbook |
|---|---|---|---|---|
| B | ACTIVITY | Text | General | <code>08. Microservices Core API Build</code>. The number keeps the list in start order. |
| C | PLAN START | Integer (period) | #,##0 | Baseline start week. Activity 08 starts in week <strong>7</strong>. |
| D | PLAN DURATION | Integer (periods) | #,##0 | Planned length. Activity 08 is planned for <strong>8</strong> weeks. |
| E | ACTUAL START | Integer (period) | #,##0 | When work really began. Activity 08 also began in week <strong>7</strong>. |
| F | ACTUAL DURATION | Integer (periods) | #,##0 | Weeks used so far. Activity 08 now shows <strong>9</strong> weeks. |
| G | PERCENT COMPLETE | Percentage | 0% | Progress from 0 to 1. Activity 08 is at <strong>85%</strong>. |
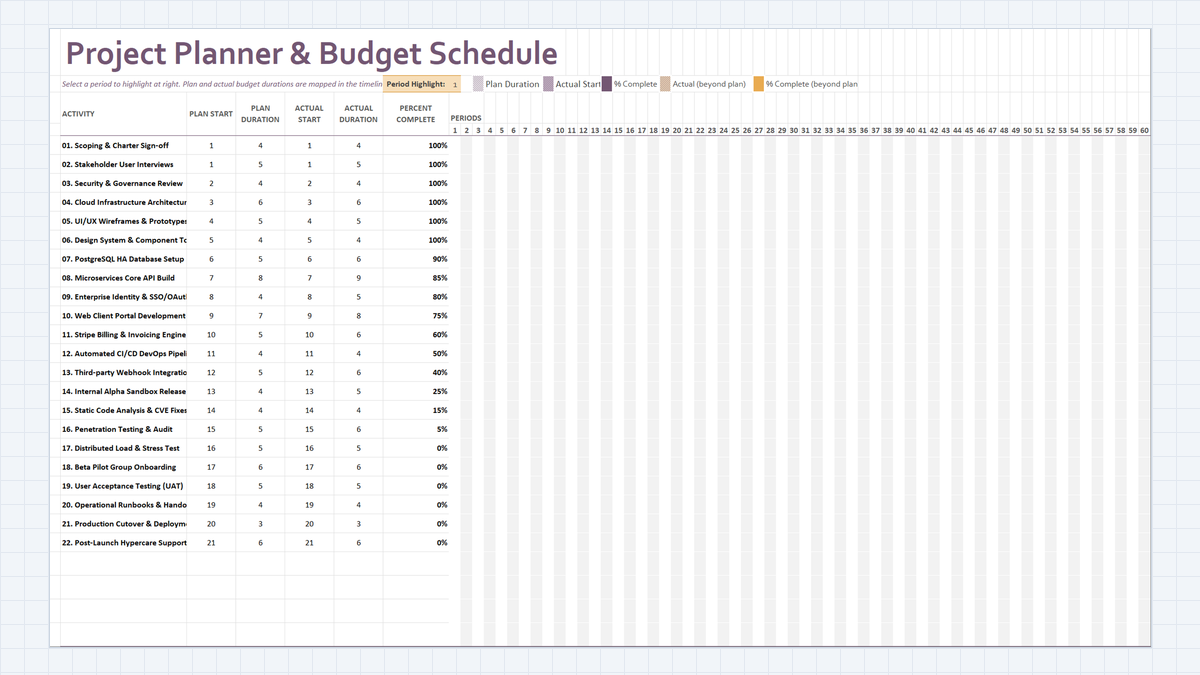
The finished planner: activity facts in columns B to G, and the Gantt timeline from column H.
Notice that the sheet has no Plan End column. The timeline works it out for you, and the next section shows how.
Mapping Plan vs Actual Duration and End-Period Math
=C5+D5-1, which gives week 4.E and F) and the gap between the two end weeks is your duration creep. Here are the activities where plan and actual disagree:| Activity | Plan | Actual | Plan End | Actual End | Creep |
|---|---|---|---|---|---|
| 07. PostgreSQL HA Database Setup | W6, 5w | W6, 6w | 10 | 11 | +1w |
| 08. Microservices Core API Build | W7, 8w | W7, 9w | 14 | 15 | +1w |
| 09. Enterprise Identity & SSO/OAuth | W8, 4w | W8, 5w | 11 | 12 | +1w |
| 10. Web Client Portal Development | W9, 7w | W9, 8w | 15 | 16 | +1w |
| 11. Stripe Billing & Invoicing Engine | W10, 5w | W10, 6w | 14 | 15 | +1w |
| 13. Third-party Webhook Integrations | W12, 5w | W12, 6w | 16 | 17 | +1w |
| 14. Internal Alpha Sandbox Release | W13, 4w | W13, 5w | 16 | 17 | +1w |
| 16. Penetration Testing & Audit | W15, 5w | W15, 6w | 19 | 20 | +1w |
Scenario The plan adds up to 108 task-weeks. The actuals add up to 116. That is 8 extra task-weeks, about 7% over, and every one of the 8 slipped activities is exactly one week late. Small numbers like these are easy to ignore, which is why you track them.
The other 14 activities match their plan exactly. Activity 12, the CI/CD pipeline, is a good example: planned 4 weeks from week 11, actual 4 weeks from week 11, end week 14 both ways.
Building Dynamic In-Cell Gantt Bars and Conditional Highlighting
H5:BO30, where each column is one period from H4 to BO4. Conditional formatting colors a cell when its period falls inside a task span, so the bars move on their own when you edit columns C to F.| Layer | What it paints | Rule idea |
|---|---|---|
| Plan | Neutral bar from plan start to plan end | Period sits between plan start and plan start plus duration minus 1 |
| Actual | Blue bar from actual start to actual end | Same test, using the actual columns |
| Percent complete | Solid fill across the finished share of the bar | Test the period against start plus duration times percent |
| Beyond plan | Different shade for actual weeks past the plan | Actual bar cell that is not inside the plan span |
PeriodInPlan and PeriodInActual, and uses MEDIAN to check whether a period sits between a start and an end. Those names make each conditional rule short and easy to read.H2 is named period_selected and has a Data Validation list, so you pick a week from a dropdown. A rule such as H$4=period_selected shades the matching column in the header and the grid. The $ locks the row, so the rule always reads the period numbers in row 4 while the column moves.Tip Set H2 to the current sprint week before a status meeting. The whole column lights up, and everyone sees which bars cross it.
Tracking Percent Complete and Managing Scope Slippage
| Group | Activities | Percent Complete |
|---|---|---|
| Done | 01 to 06 | 100% |
| In progress | 07 to 16 | 90%, 85%, 80%, 75%, 60%, 50%, 40%, 25%, 15%, 5% |
| Not started | 17 to 22 | 0% |
Risk Four activities all end in week 22: 18. Beta Pilot Group Onboarding, 19. User Acceptance Testing, 20. Operational Runbooks & Handover, and 21. Production Cutover & Deployment. Another one-week slip in testing would land directly on the cutover date.
- Freeze the baseline. Never overwrite columns C and D after kickoff. Record changes in E and F only, so the variance stays visible.
- Watch the 1-week pattern. When most late tasks are late by the same amount, the estimates are too tight. Fix the estimate, not only the task.
- Count progress honestly. Only set column G to 100% after formal sign-off, not when the code is merged.

Spreadsheet educator and web developer passionate about hands-on interactive spreadsheet practice.
Related Practical Exercises
Explore more hands-on spreadsheet models with downloadable practice workbooks.
 Project Management
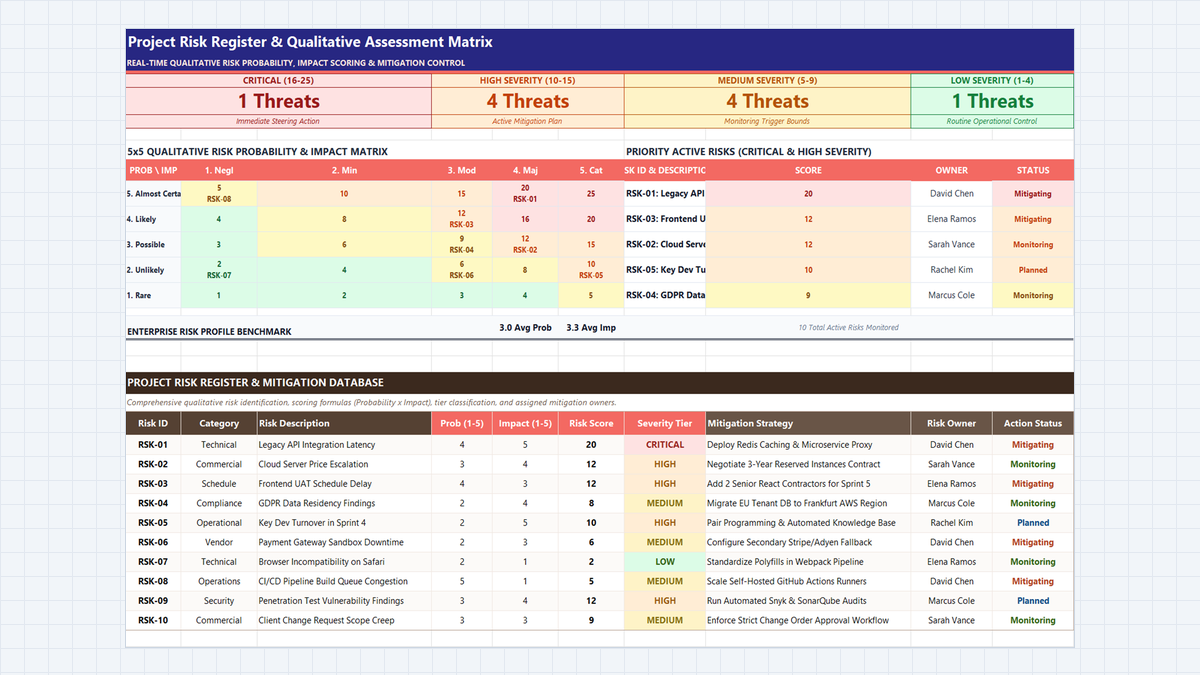
Project Risk Register Excel Template
Learn enterprise risk governance in Microsoft Excel. Build an ISO 31000 and PMBOK-compliant 5x5 qualitative risk heatmap, automate probability and impact scoring, engineer multi-tier severity formulas, and enforce accountability with data validation.
 Operations
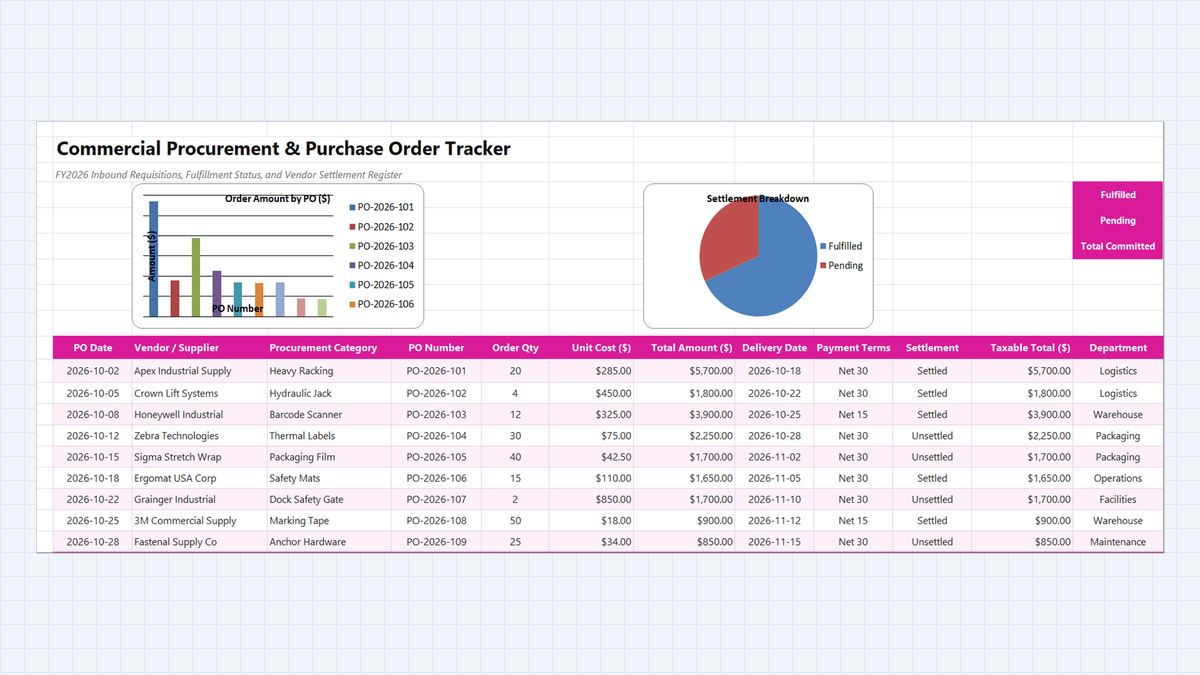
Purchase Order Tracker Excel Template
Learn how to engineer a commercial procurement and purchase order tracker in Microsoft Excel featuring line item commitment multiplication, vendor fulfillment status monitoring, and accounts payable settlement reconciliations.
 Operations
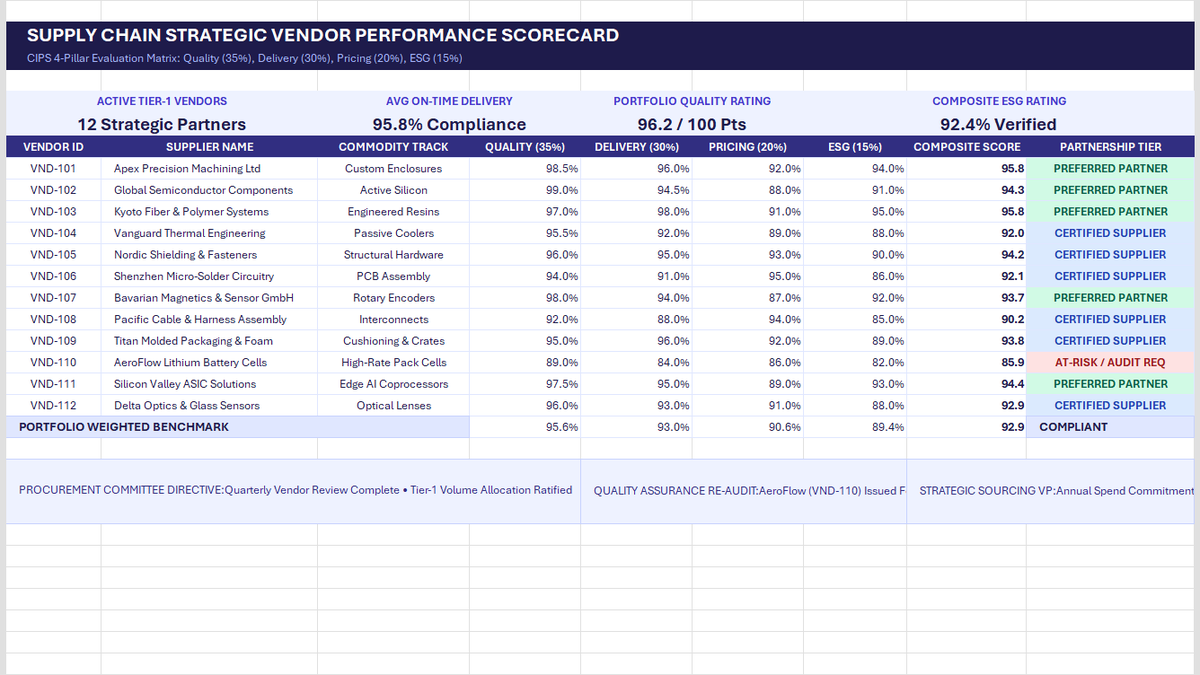
Vendor Performance Scorecard Excel Template
Learn strategic vendor evaluation in Microsoft Excel. Build a CIPS-compliant 4-pillar scorecard weighting Quality (35%), Delivery (30%), Pricing (20%), and ESG (15%). Automate weighted composite scores with SUMPRODUCT, calculate portfolio OTIF delivery, and establish tier-based purchase order allocations.
 Human Resources
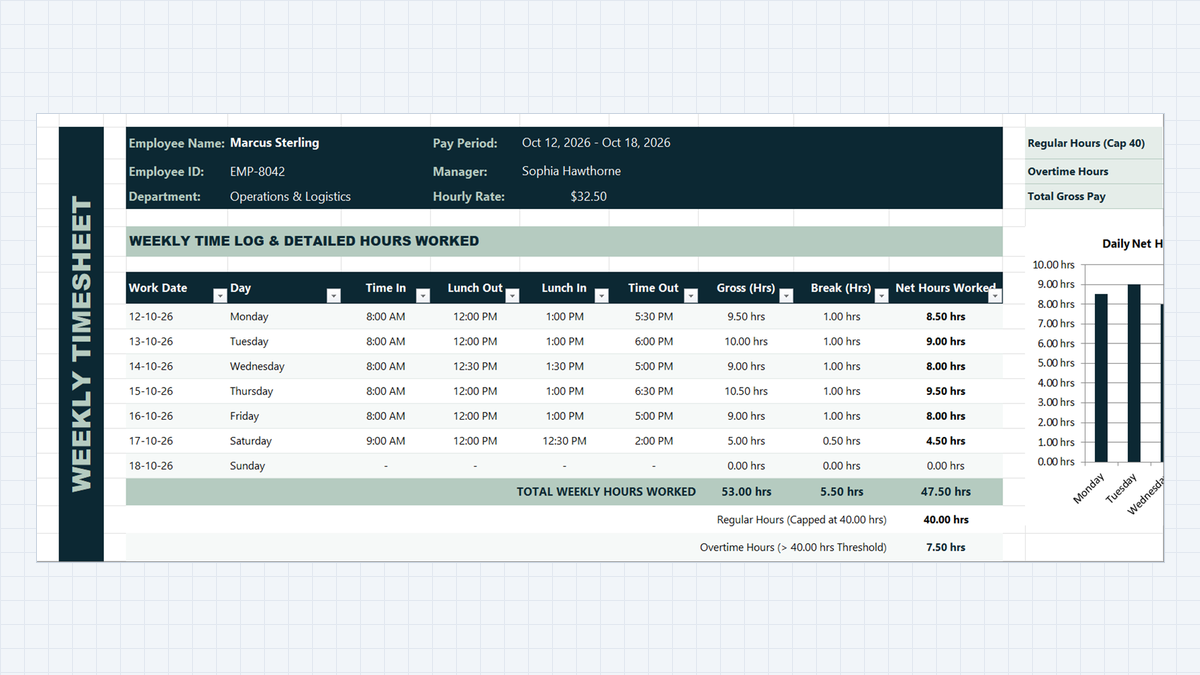
Employee Timesheet Calculator Excel Template
Track weekly employee work hours, lunch breaks, and overtime without mathematical headaches. Build a clean timesheet calculator in Microsoft Excel using simple time formulas, night-shift handling with MOD, and automatic overtime flags.
 Operations
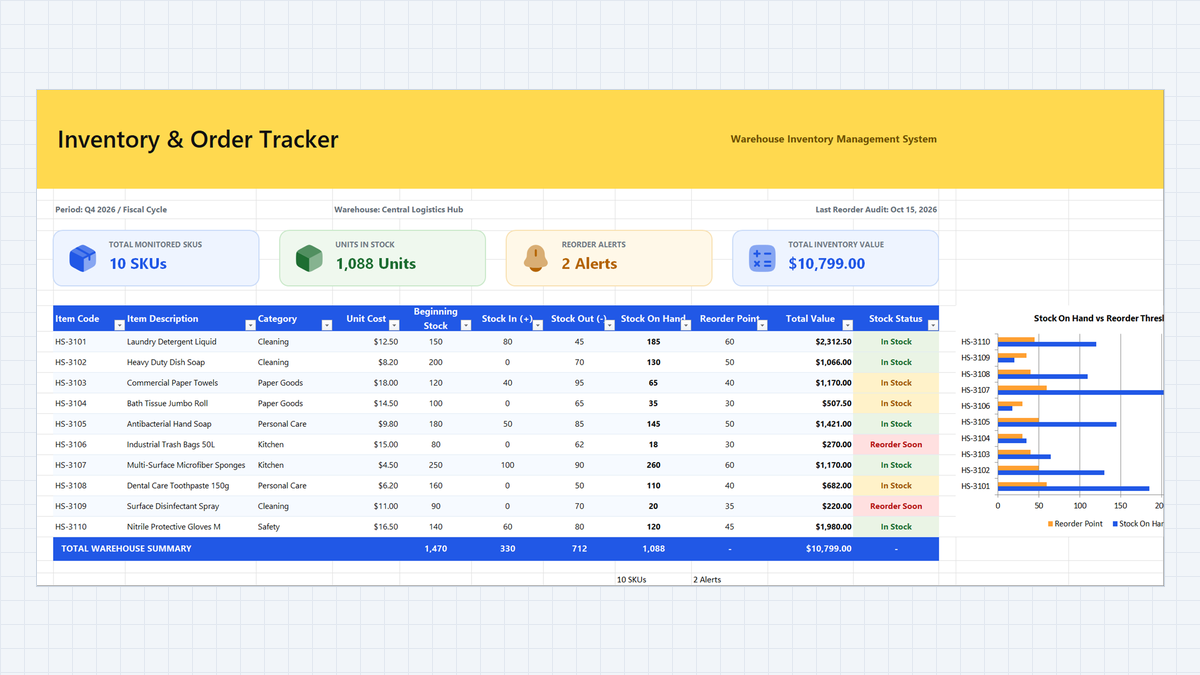
Inventory Tracking System Excel Template
Stop stockouts and mismatched stock counts. Build an Inventory Tracking System Excel Template with a strict IN/OUT movement log, automatic stock totals with SUMIFS, a smart reorder status with nested IF, and color alerts your warehouse team can read at a glance.
Discussion
Ask questions, share formula tips, or discuss alternative approaches with fellow spreadsheet builders.
Loading discussion...