Your income can rise every year while your wealth barely moves. The only way to know is to measure it. A Personal Net Worth Tracker puts everything you own and everything you owe on one sheet, so one number tells you whether you are moving forward.
In this workbook, a household grows its net worth from $607,800 to $755,850 in one year. That is a gain of $148,050, or +24.36%, even though gross assets grew only +13.30%. The gap comes from debt paydown, and by the end of this guide you will know exactly how to see it in your own numbers.
We follow the real sheet, called Personal Net Worth, from the scorecards in rows 5 to 7 down to the net worth line in row 29. Open the template next to this page and build along.
Understanding the Personal Balance Sheet Architecture
| Col | Field Name | Type | Format | Real Data Example |
|---|---|---|---|---|
| B | Asset / Liability Category | Text | General | Emergency Cash Reserve (High-Yield Savings), Primary Mortgage Principal Balance. |
| C | Prior Year (2025) | Currency input | $#,##0 | <code>C11</code> = $42,000 for the emergency cash reserve a year ago. |
| D | Current Value (2026) | Currency input | $#,##0 | <code>D11</code> = $48,500 for the same account today. |
| E | Net Change ($) | Formula (Currency) | $#,##0 | <code>E11</code> = +$6,500; <code>E24</code> = -$13,000 mortgage paydown. |
| F | YoY Growth (%) | Formula (Percentage) | +0.0%;-0.0%;0.0% | <code>F16</code> = +23.1% for the 401(k); <code>F26</code> = -25.0% for the credit card. |
| G | % of Total | Formula (Ratio) | 0.0% | Asset rows divide by total gross assets (<code>G19</code> = 46.2% for the home). Debt rows divide by total liabilities (<code>G24</code> = 95.0% for the mortgage). <code>G22</code> and <code>G27</code> are typed as 100%. |
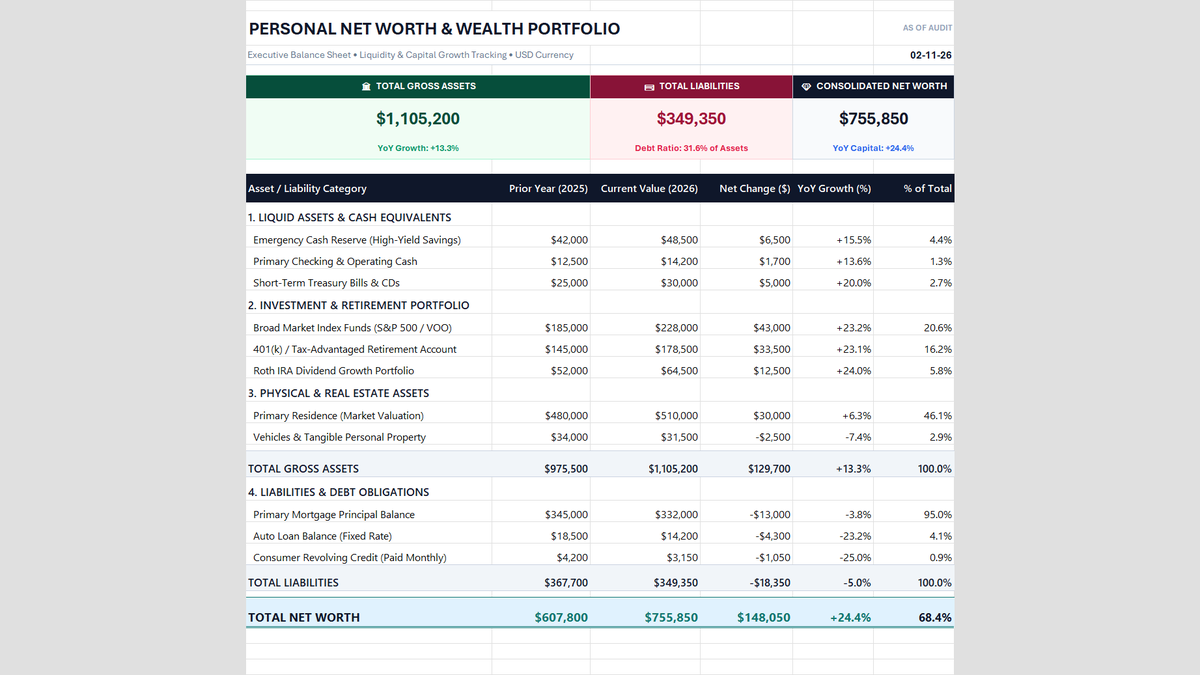
The finished tracker: three scorecards on top, assets and liabilities in the middle, net worth in row 29.
Two small details help later. Column F shows a plus or minus sign, so gains and losses are easy to scan. And the sheet displays percentages with one decimal, while the exact values carry more digits, such as 24.36%.
Categorizing Liquid, Invested & Real Estate Equity
Liquid cash: $92,700
This tier covers emergencies and short-term goals. The emergency reserve in a high-yield savings account rose from $42,000 to $48,500 (+$6,500, +15.48%). Treasury bills and CDs went from $25,000 to $30,000 (+20.00%), and checking from $12,500 to $14,200 (+13.60%).
Cash is only 8.39% of the portfolio, but it is the tier that keeps you from selling investments at a bad time.
Investments and retirement: $471,000
This is the engine of growth. The S&P 500 index fund holding grew from $185,000 to $228,000 (+$43,000, +23.24%), the 401(k) from $145,000 to $178,500 (+$33,500, +23.10%), and the Roth IRA from $52,000 to $64,500 (+$12,500, +24.04%).
Together these three lines added $89,000, which is more than two thirds of all asset growth.
Real estate and tangibles: $541,500
The primary residence is valued at $510,000, up $30,000 (+6.25%) from $480,000. It alone is 46.15% of gross assets. Vehicles and tangible property slipped from $34,000 to $31,500 (-$2,500, -7.35%).
A home is not cash. Its market value is an estimate, so treat this row as a yearly appraisal, not a daily number.
Tracking Debt Amortization & Liabilities
Calculating YoY Net Growth & Allocation Health
Personal Net Worth sheet. Each one builds on the last.1Step 1: Total the Assets and the Debts
In D22, add the seven asset accounts and skip the three tier headings in rows 10, 14 and 18: =SUM(D$11:D$13, D$15:D$17, D$19:D$20). The result is $1,105,200.
In D27, add the three debts: =SUM(D$24:D$26). The result is $349,350. Repeat both in column C to get $975,500 and $367,700.
2Step 2: Subtract Debt from Assets
In D29, type =D$22-D$27. That is $1,105,200 - $349,350 = $755,850. The dollar sign before the row number locks the row, so the same pattern works in column C: $975,500 - $367,700 = $607,800.
The scorecard in F6 simply points back to D29, so the top of the sheet always matches the bottom.
3Step 3: Measure Year-Over-Year Growth
Dollar change is current minus prior: in E29, =D29-C29 gives +$148,050. Percentage growth divides that change by the prior year: in F29, =(D29-C29)/C29 gives +24.36%.
Compare the three headline growth rates: assets +13.30%, debt -4.99% and net worth +24.36%. Net worth grew almost twice as fast as assets because it gets two boosts: $129,700 of asset growth and $18,350 of debt paydown. That split is 87.6% from assets and 12.4% from paying debt down.
4Step 4: Check Weights and Ratios
Portfolio weight divides each account by total gross assets, with the total locked: =D11/$D$22. The index fund is 20.63%, the 401(k) is 16.15%, the Roth IRA is 5.84% and the home is 46.15%.
Two ratios show overall health. The equity ratio is net worth divided by gross assets: =D29/$D$22 gives 68.39%. Its mirror, the debt ratio, is liabilities divided by gross assets: 31.61%. The two always add up to 100%.
A rising equity ratio means you own more of what you hold. One watch-out: nearly half of your assets (46.15%) sit in one house. If you want more balance, the Allocation weights in column G show where to add next.

Spreadsheet educator and web developer passionate about hands-on interactive spreadsheet practice.
Related Practical Exercises
Explore more hands-on spreadsheet models with downloadable practice workbooks.
 Finance
Profit and Loss Statement Template
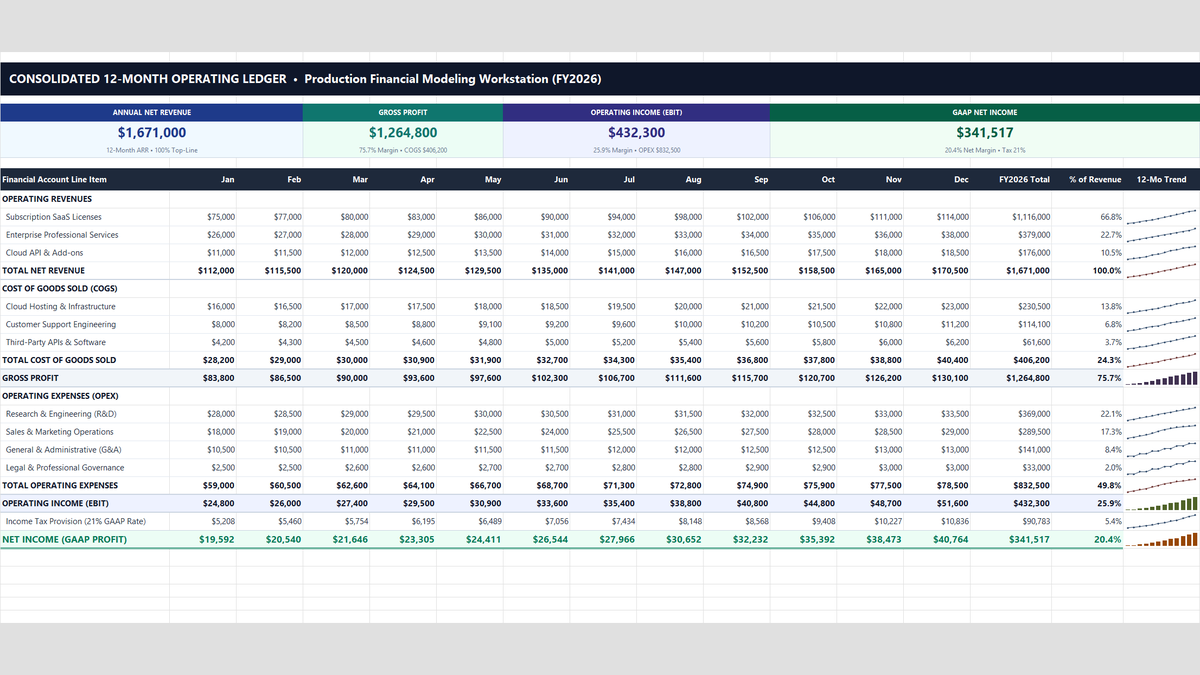
A 12-month Profit and Loss statement in Excel that shows where every revenue dollar goes. Type your monthly numbers once, and gross profit, operating income, tax, net income and margin percentages update on their own.
 Project Management
Project Budget Estimator Excel Template
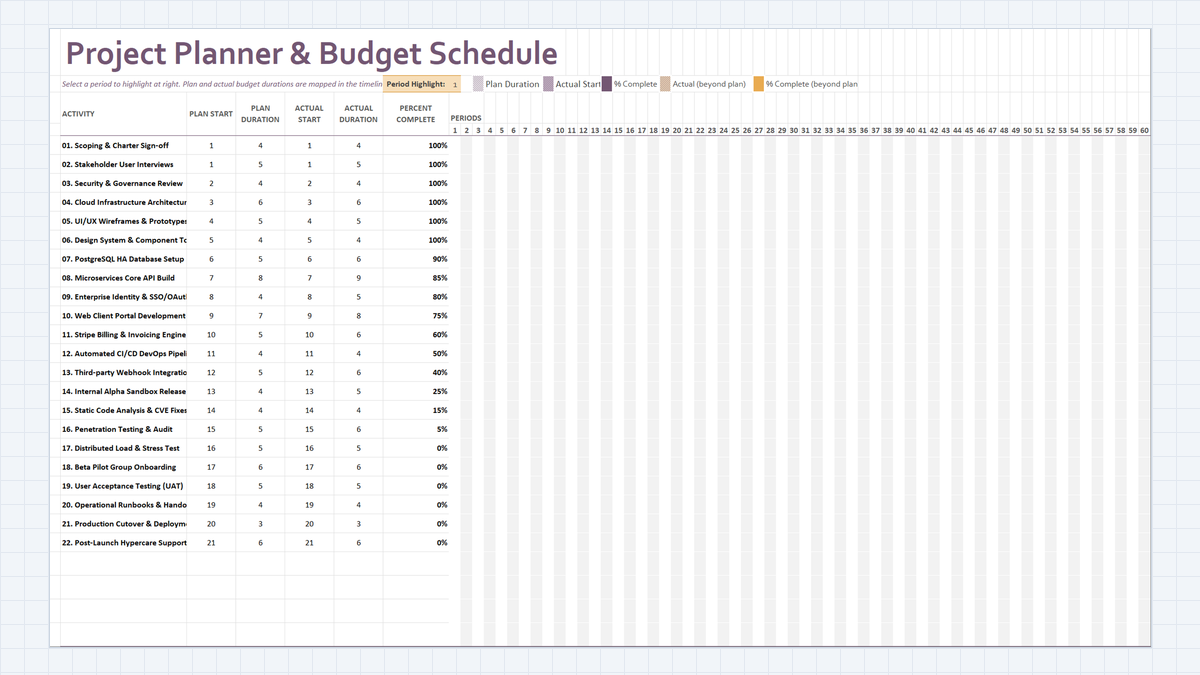
Build a Project Planner & Budget Schedule in Excel: 22 delivery workstreams, plan vs actual duration math, a dynamic in-cell Gantt chart, and percent-complete tracking that shows where schedule slippage starts.
 Project Management
Project Risk Register Excel Template
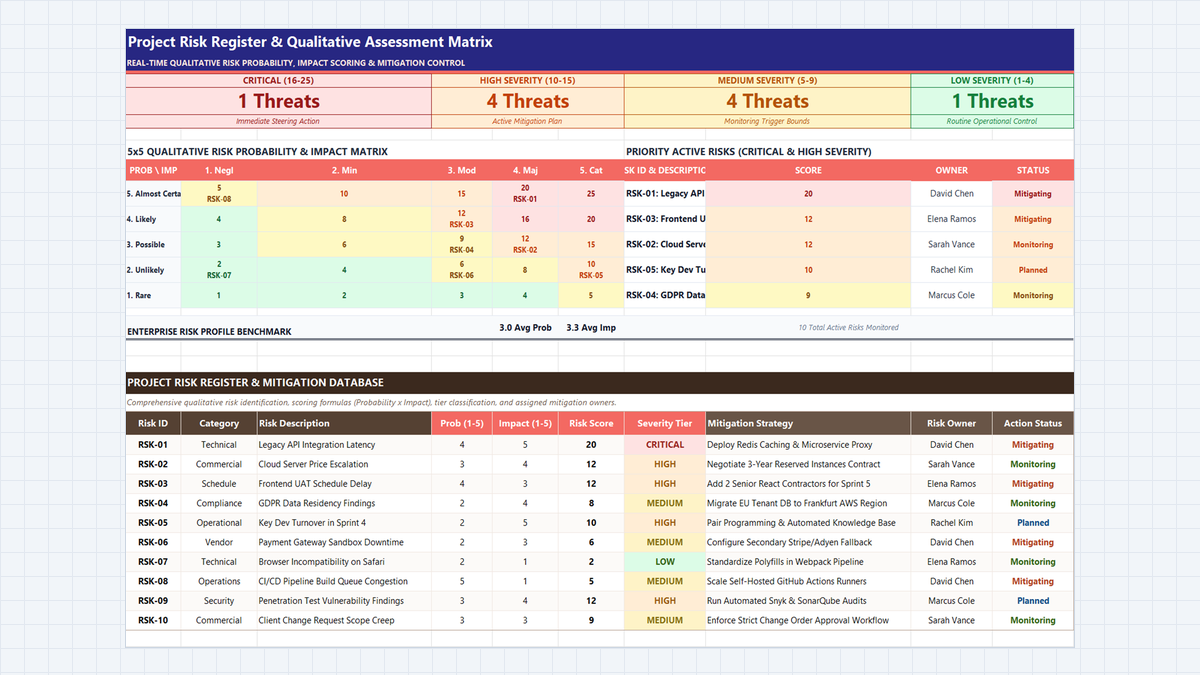
Learn enterprise risk governance in Microsoft Excel. Build an ISO 31000 and PMBOK-compliant 5x5 qualitative risk heatmap, automate probability and impact scoring, engineer multi-tier severity formulas, and enforce accountability with data validation.
 Operations
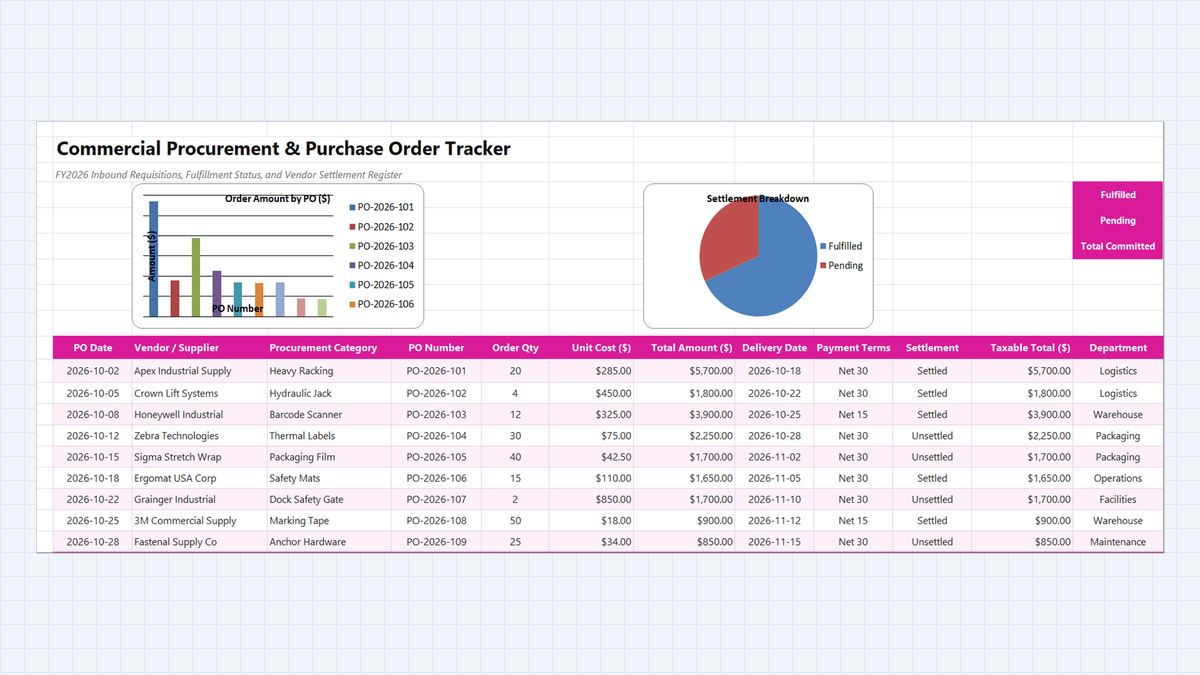
Purchase Order Tracker Excel Template
Learn how to engineer a commercial procurement and purchase order tracker in Microsoft Excel featuring line item commitment multiplication, vendor fulfillment status monitoring, and accounts payable settlement reconciliations.
 Operations
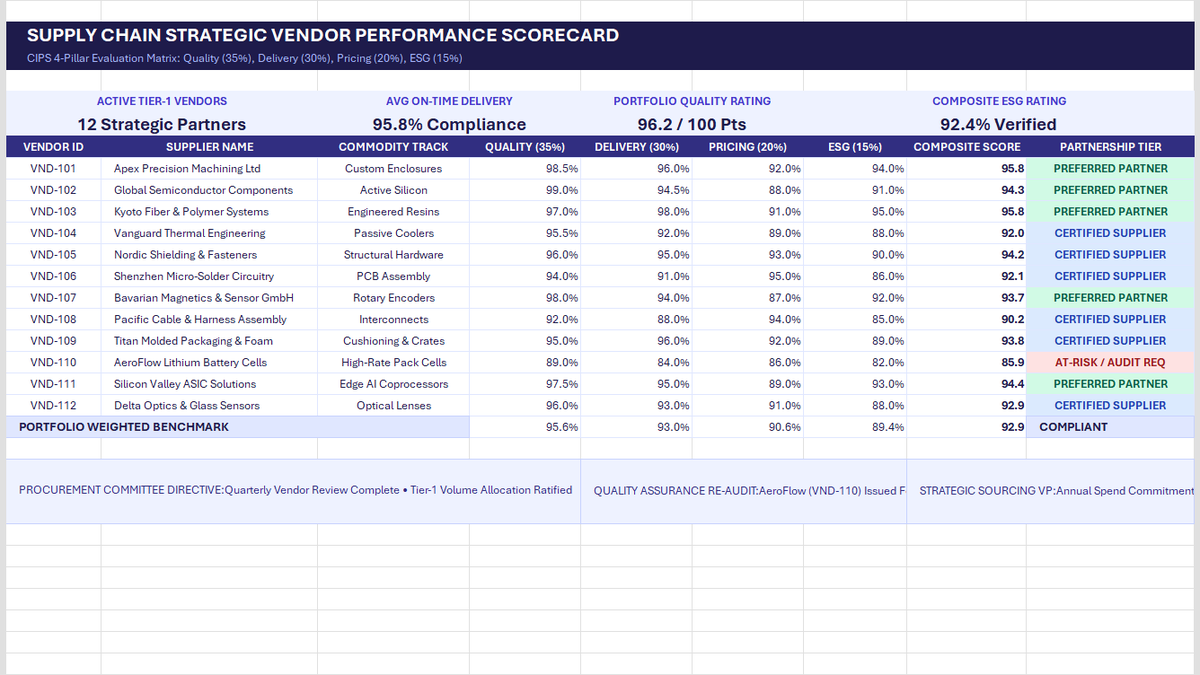
Vendor Performance Scorecard Excel Template
Learn strategic vendor evaluation in Microsoft Excel. Build a CIPS-compliant 4-pillar scorecard weighting Quality (35%), Delivery (30%), Pricing (20%), and ESG (15%). Automate weighted composite scores with SUMPRODUCT, calculate portfolio OTIF delivery, and establish tier-based purchase order allocations.
Discussion
Ask questions, share formula tips, or discuss alternative approaches with fellow spreadsheet builders.
Loading discussion...