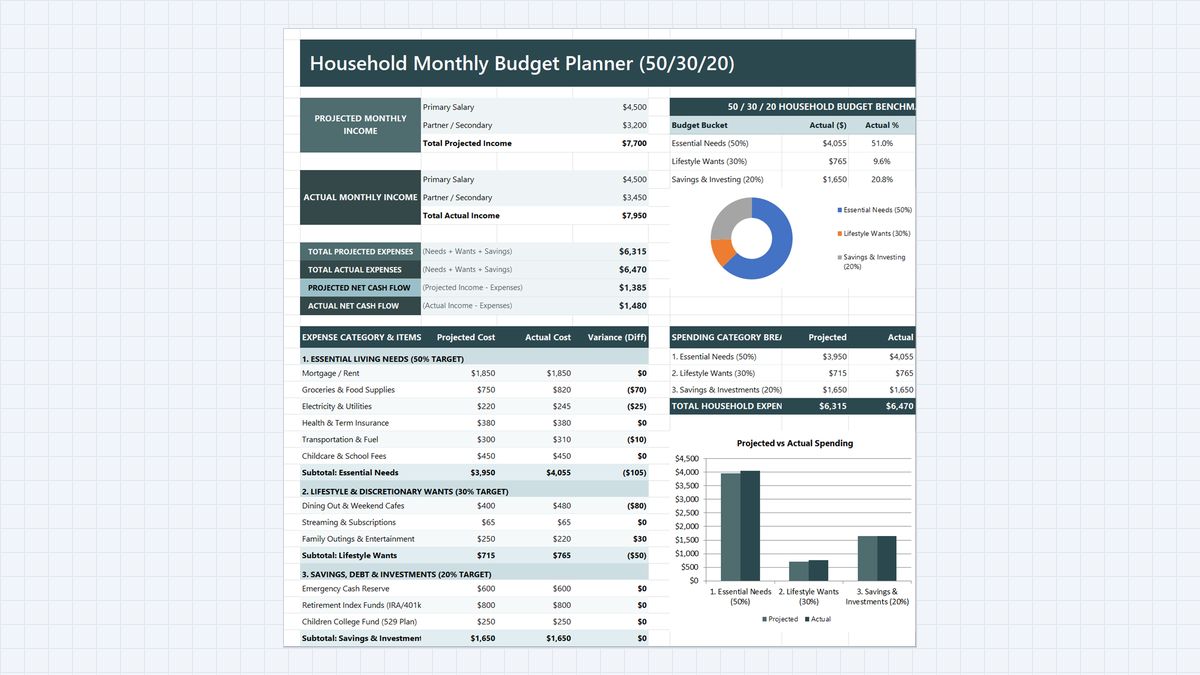
Two salaries land in the bank, the bills go out, and somehow the account is nearly empty by the 25th. If that sounds familiar, the problem is rarely one big purchase. It is usually many small ones that nobody tracked.
In this exercise you will build a Household Budget Planner in Microsoft Excel. It splits spending into Needs, Wants, and Savings, compares plan against reality, and warns you when a bucket runs over.
Where Does the Money Go Every Month?
What Your Budget Template Needs
- Income block: projected and actual pay for both earners, because the second salary rarely matches the plan.
- Three expense buckets: Needs, Wants, and Savings, each with its own subtotal.
- Projected vs Actual with variance: the gap per line, so you can see which item caused it.
- Net cash flow card: income minus expenses, showing surplus or deficit at a glance.
- Benchmark card: each bucket as a share of actual income, set against the 50/30/20 targets.
| Budget Bucket | Target Ratio | Actual ($) | Actual % of Income |
|---|---|---|---|
| ESSENTIAL NEEDS | 50% | $4,055 | 51.0% |
| LIFESTYLE WANTS | 30% | $765 | 9.6% |
| SAVINGS & INVESTING | 20% | $1,650 | 20.8% |
Build the Planner in 5 Steps
Household Budget. Income and totals sit on the left, benchmarks and alerts on the right. Work through the steps in order, because each one feeds the next.1Step 1: Set Up Both Income Streams
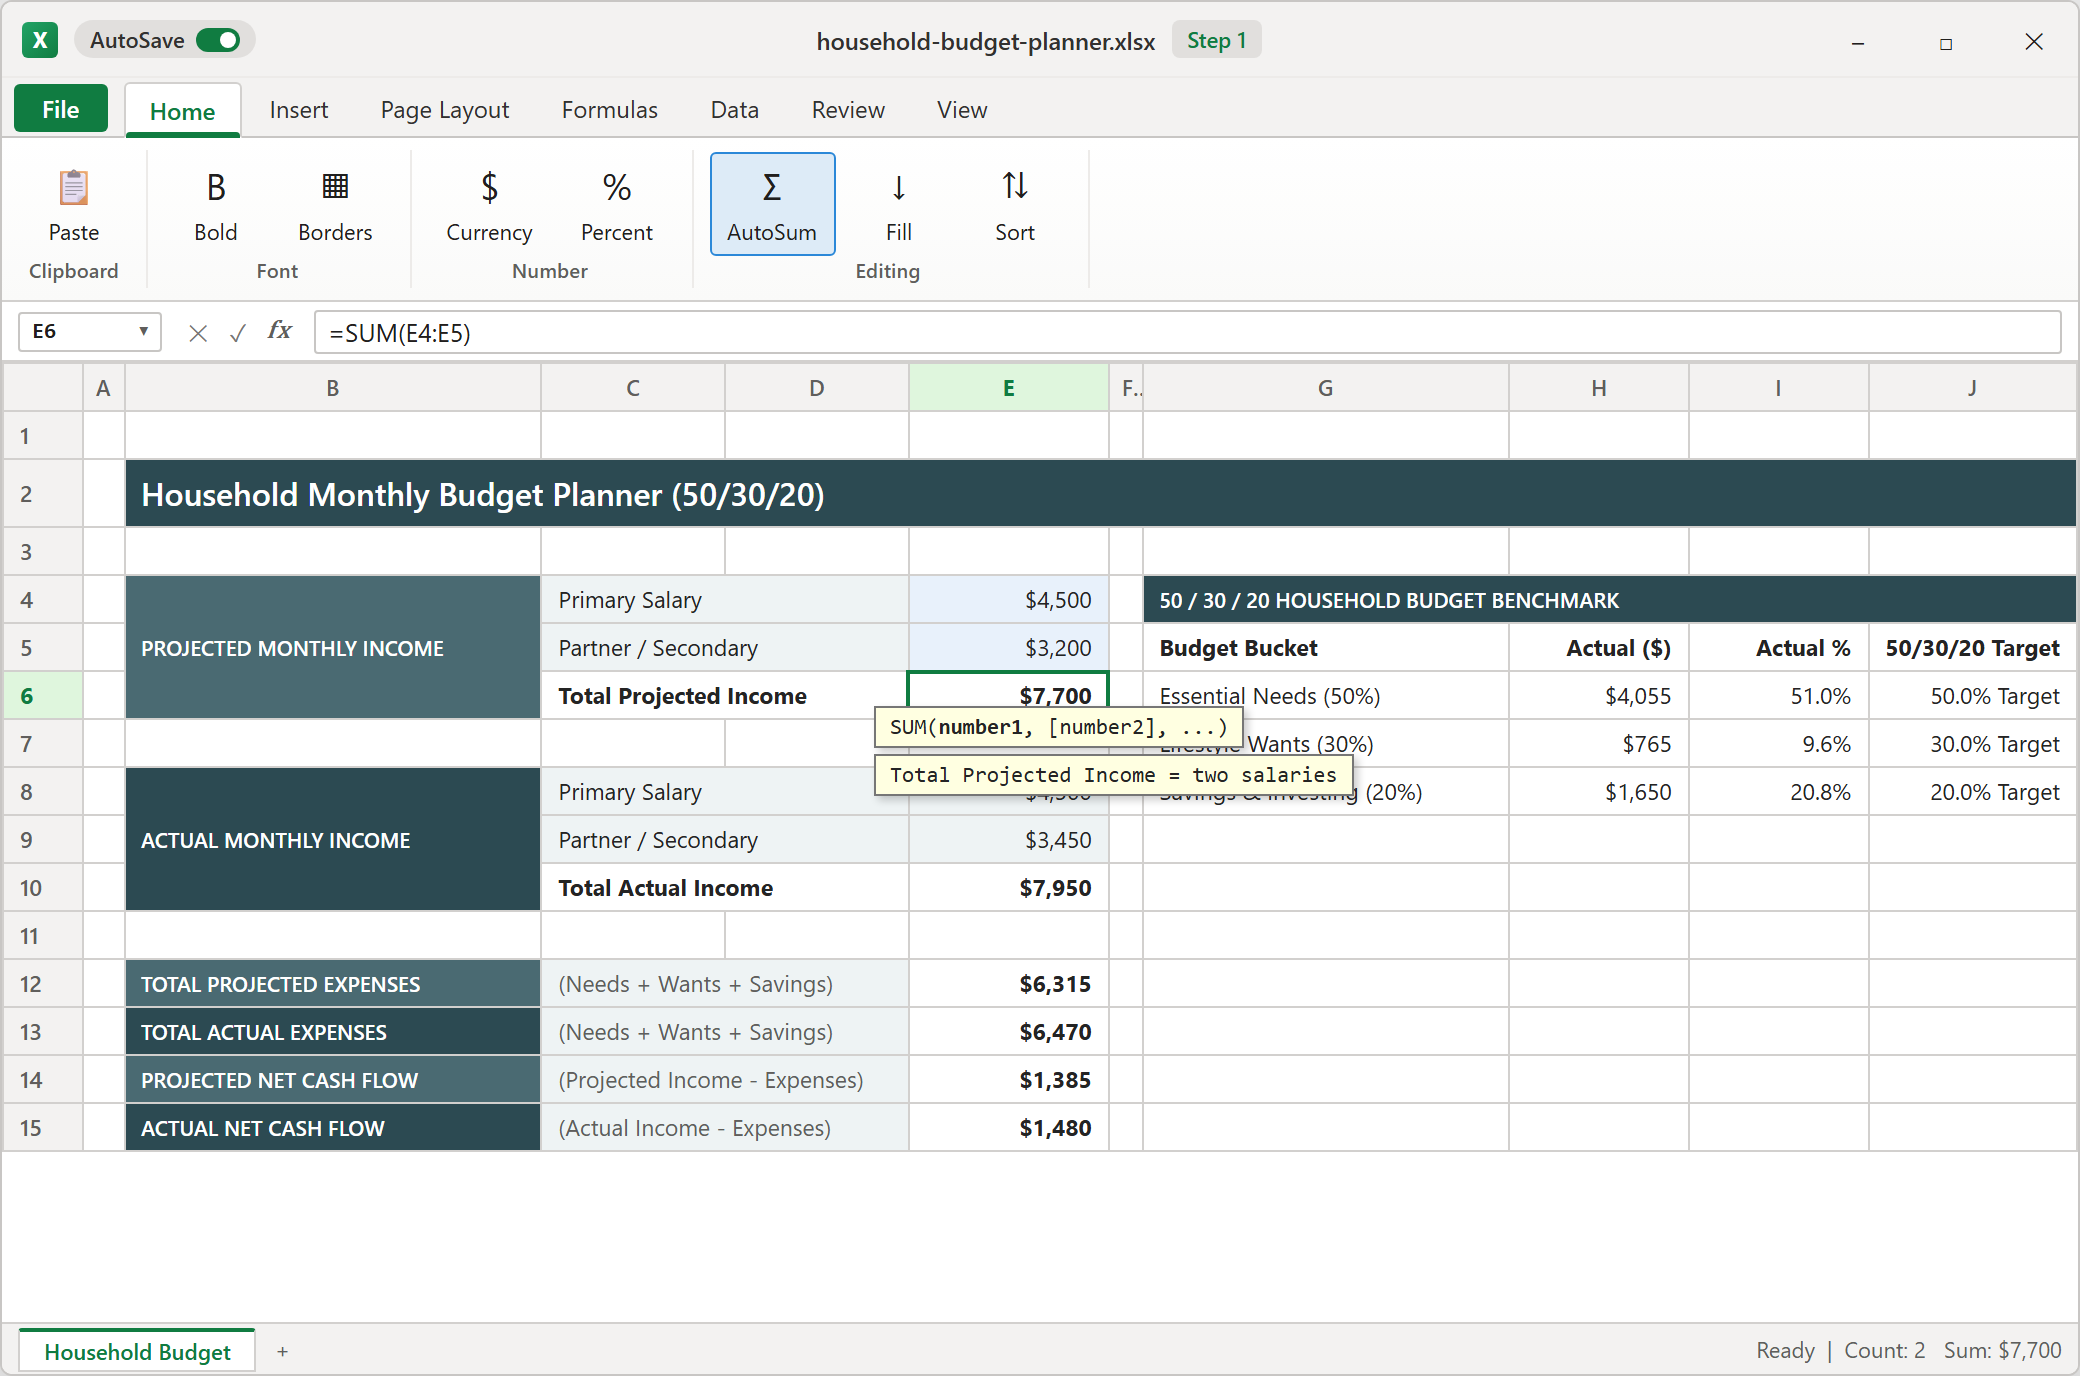
Create two small tables, one for projected income and one for actual income. Each holds the primary salary and the partner's pay. Keep them separate, since plan and reality will drift apart.
Select the cell under each pair of salaries and use AutoSum on the Home tab. Excel guesses the range above, so check that the dashed outline covers exactly the two salary cells before you press Enter. Projected income here is $7,700 and actual income is $7,950.
2Step 2: Group Expenses into 50/30/20 Buckets
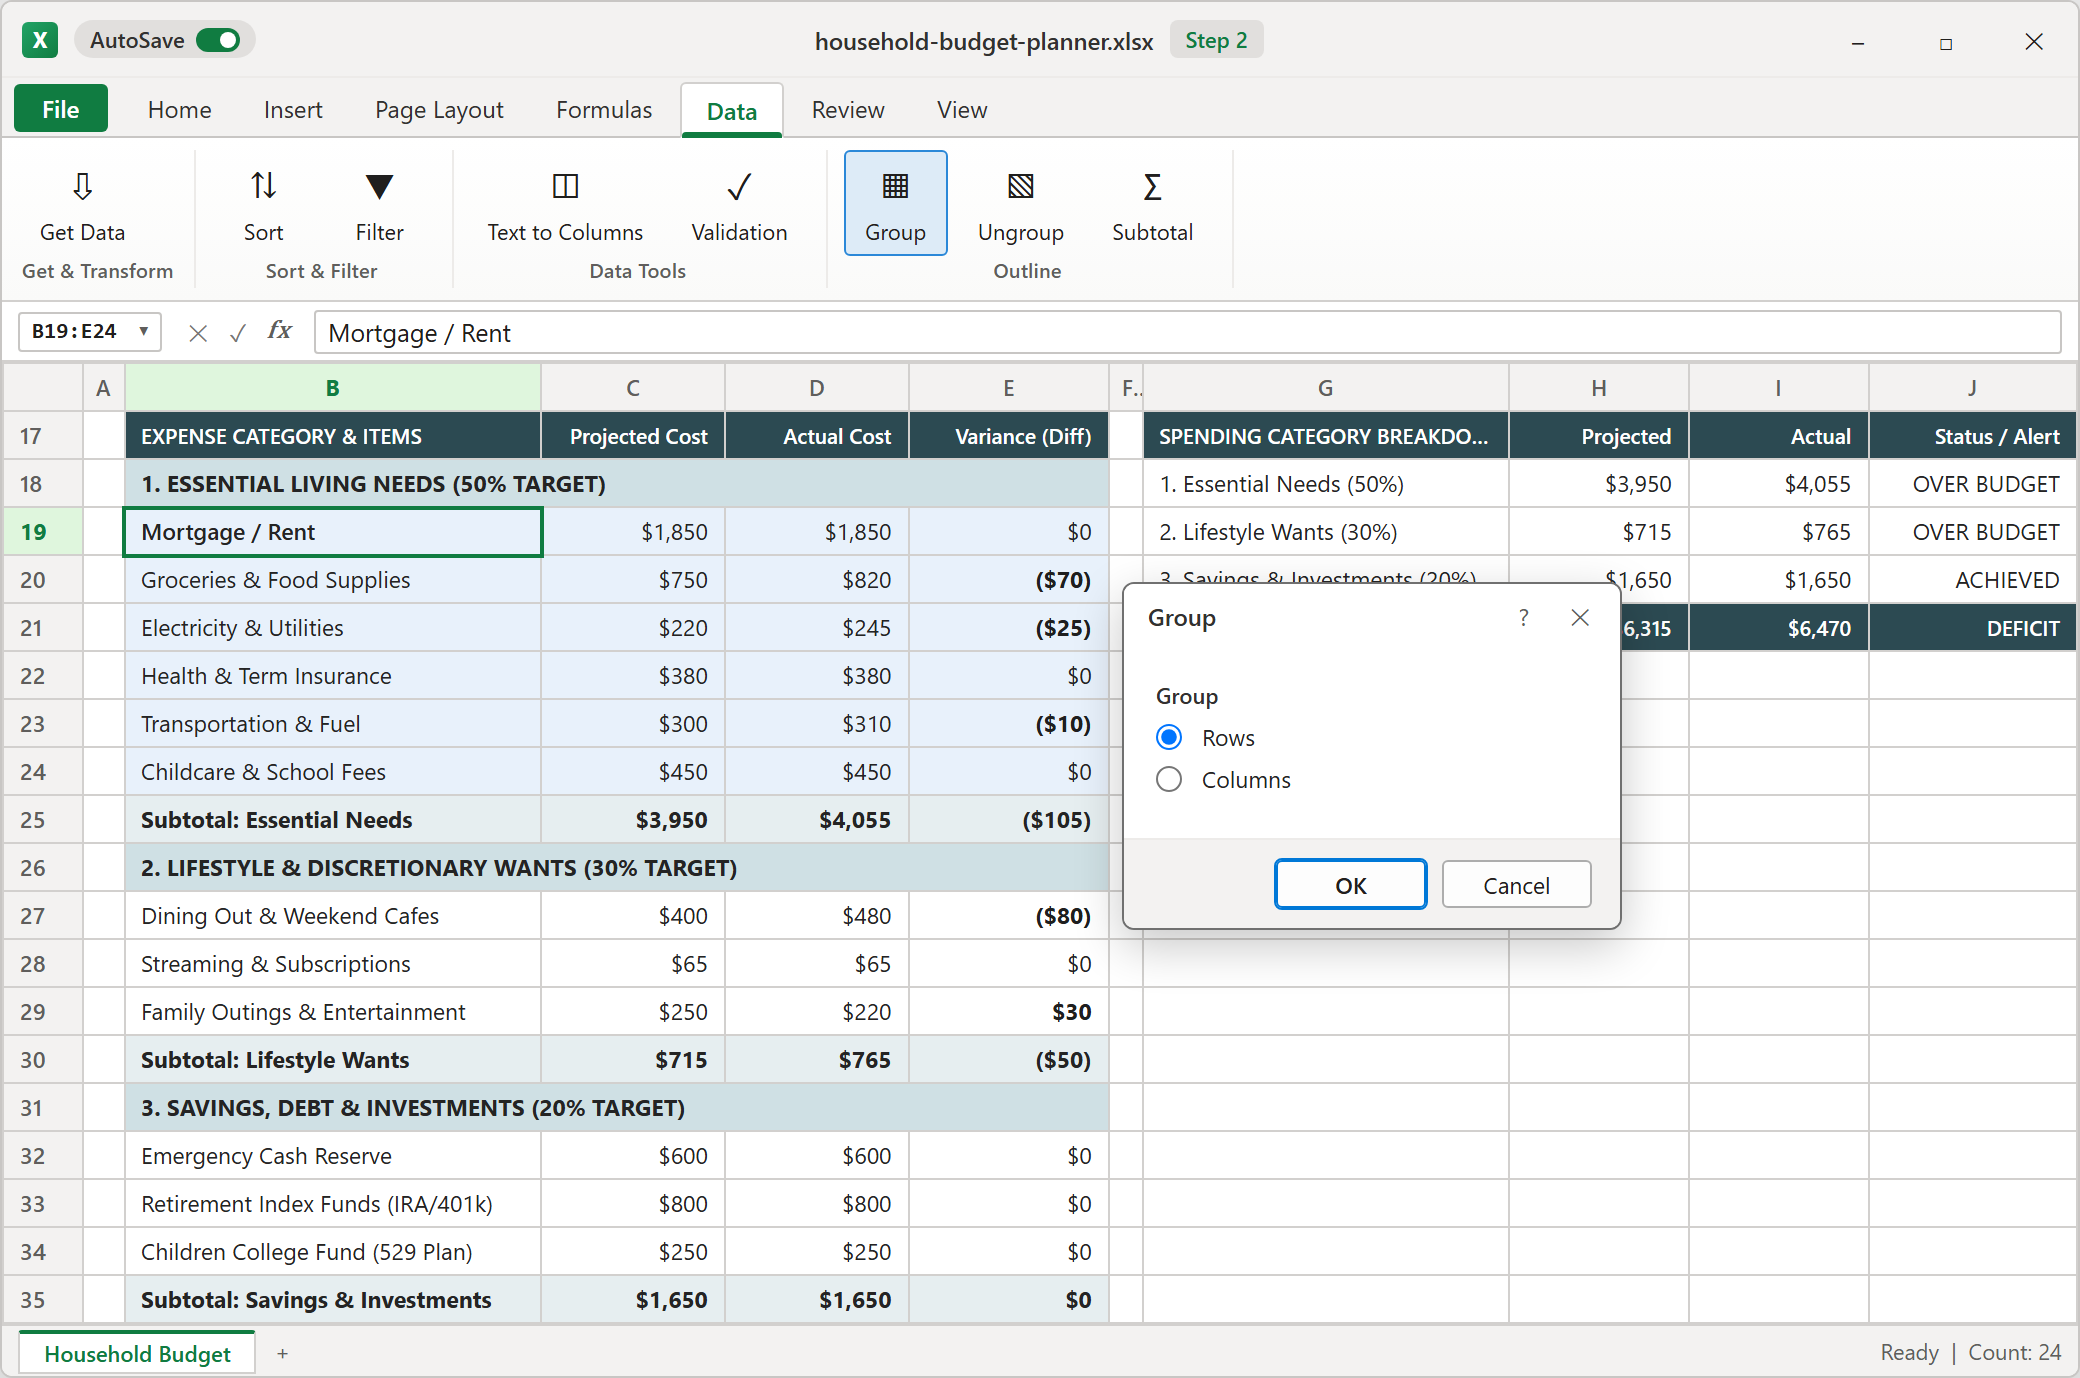
List every expense under one of three headings: Essential Living Needs, Lifestyle Wants, or Savings, Debt and Investments. Each heading gets its own subtotal row for projected and actual cost.
Select the item rows of one bucket and go to Data > Group. Choose Rows. Now you can collapse a bucket down to its subtotal, which makes a long sheet easy to scan. Finish each bucket with a closing border above the subtotal so your eye finds the total fast.
3Step 3: Calculate Variance and Net Cash Flow
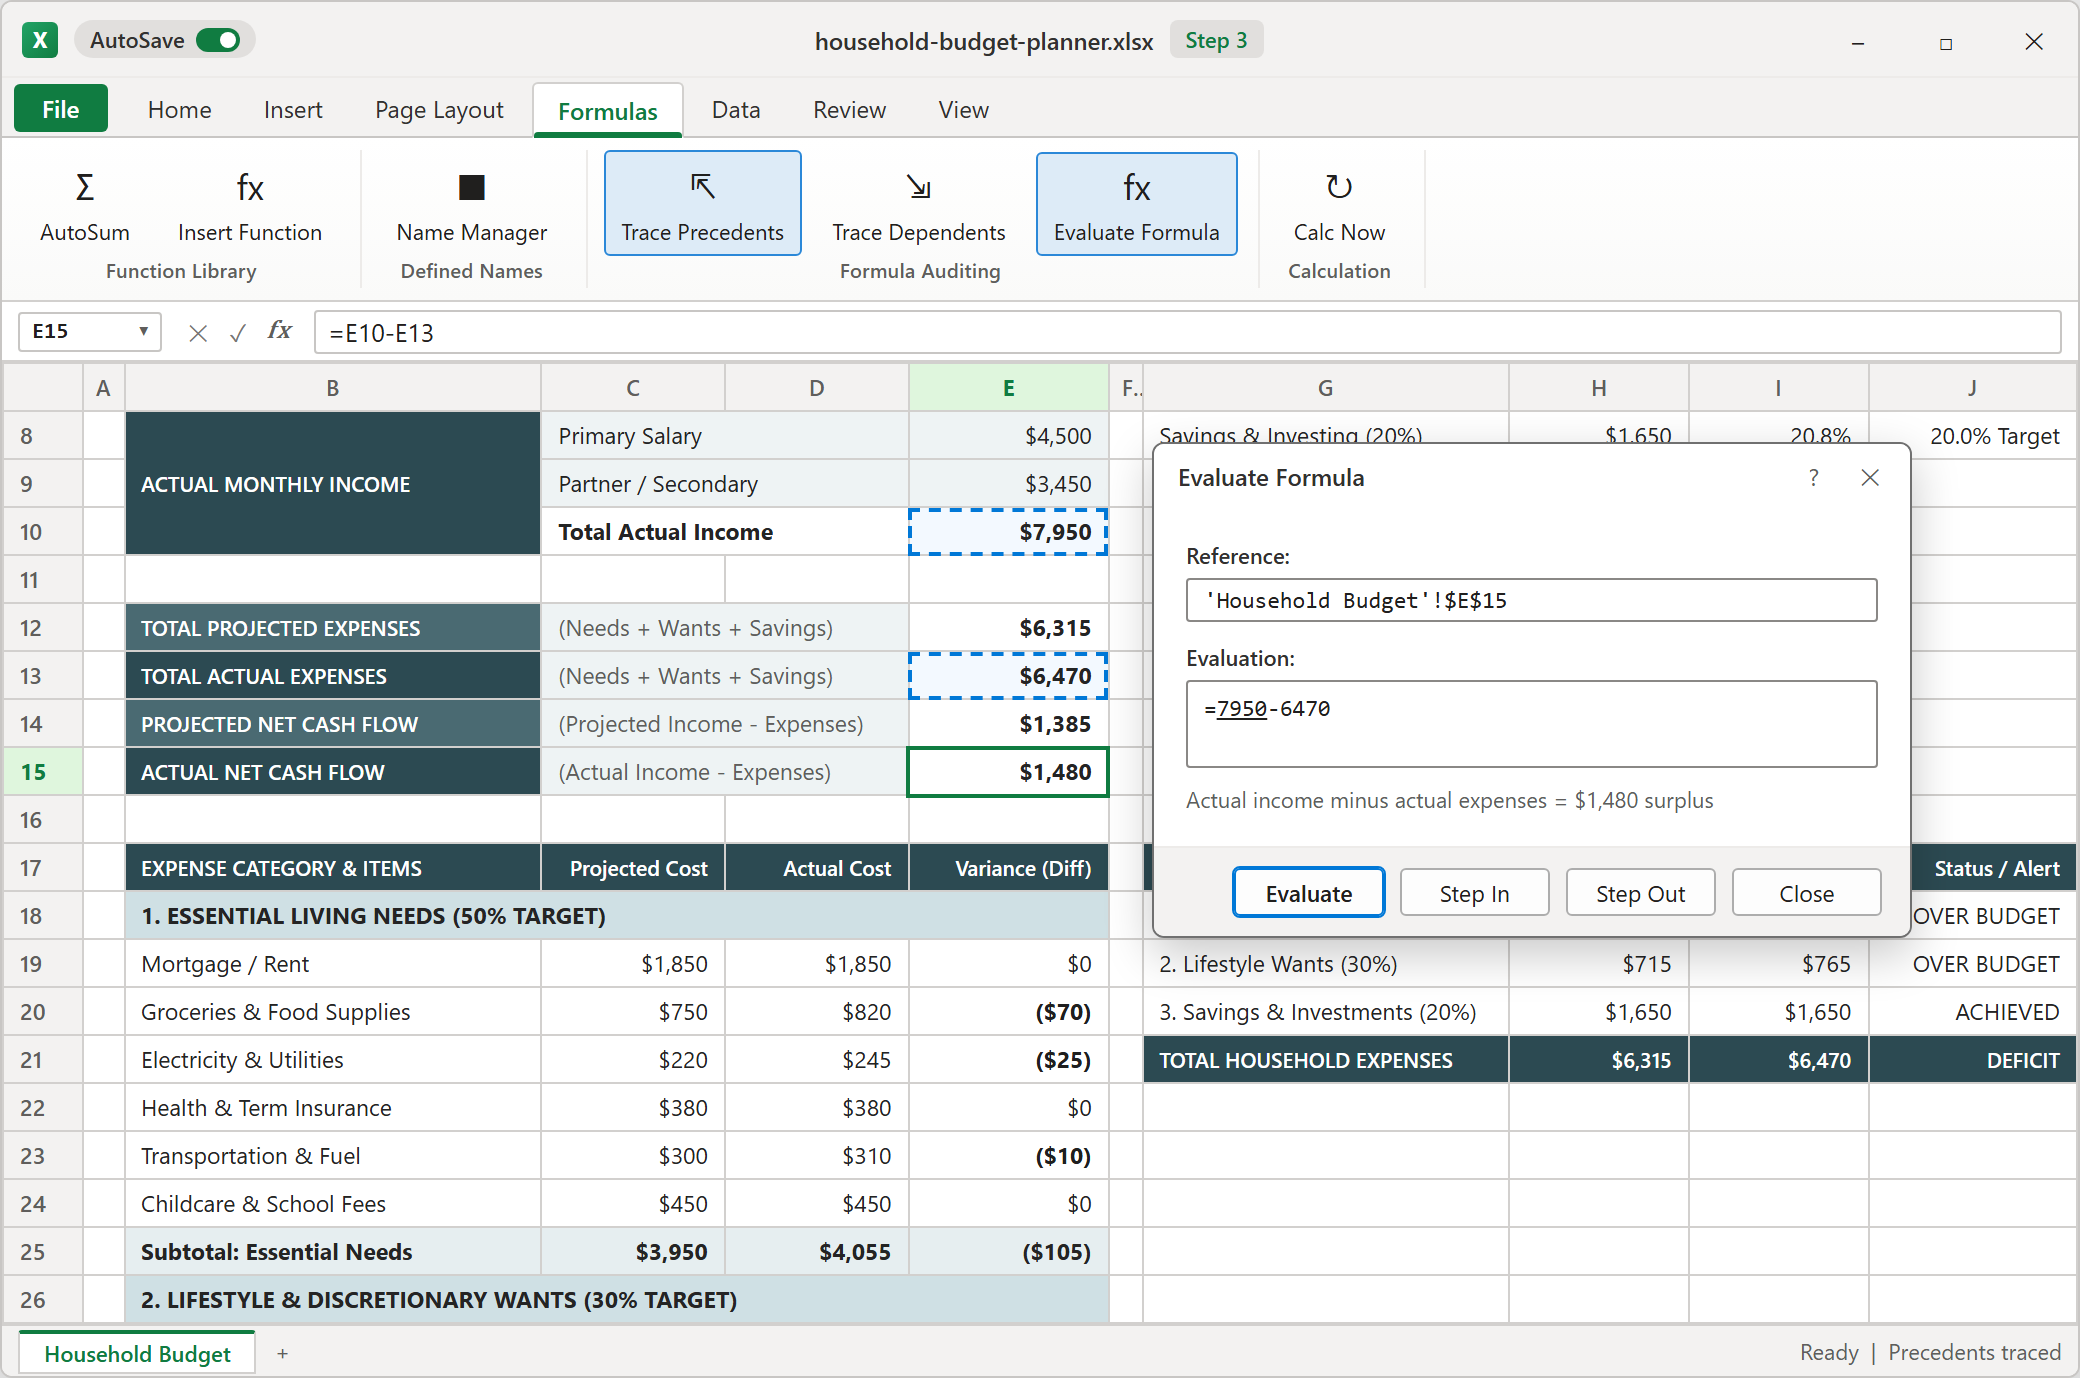
Variance tells you how far reality moved from the plan. Subtract actual from projected on each line, so an overspend shows as a negative number. Groceries, for example, come out at minus $70.
For net cash flow, subtract total actual expenses from total actual income. A positive result is a surplus and a negative one is a deficit. Use Formulas > Evaluate Formula or Trace Precedents to confirm the cell really points at the two totals you meant.
4Step 4: Benchmark Each Bucket as a Percentage
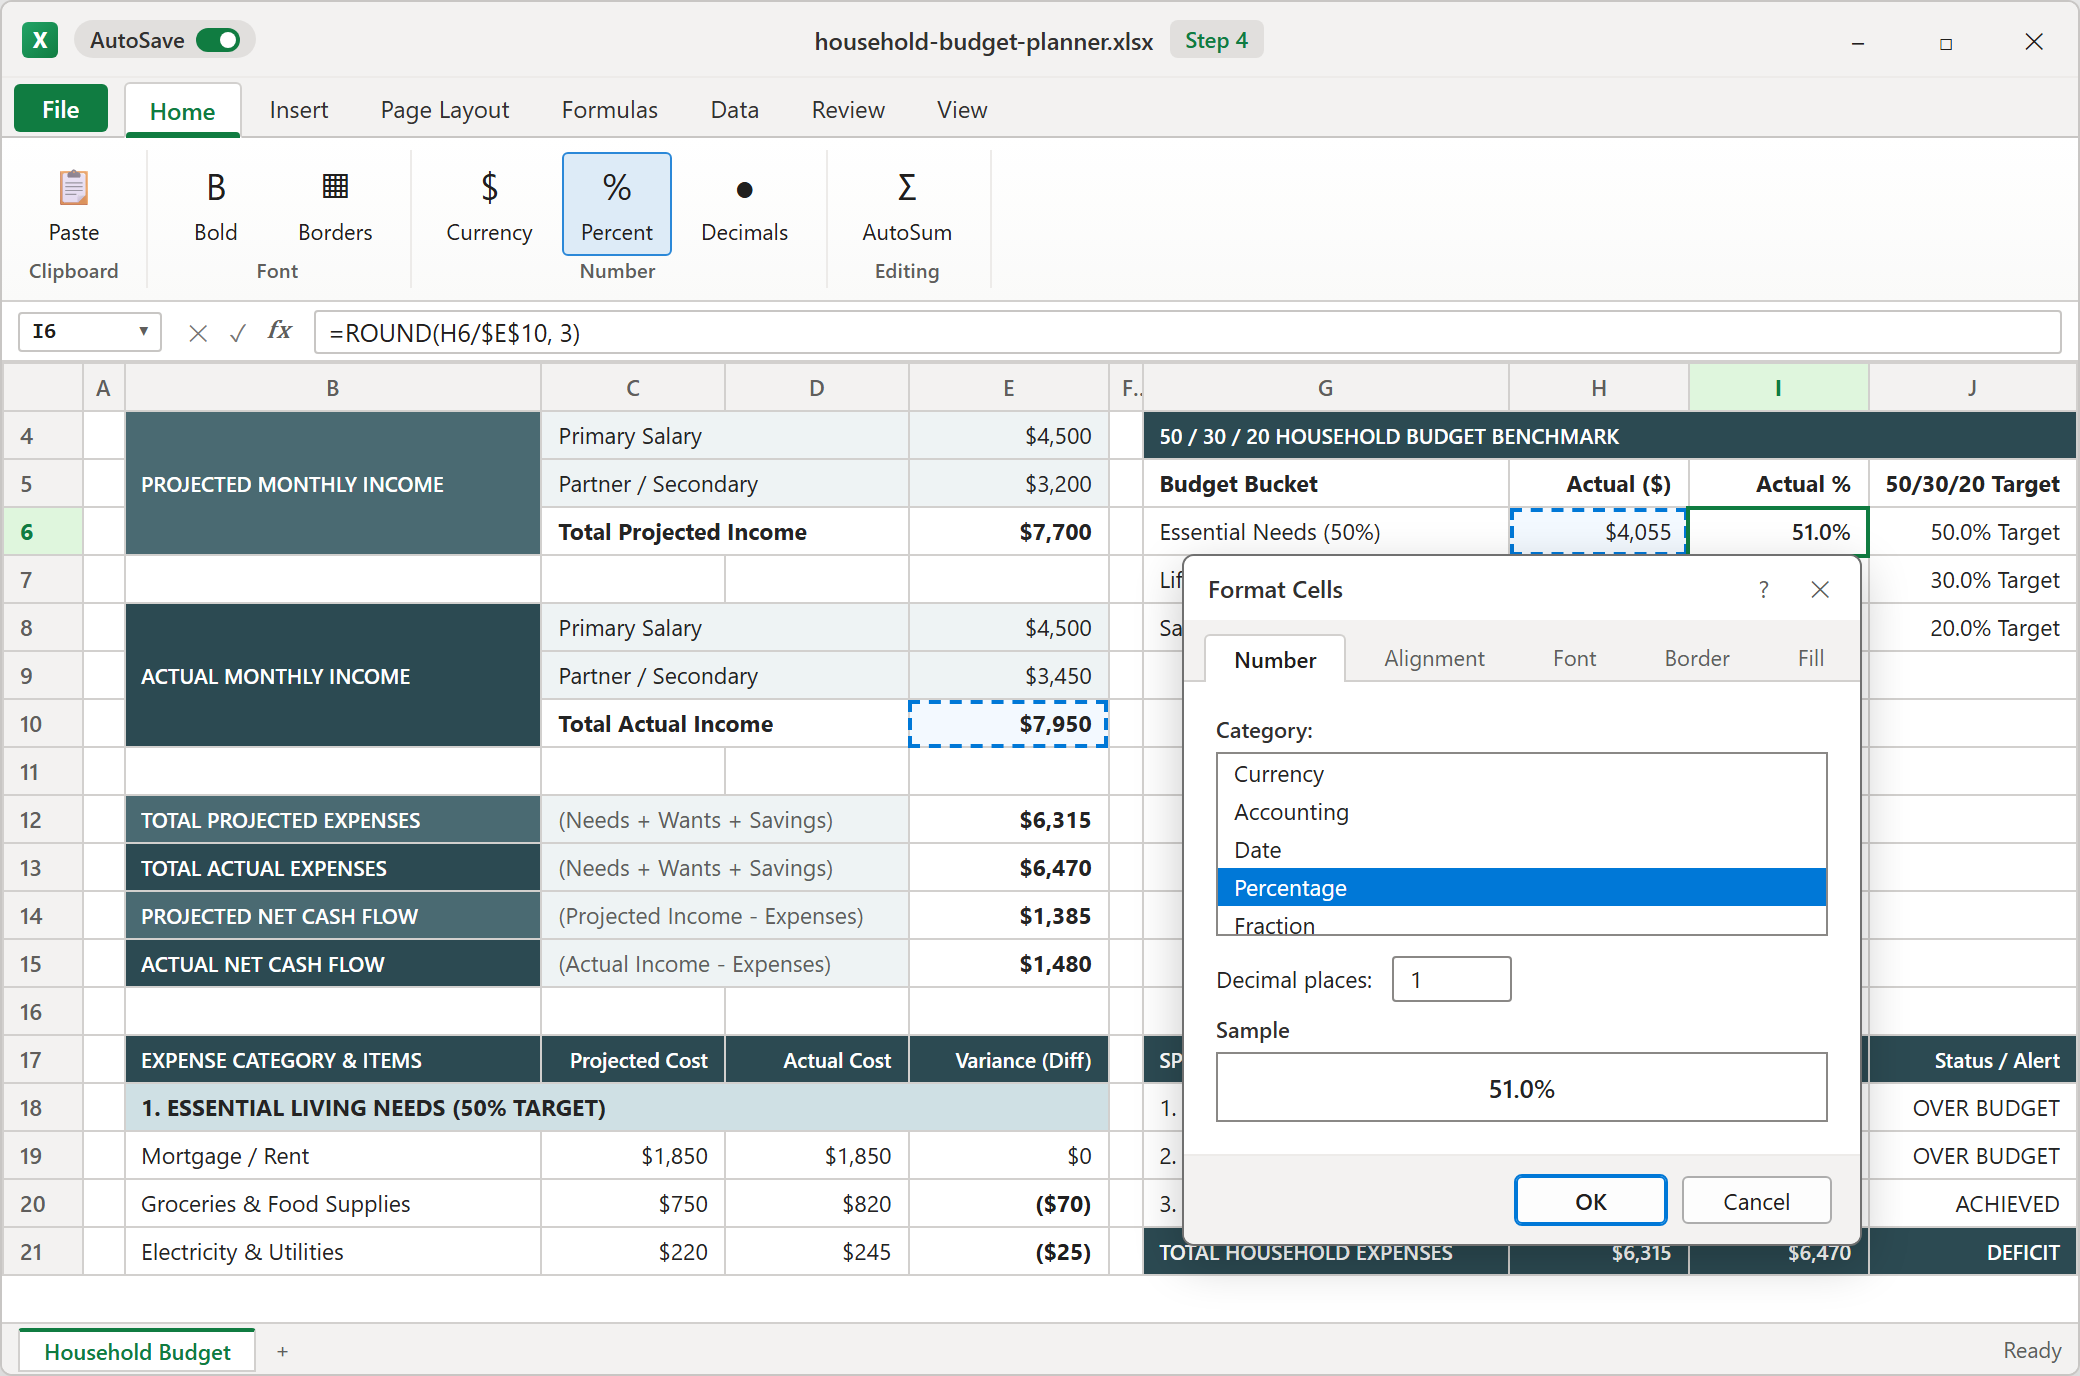
Divide each bucket's actual spending by total actual income, then round to three decimals. The key detail is the income cell: lock it with absolute references, so it stays fixed when you copy the formula down to the other two buckets.
Next, open Format Cells, choose Percentage, and set one decimal place. A raw 0.51 becomes 51.0%, which you can compare with the 50% target straight away.
5Step 5: Flag Over-Budget Items Automatically
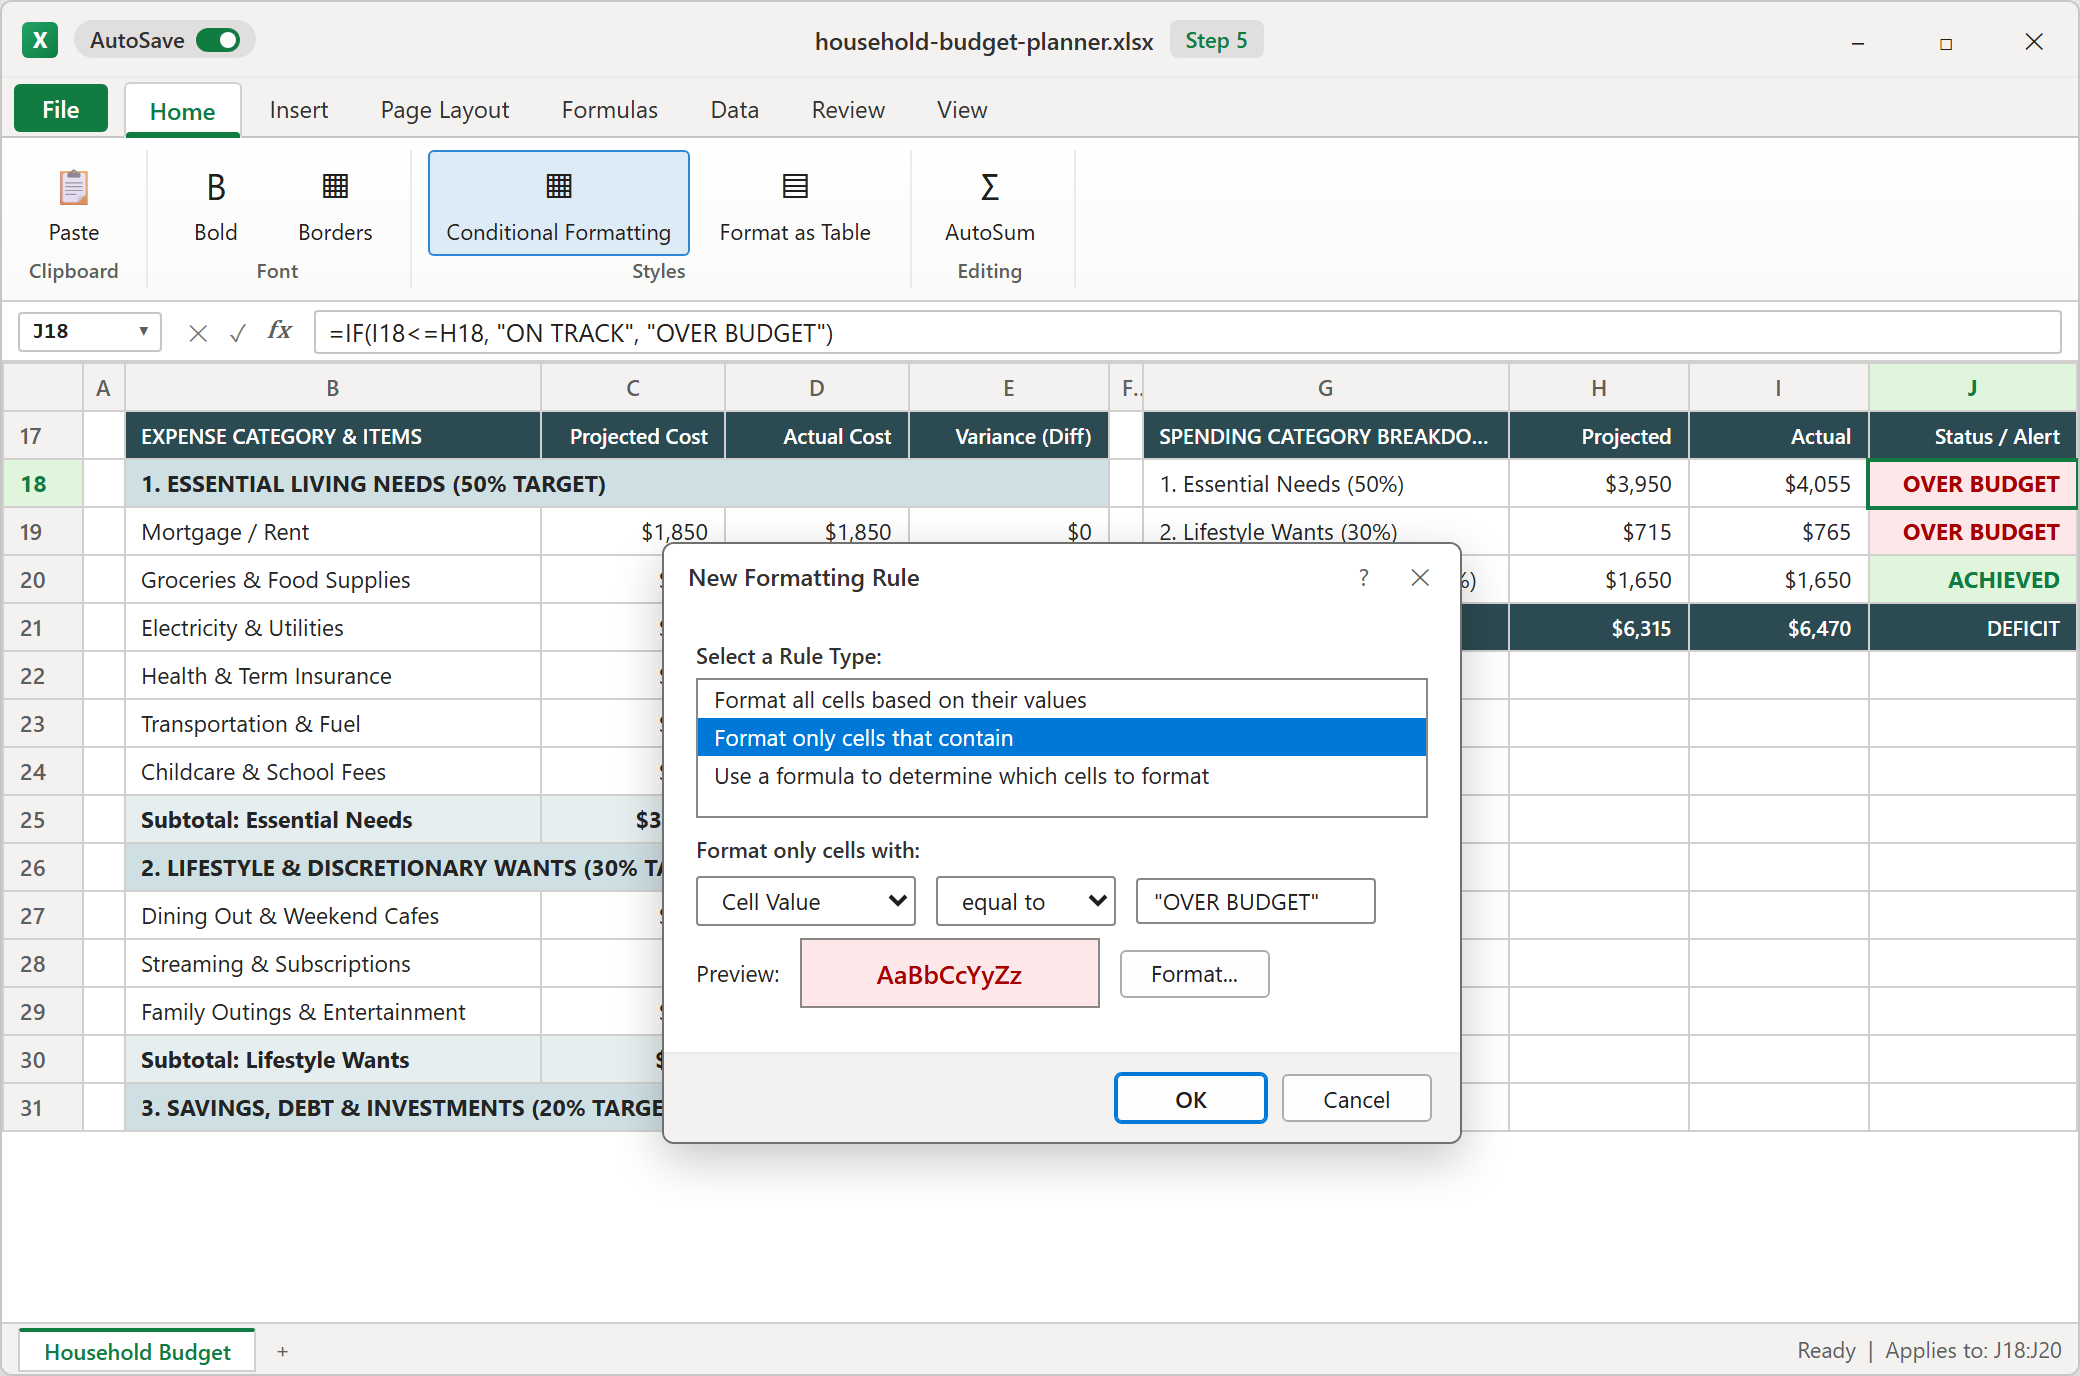
Build a status column with an IF test. For Needs and Wants, the test asks whether actual spending stayed at or below the projected amount. For Savings, the logic flips, because spending more than planned there is good news.
Then select the status cells and add a rule under Conditional Formatting that fills "OVER BUDGET" with a soft pink. Add a green rule for "ACHIEVED". Now a quick glance at the sheet is enough to see where the month went wrong.
Adapting the 50/30/20 Rule for High-Cost Cities: How to Adjust Your Buckets When Rent Takes 40% of Income
- Protect savings first. Keep at least 15% for the emergency fund and retirement, even if it hurts.
- Squeeze Wants second. Moving from 30% to 20% is often easier than cutting rent.
- Let Needs flex. A 60/20/20 split is a fair target when housing is costly.
- Edit the labels. Change the target text in the benchmark card so the sheet reflects your real plan.
Download the Template

Spreadsheet educator and web developer passionate about hands-on interactive spreadsheet practice.
Related Practical Exercises
Explore more hands-on spreadsheet models with downloadable practice workbooks.
 Project Management
Project Timeline Tracker Excel Template
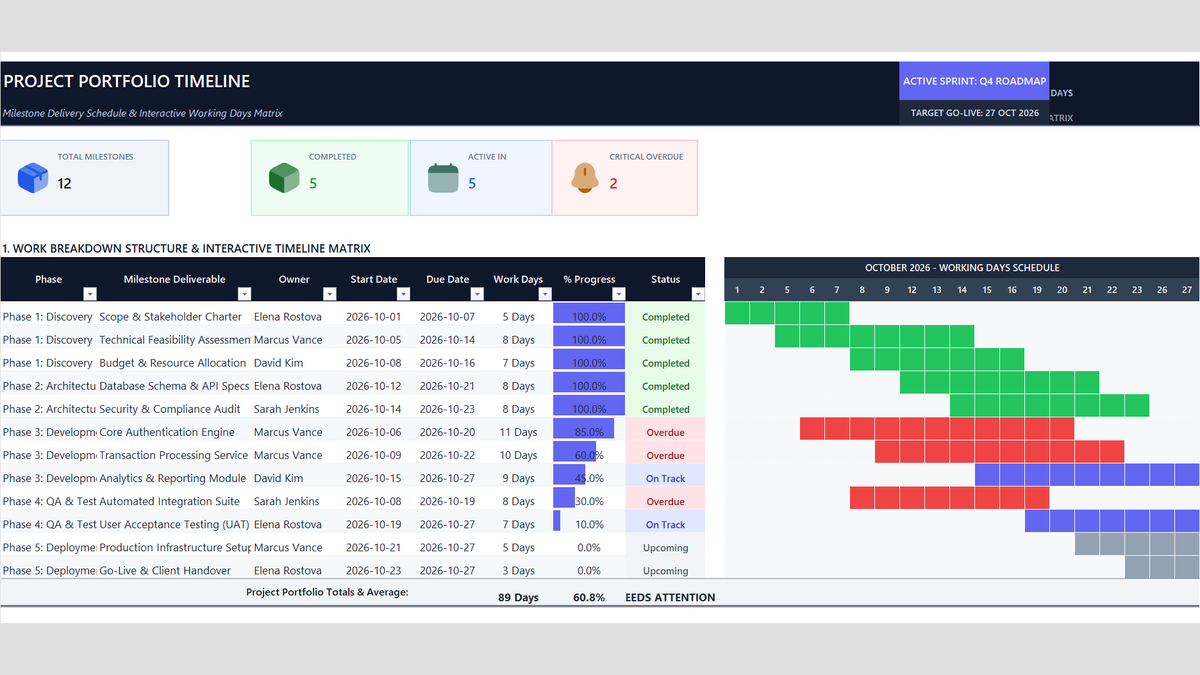
Keep sprint deadlines and client milestones on track without messy calendar math. Build a Project Timeline Tracker Excel Template with automatic working days using NETWORKDAYS, single-owner dropdowns, progress bars, and portfolio health alerts.
 Finance
Loan Payoff Calculator Excel Template
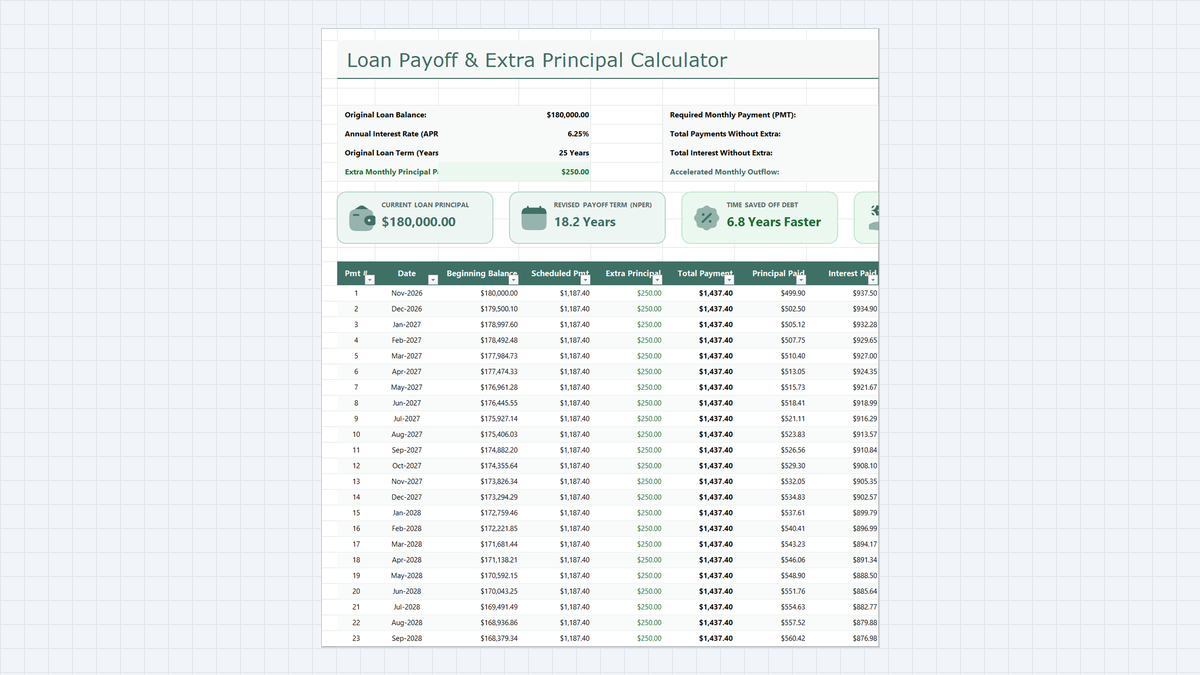
See how extra principal payments shorten a loan. Build a loan payoff calculator in Microsoft Excel with a PMT-based payment, a monthly amortization schedule, and the interest-versus-principal split behind every payment.
 Finance
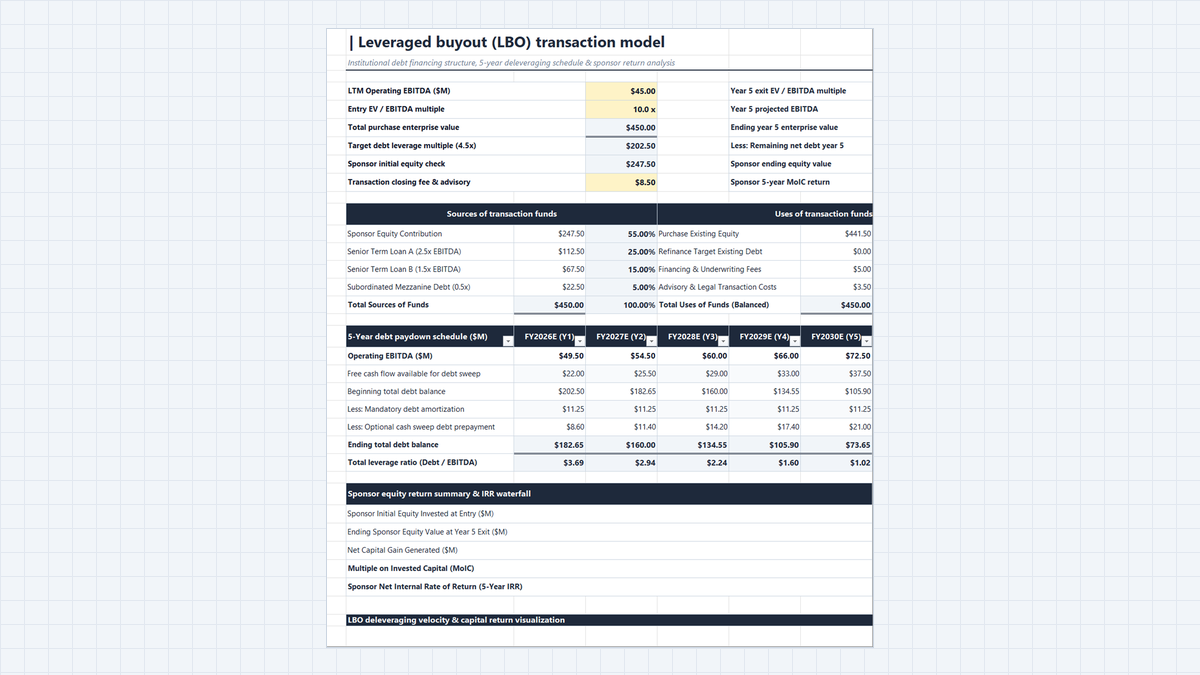
Leveraged Buyout (LBO) Model Excel Template
Build a 5-year leveraged buyout (LBO) model in Microsoft Excel. Set entry valuation, balance a sources and uses table, run a debt paydown schedule with an 80% cash sweep, and calculate sponsor MoIC and IRR.
 Sales
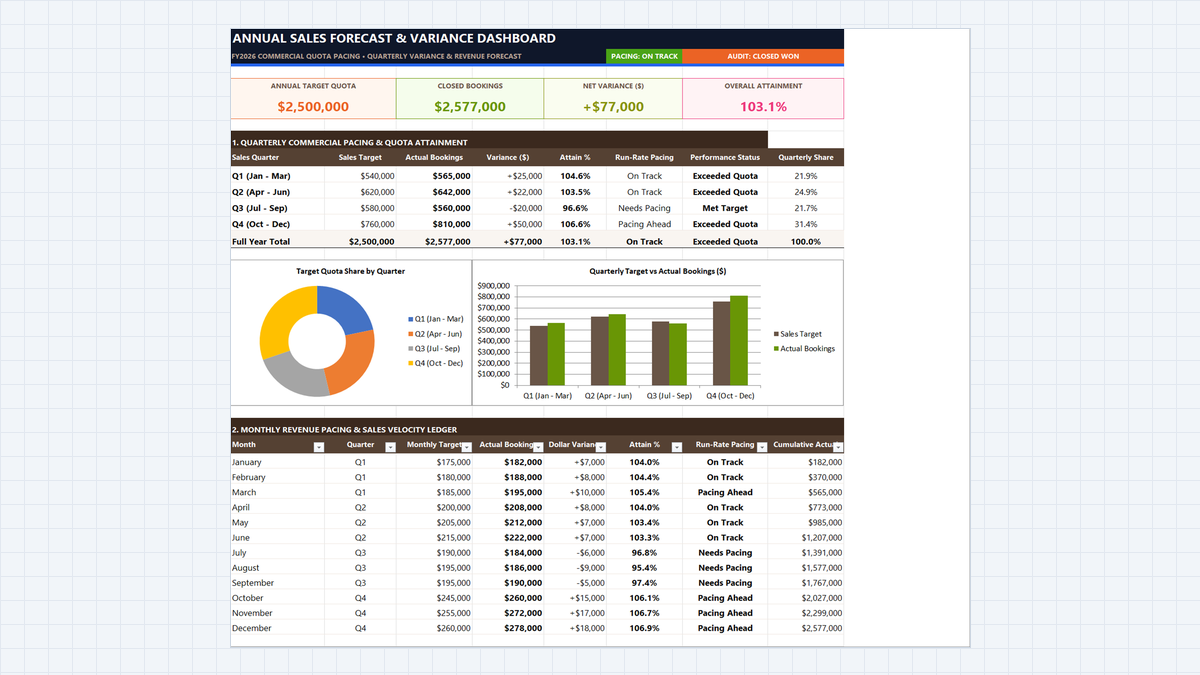
Sales Forecast Template Excel (Annual Model)
Learn commercial revenue forecasting in Microsoft Excel. Build an annual sales forecasting dashboard featuring quarterly variance calculations, dynamic quota attainment metrics, clustered column comparison charts, and executive pacing scorecards.
 Finance
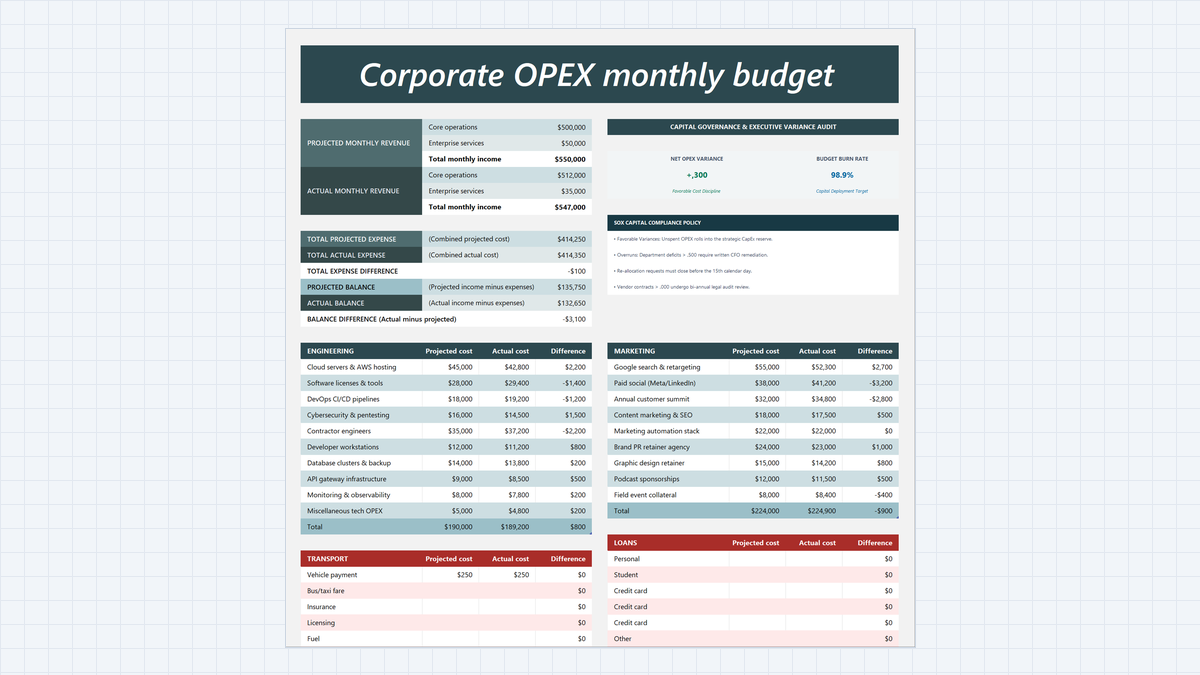
Budget vs Actual Variance Analysis Excel Template
Build a Budget vs Actual Variance Analysis Excel Template with Engineering and Marketing cost centers, structured variance formulas, filter-proof SUBTOTAL totals, overrun highlights, and an executive SOX compliance card.
Discussion
Ask questions, share formula tips, or discuss alternative approaches with fellow spreadsheet builders.
Loading discussion...