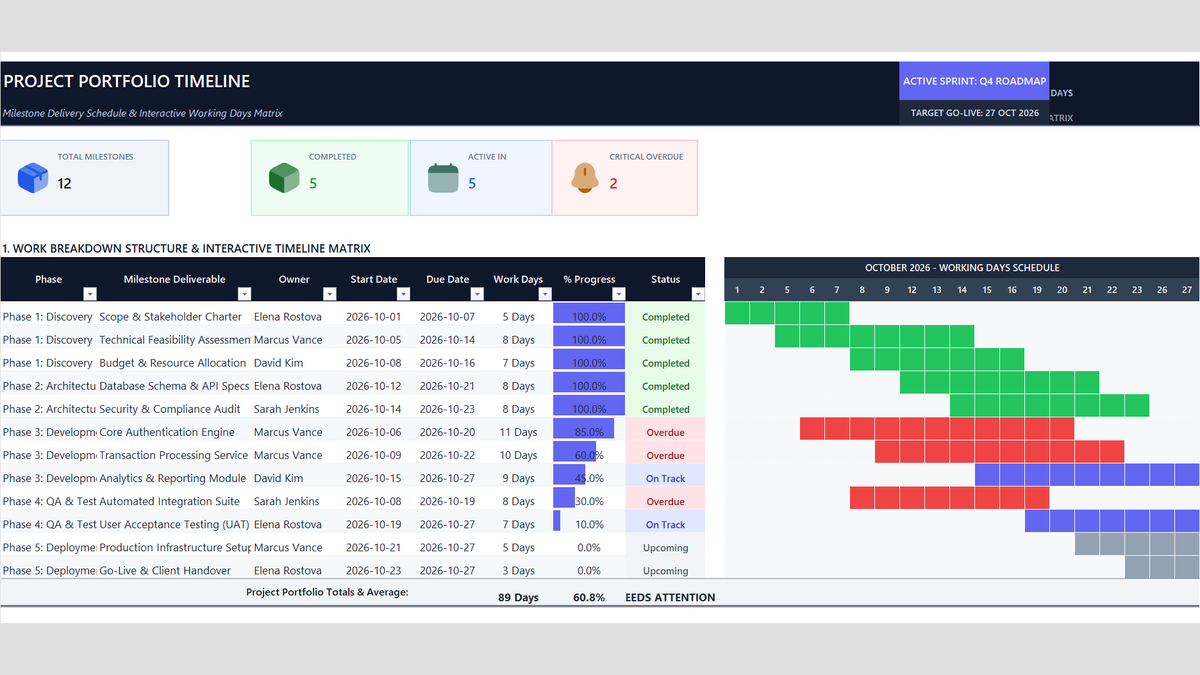
A new project sprint starts with plenty of energy, yet delivery dates often slip away quietly two weeks later. The delay rarely comes from slow work. It happens because someone counted calendar days instead of actual working days.
This Project Timeline Tracker Excel Template replaces guesswork with reliable business day calculations. Every milestone has a single owner, task durations skip weekends automatically, and a portfolio health badge warns you the moment a deliverable falls behind.
Why Schedules Slip: Calendar Math That Forgets the Weekend
What a Project Timeline Tracker Excel Template Must Contain
Project Timeline. It uses five core building blocks to keep everyone aligned:- Work Breakdown Structure (WBS): 12 deliverables grouped into 5 clear project phases.
- Owner dropdown: a single accountable person per task to prevent finger-pointing.
- Working days engine: real working day calculations with
NETWORKDAYSthat ignore Saturdays and Sundays. - In-cell progress bars: visual completion bars from 0% to 100% that render directly inside cells.
- Portfolio health alert: an executive rollup that flags overall schedule risk if even one task turns overdue.
| Part | Worksheet Location | What It Does |
|---|---|---|
| Phase & Deliverable | Columns B & C, rows 11:22 | Organizes the 12 tasks into Discovery, Architecture, Development, QA, and Deployment |
| Task Owner | Column D, rows 11:22 | Assigns one person from an approved list of 4 team members |
| Start & Due Dates | Columns E & F, rows 11:22 | Records the planned window for each milestone in October 2026 |
| Work Days | Column G, rows 11:22 | Calculates exact business days using NETWORKDAYS (5 to 11 days per task) |
| Progress % | Column H, rows 11:22 | Shows completion percentage paired with green in-cell data bars |
| Milestone Status | Column I, rows 11:22 | Labels each task Completed, Overdue, On Track, or Upcoming |
| Portfolio Summary | Row 23 | Rolls up 89 total work days, 60.8% average progress, and the NEEDS ATTENTION alert |
Build the Timeline Tracker in 5 Steps
Project Timeline sheet. Follow these five steps to set up the grid, plug in the formulas, and style the summary row.1Step 1: Set Up the Work Breakdown Structure and Owner Dropdown
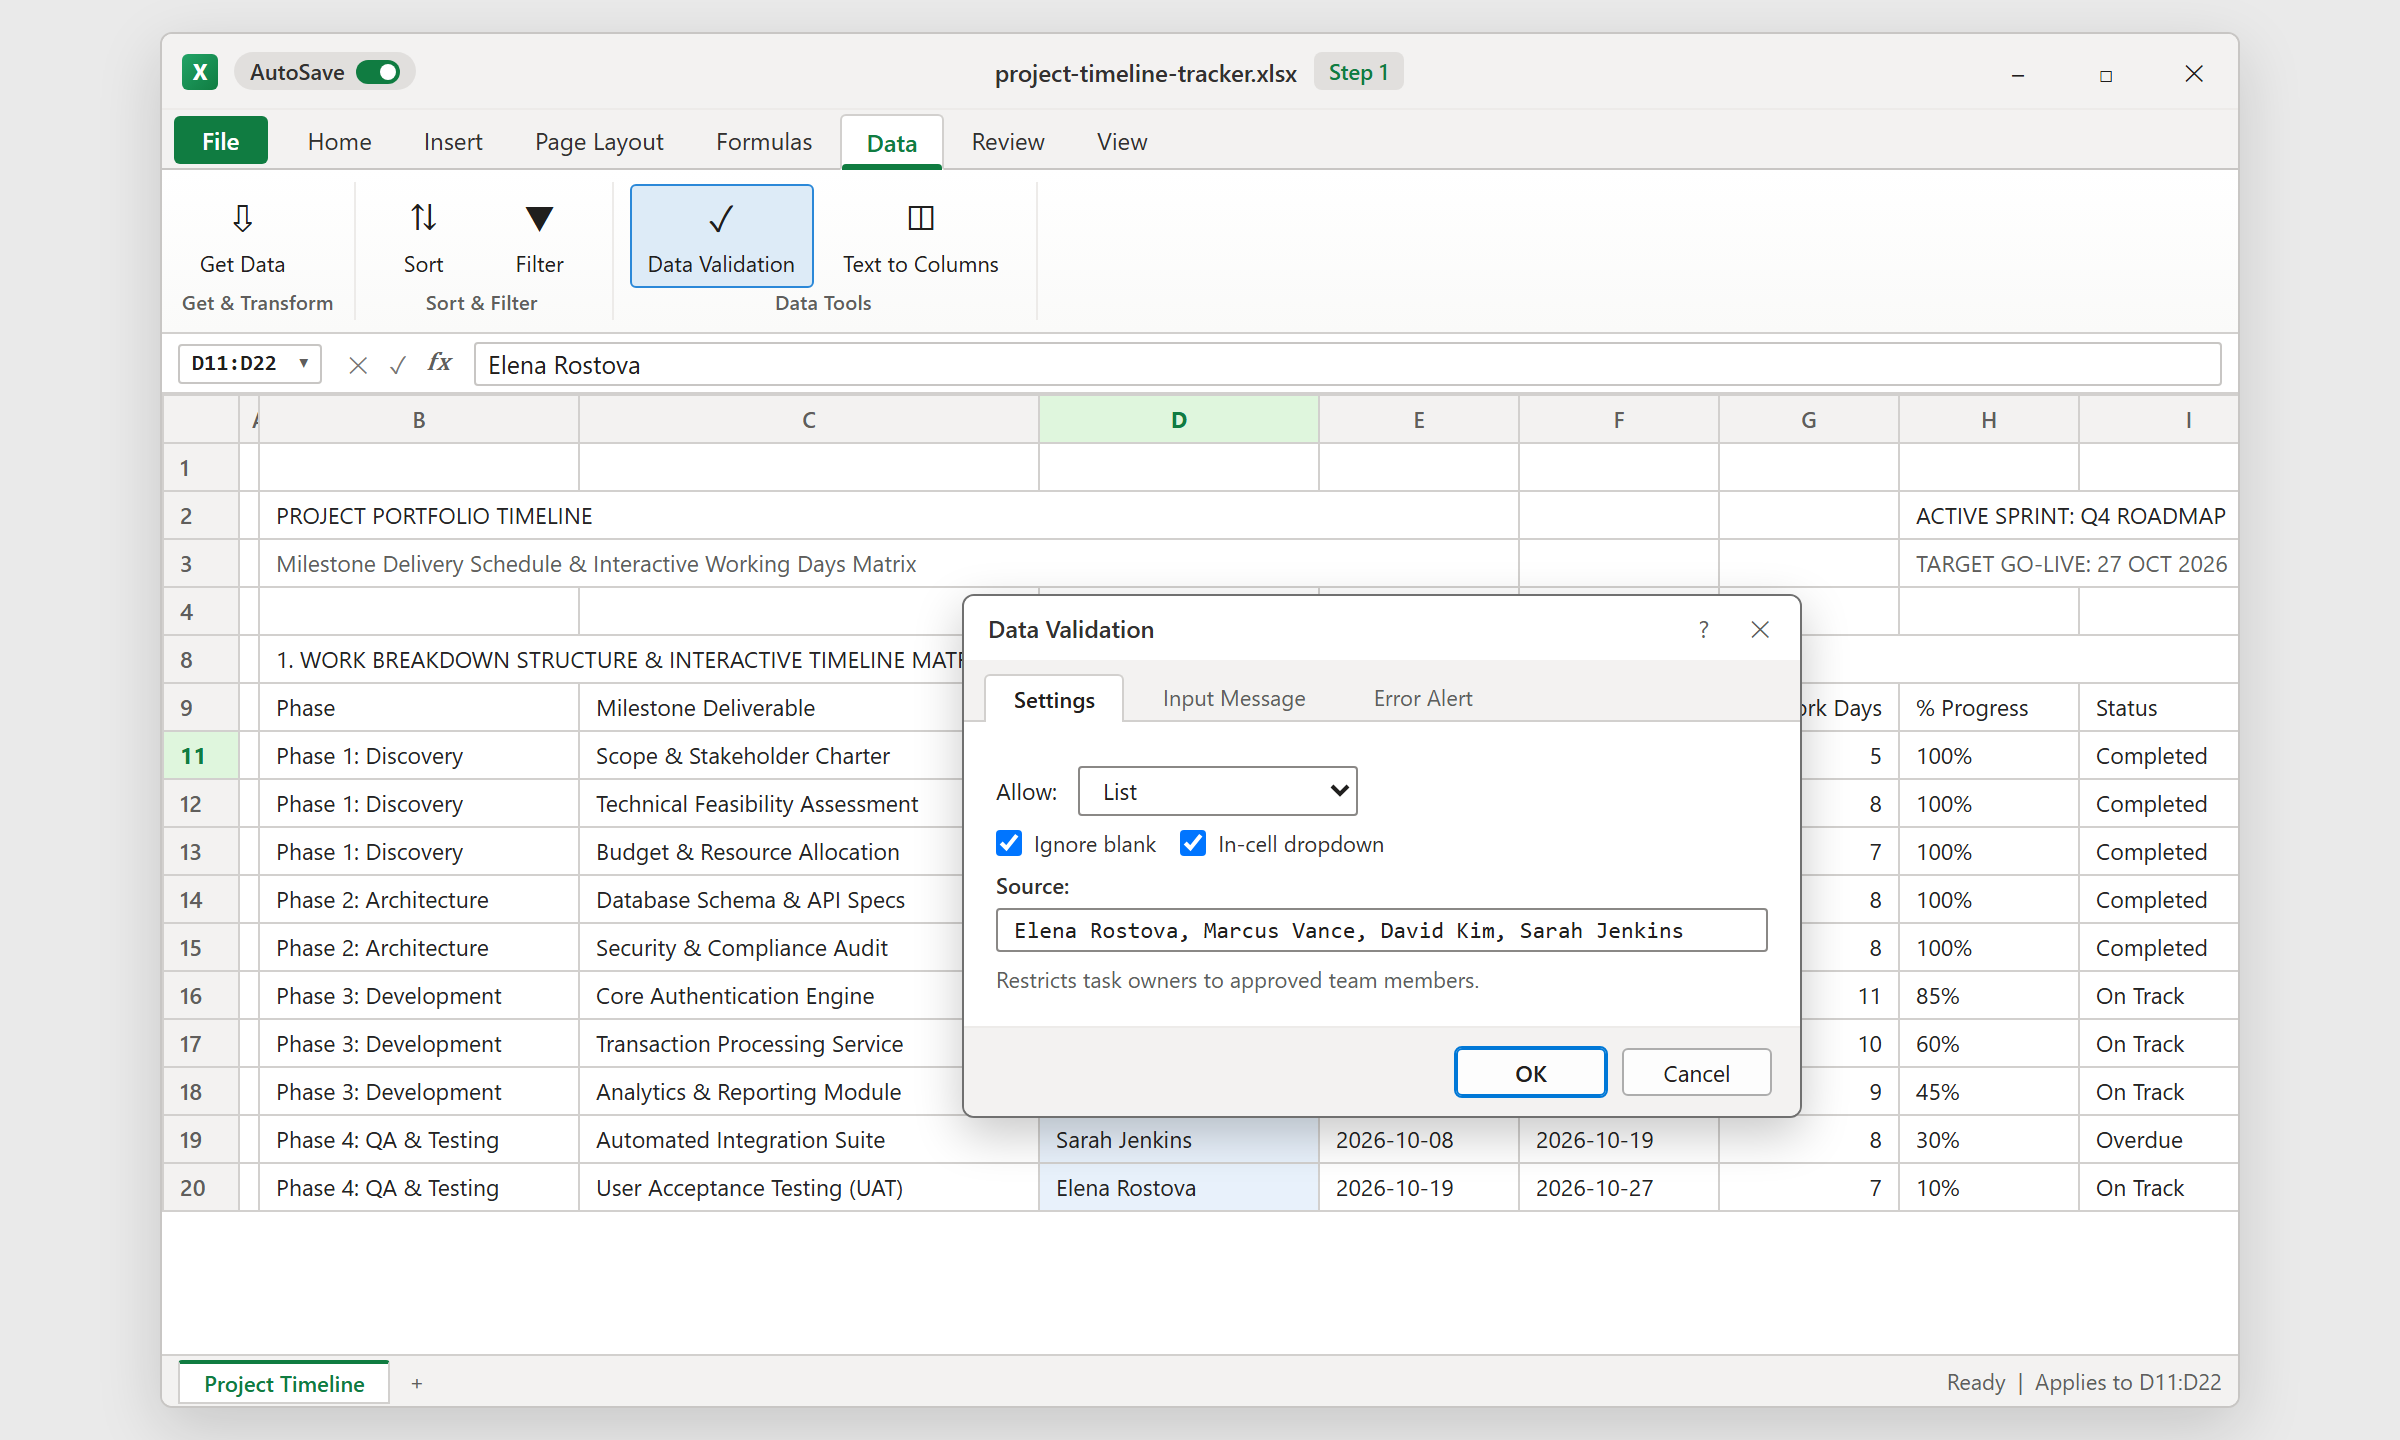
Typing names manually leads to mismatched entries like "Elena R." versus "Elena Rostova". That makes filtering by owner messy. A Data Validation list guarantees consistent names across all 12 deliverables.
Select cells D11:D22 in the Owner column and open Data > Data Validation. Set Allow to List, and in the Source box, type: Elena Rostova, Marcus Vance, David Kim, Sarah Jenkins. Click OK. Now every task is assigned to a single person through a clean in-cell dropdown.
2Step 2: Count True Business Days with NETWORKDAYS
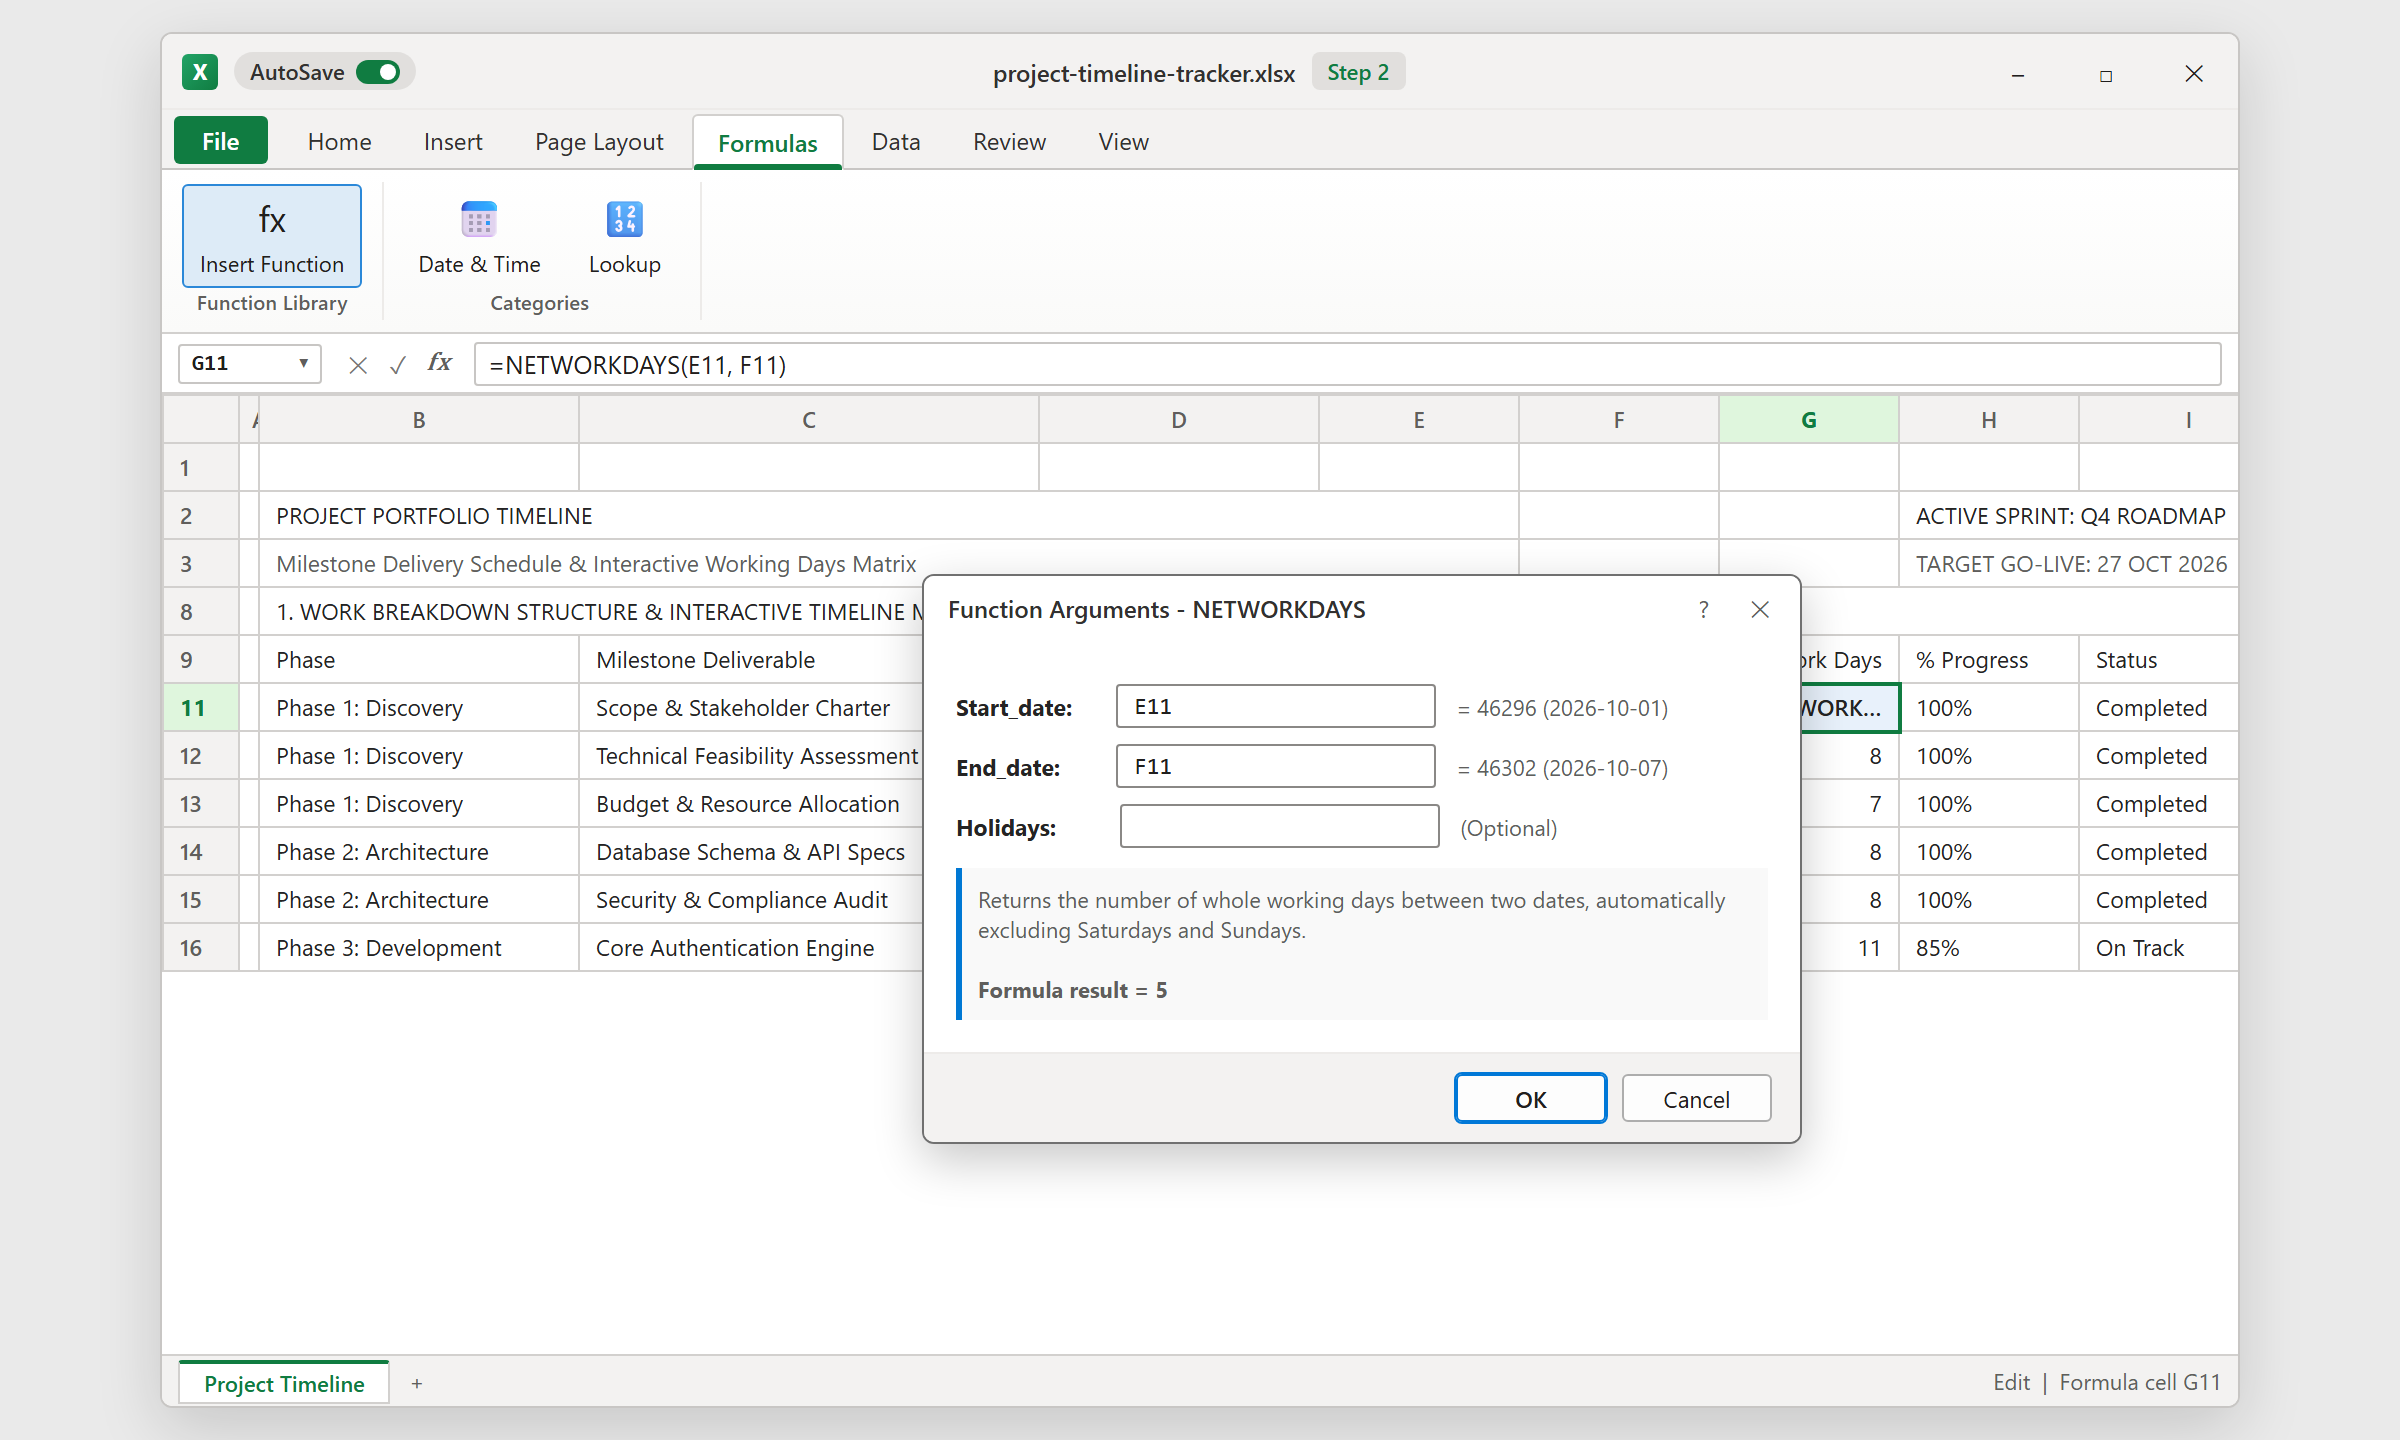
Instead of subtracting dates with simple minus math, use the NETWORKDAYS function. It takes two required inputs: the start date and the end date, and automatically drops weekends from the tally.
Click cell G11 and type =NETWORKDAYS(E11, F11). For the first task starting on October 1 and due October 7, the formula returns 5 working days instead of 7 calendar days. Double-click the fill handle on cell G11 to copy the formula down to row 22. Your team now sees realistic delivery windows for every deliverable.
3Step 3: Add In-Cell Progress Bars with Conditional Formatting
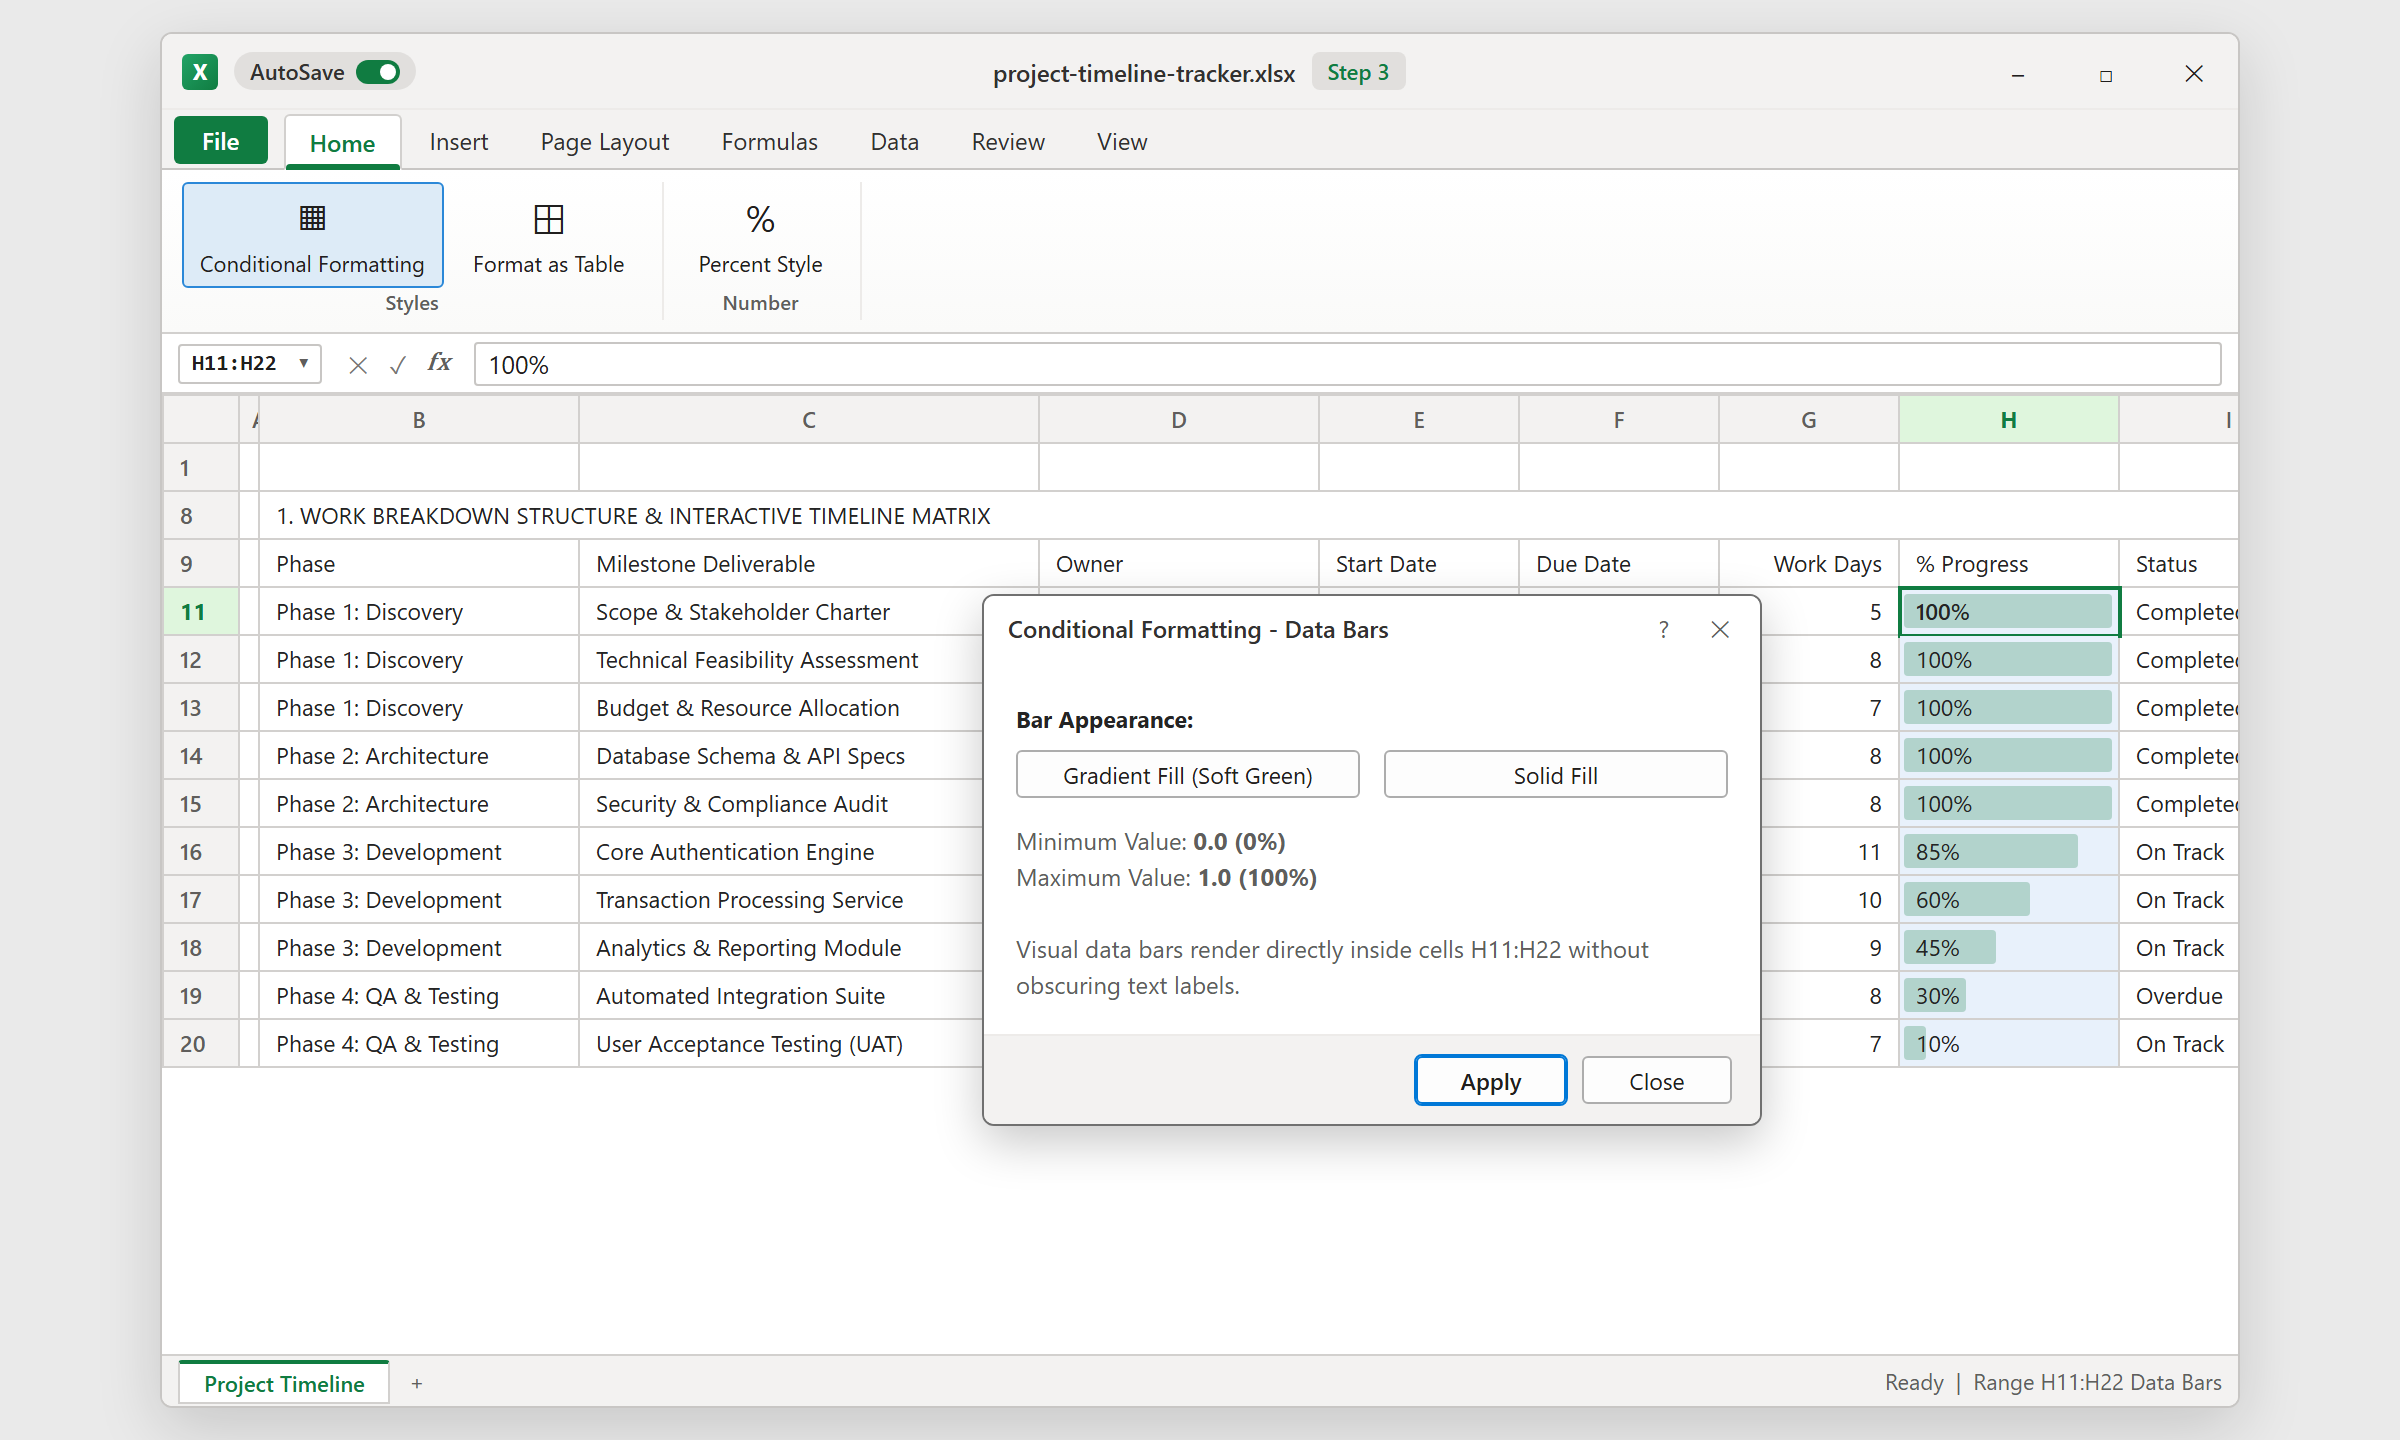
Reading a column of decimal numbers like 0.85 or 0.30 slows down team sync meetings. Data bars turn those percentages into clear visual progress meters inside the cells.
Highlight cells H11:H22. Press Ctrl+1, choose Percentage, and set decimal places to 0%. Then open Home > Conditional Formatting > Data Bars and choose a soft green gradient. As team members update their progress from 10% to 85% and 100%, the green bar stretches across the cell without covering the text.
4Step 4: Build the 4-State Milestone Health Formula
Do not ask people to manually type "Late" or "On Track". Instead, let a nested IF formula check the progress and due date automatically.
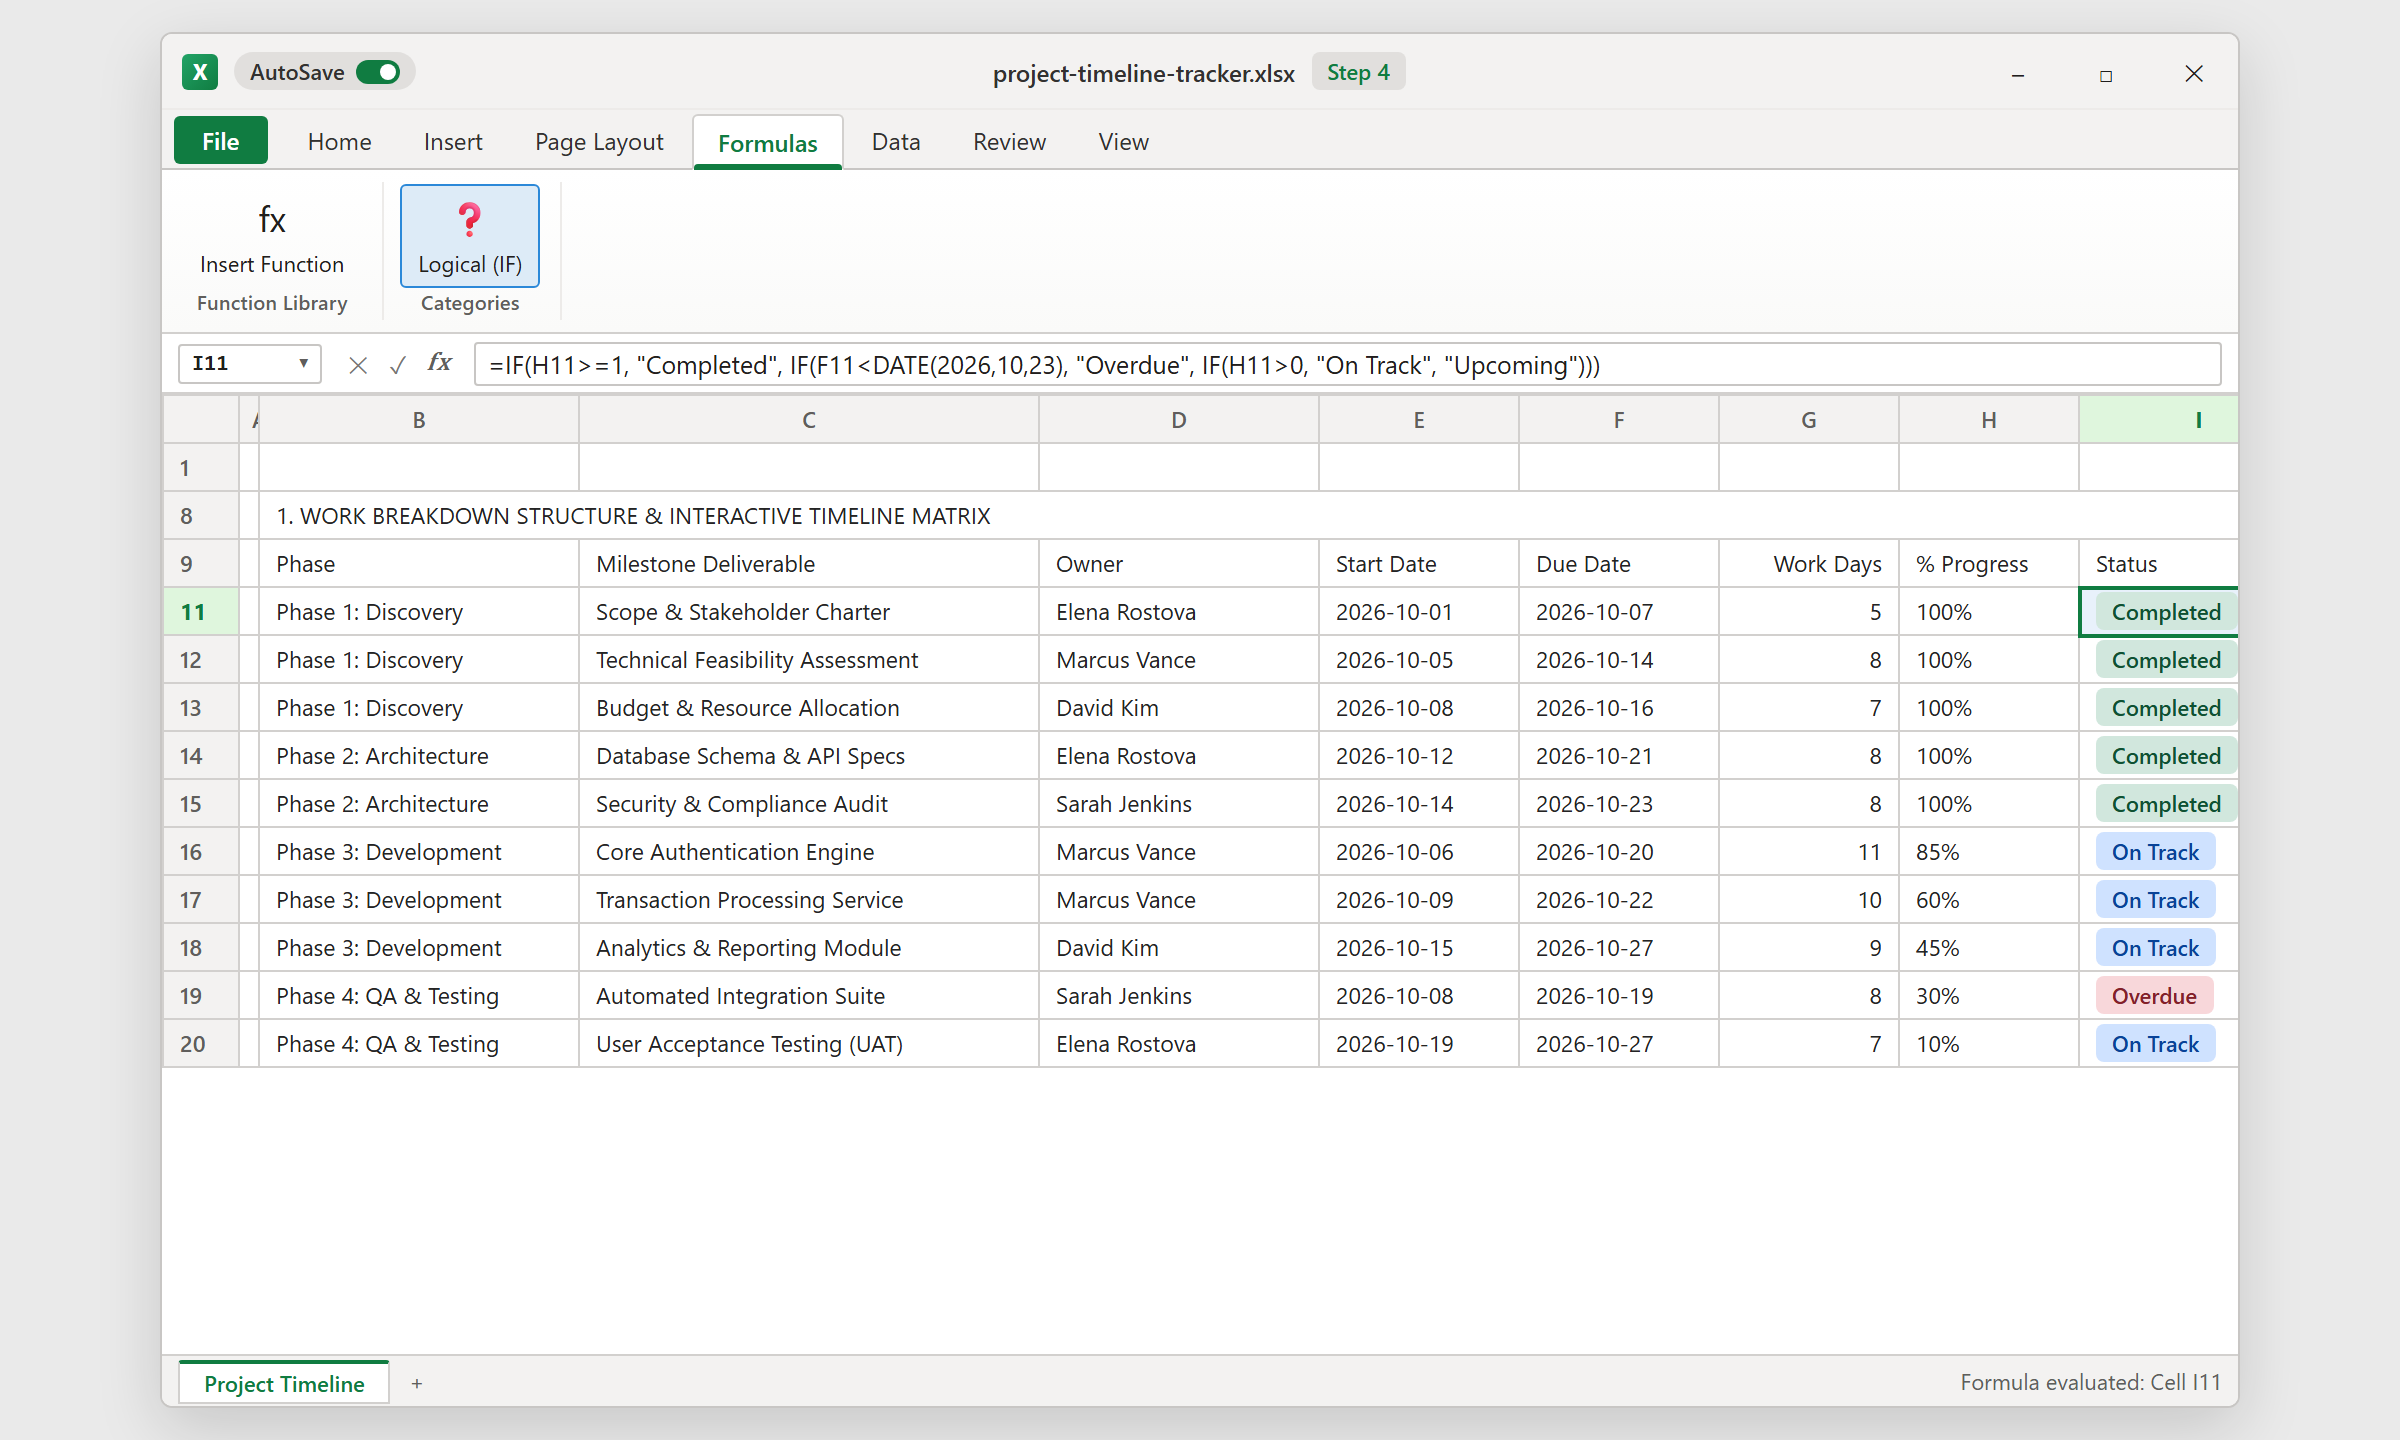
In cell I11, enter: =IF(H11>=1, "Completed", IF(F11<DATE(2026,10,23), "Overdue", IF(H11>0, "On Track", "Upcoming"))). Order matters here: the formula first rewards finished tasks with "Completed". If not finished, it checks whether the due date has already passed today's review date (October 23). If late, it flags "Overdue". In our sample data, tasks like Core Authentication Engine (due Oct 20 at 85%) immediately show Overdue, giving managers an early warning.
5Step 5: Roll Up Portfolio Health and Apply an Accounting Border
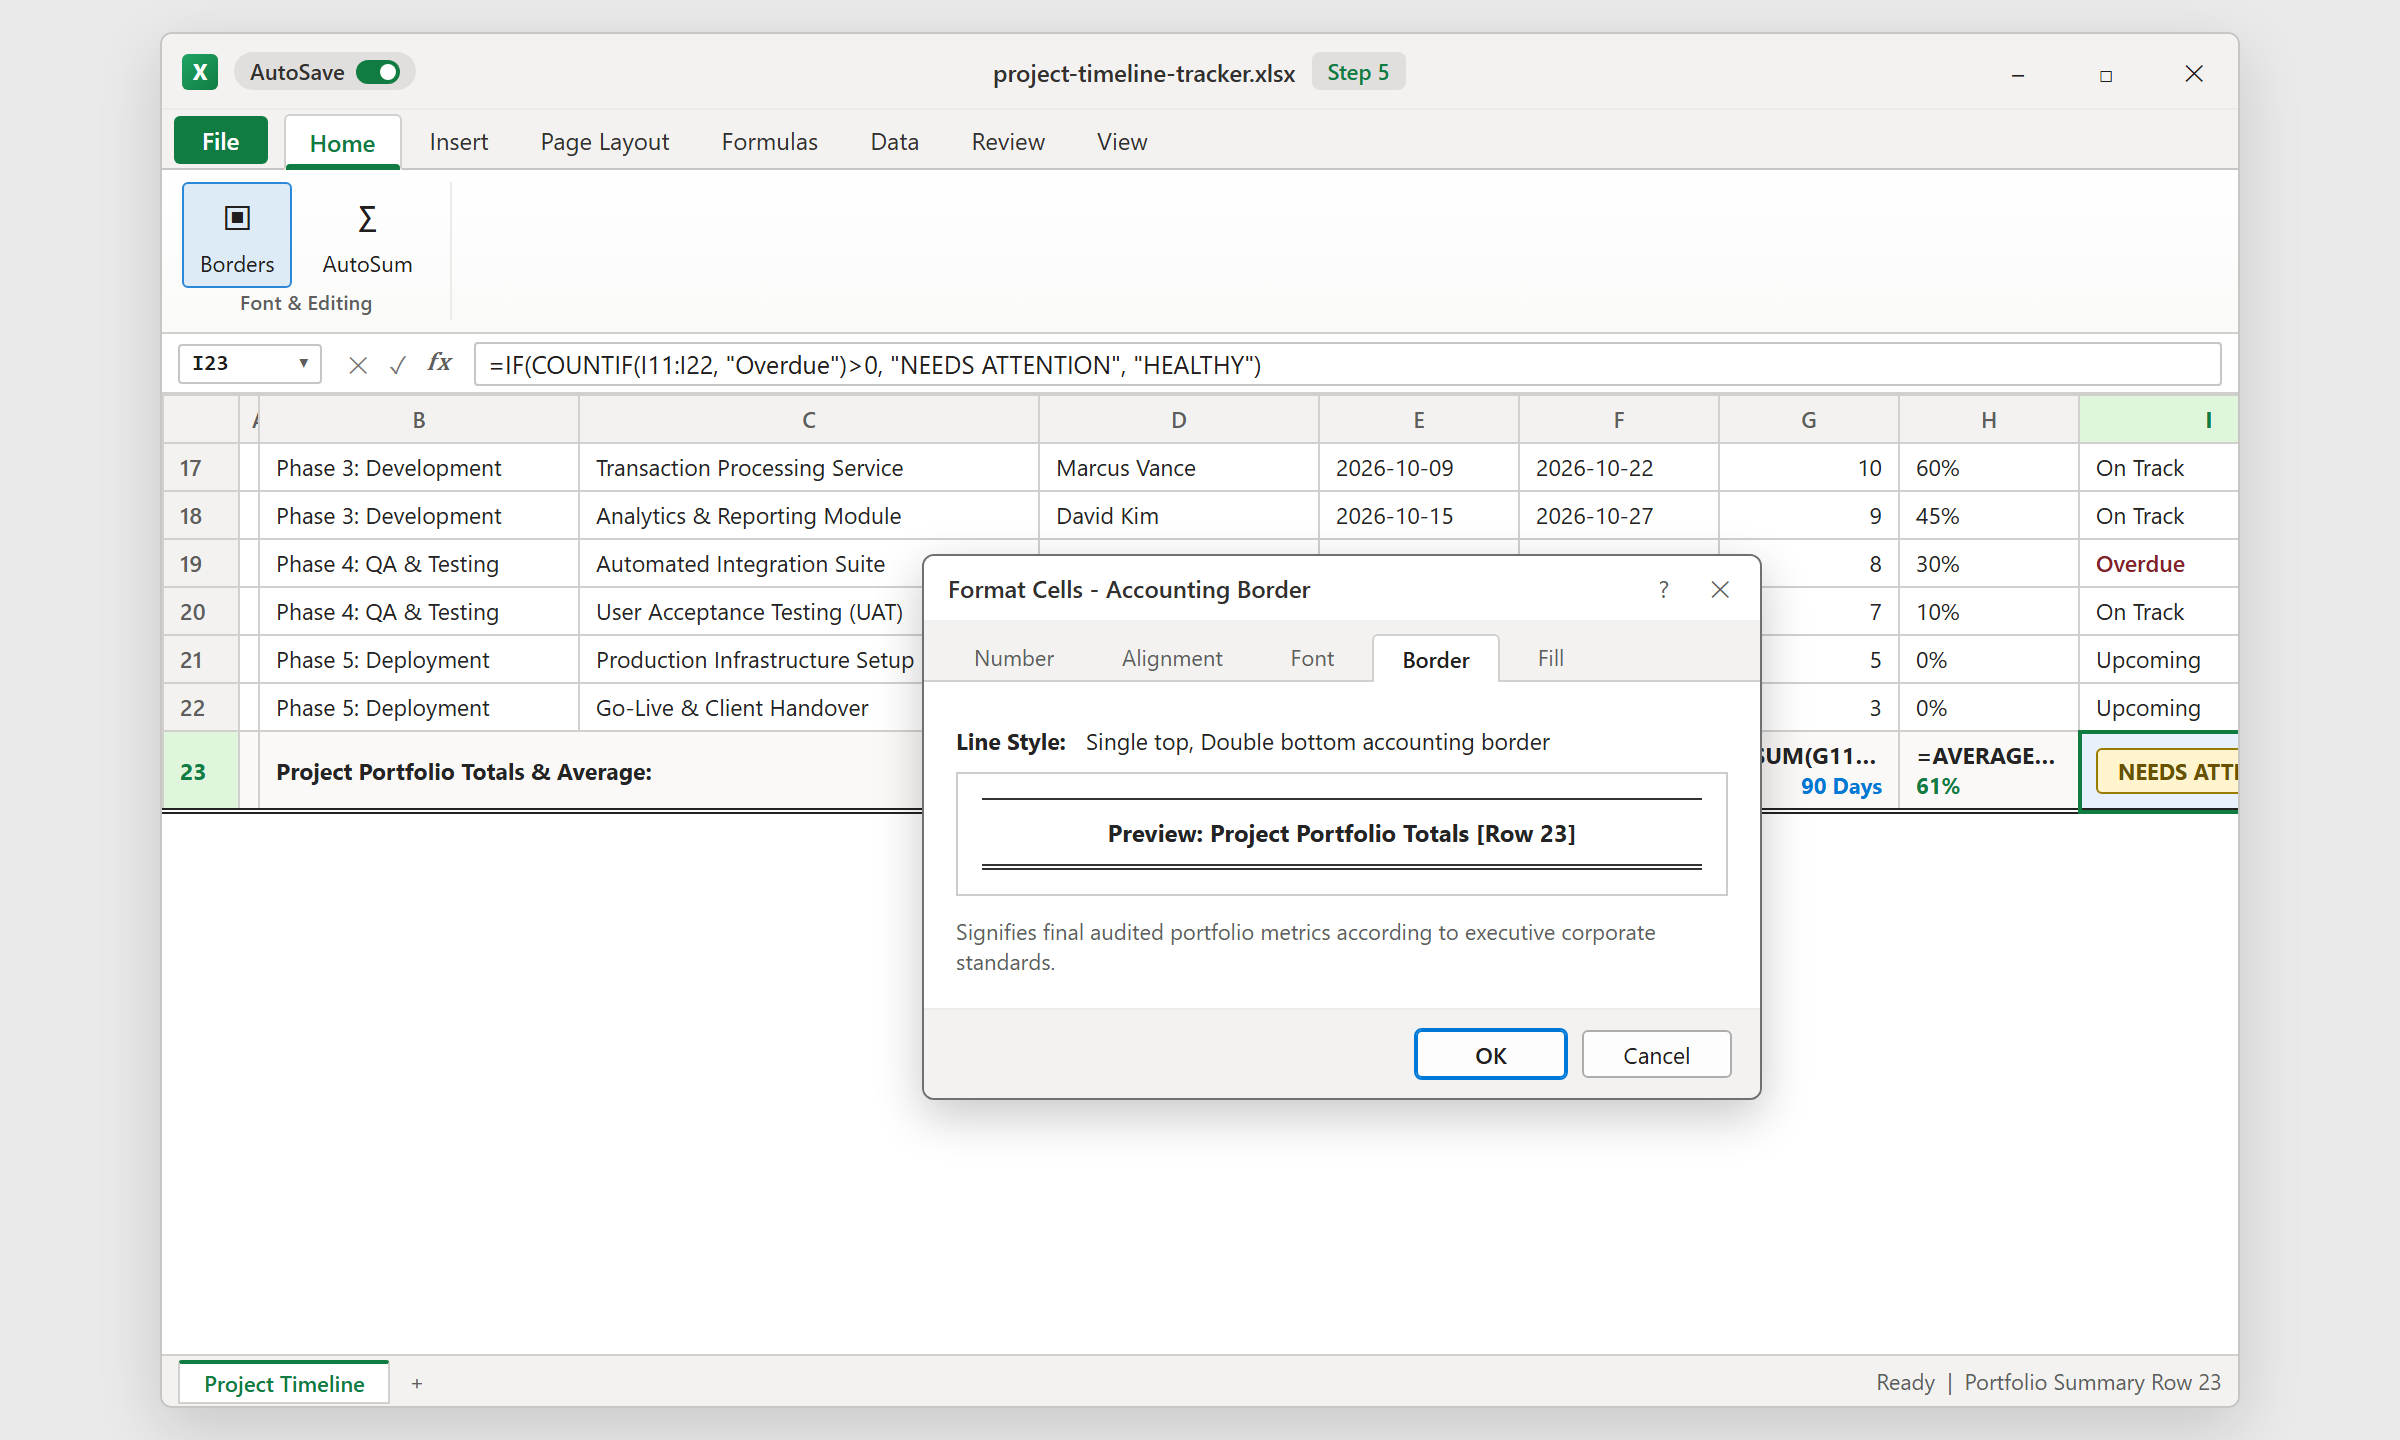
Finish the tracker with an executive summary in row 23. In cell G23, sum the total working days with =SUM(G11:G22) (89 days). In cell H23, average the completion rate with =AVERAGE(H11:H22) (60.8%).
In cell I23, add the portfolio guardrail: =IF(COUNTIF(I11:I22, "Overdue")>0, "NEEDS ATTENTION", "HEALTHY"). If even a single task is late, the card warns leadership. Select row 23, press Ctrl+1, go to the Border tab, and apply a classic Top Border and Double Bottom Border to match professional financial and management standards.
Critical Path & Float Time: Keeping Multi-Phase Deliverables on Schedule
Download the Template

Spreadsheet educator and web developer passionate about hands-on interactive spreadsheet practice.
Related Practical Exercises
Explore more hands-on spreadsheet models with downloadable practice workbooks.
 Finance
Loan Payoff Calculator Excel Template
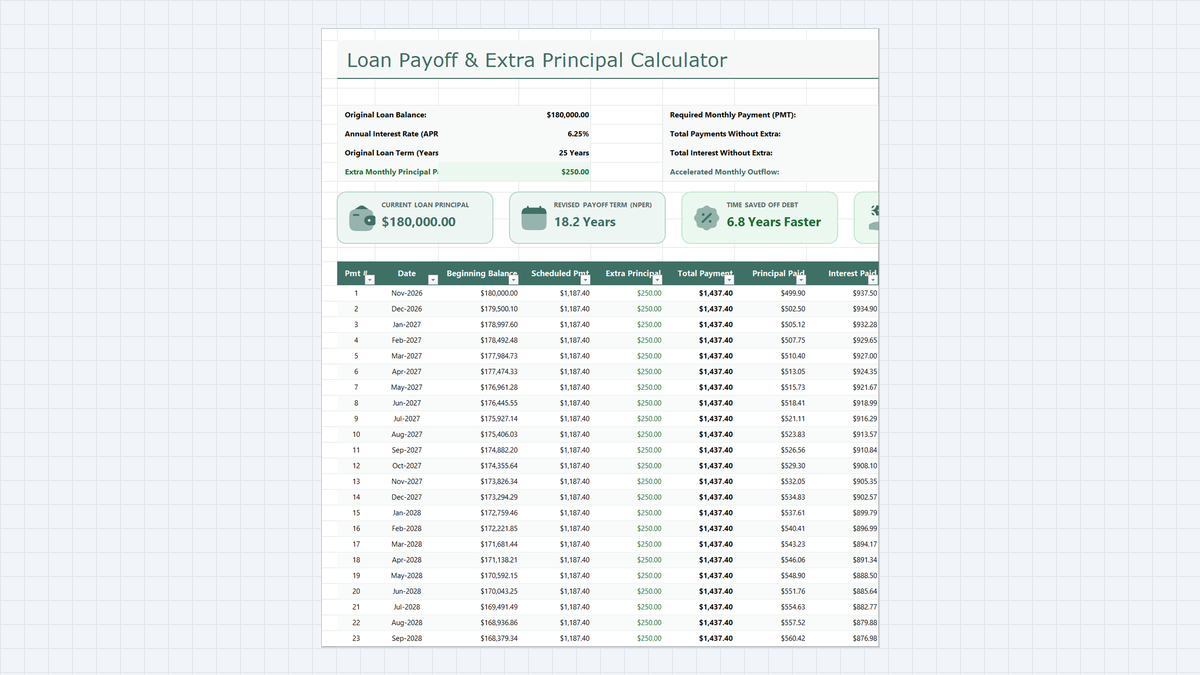
See how extra principal payments shorten a loan. Build a loan payoff calculator in Microsoft Excel with a PMT-based payment, a monthly amortization schedule, and the interest-versus-principal split behind every payment.
 Finance
Leveraged Buyout (LBO) Model Excel Template
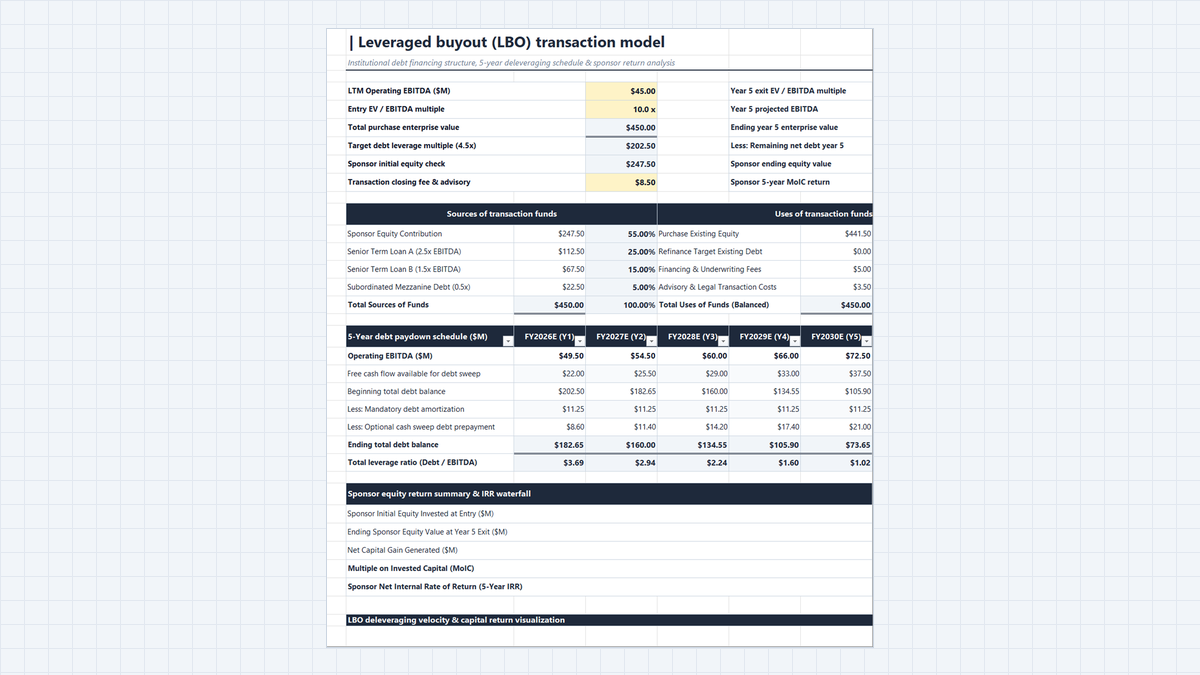
Build a 5-year leveraged buyout (LBO) model in Microsoft Excel. Set entry valuation, balance a sources and uses table, run a debt paydown schedule with an 80% cash sweep, and calculate sponsor MoIC and IRR.
 Sales
Sales Forecast Template Excel (Annual Model)
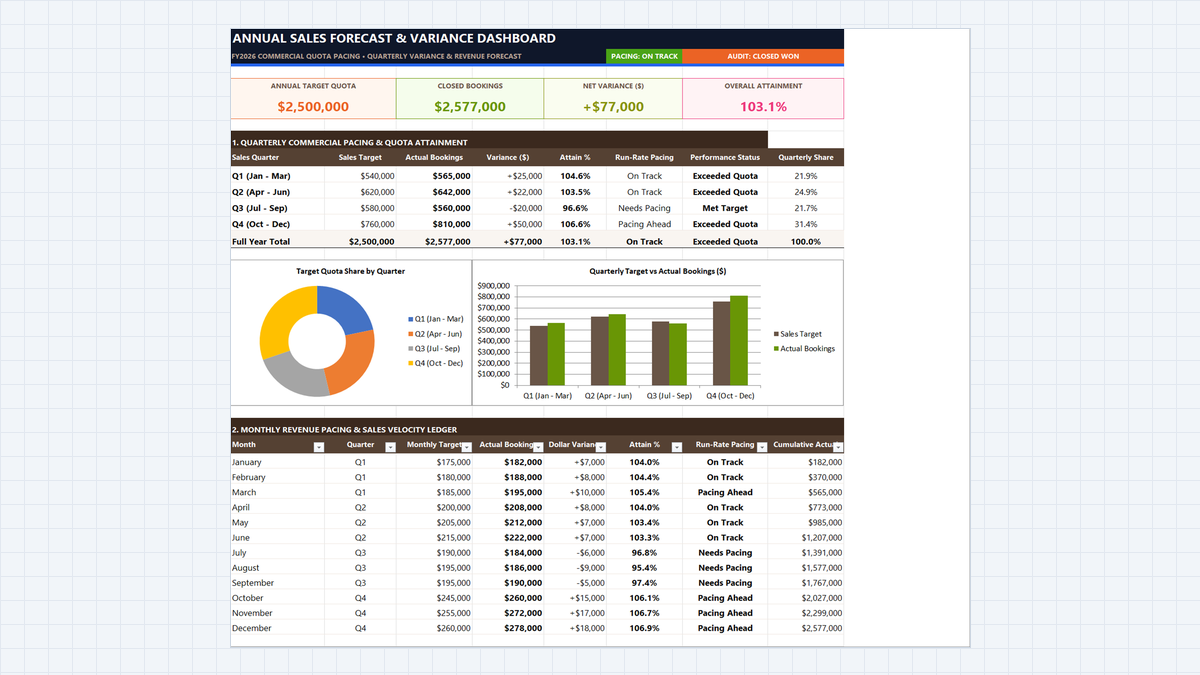
Learn commercial revenue forecasting in Microsoft Excel. Build an annual sales forecasting dashboard featuring quarterly variance calculations, dynamic quota attainment metrics, clustered column comparison charts, and executive pacing scorecards.
 Finance
Budget vs Actual Variance Analysis Excel Template
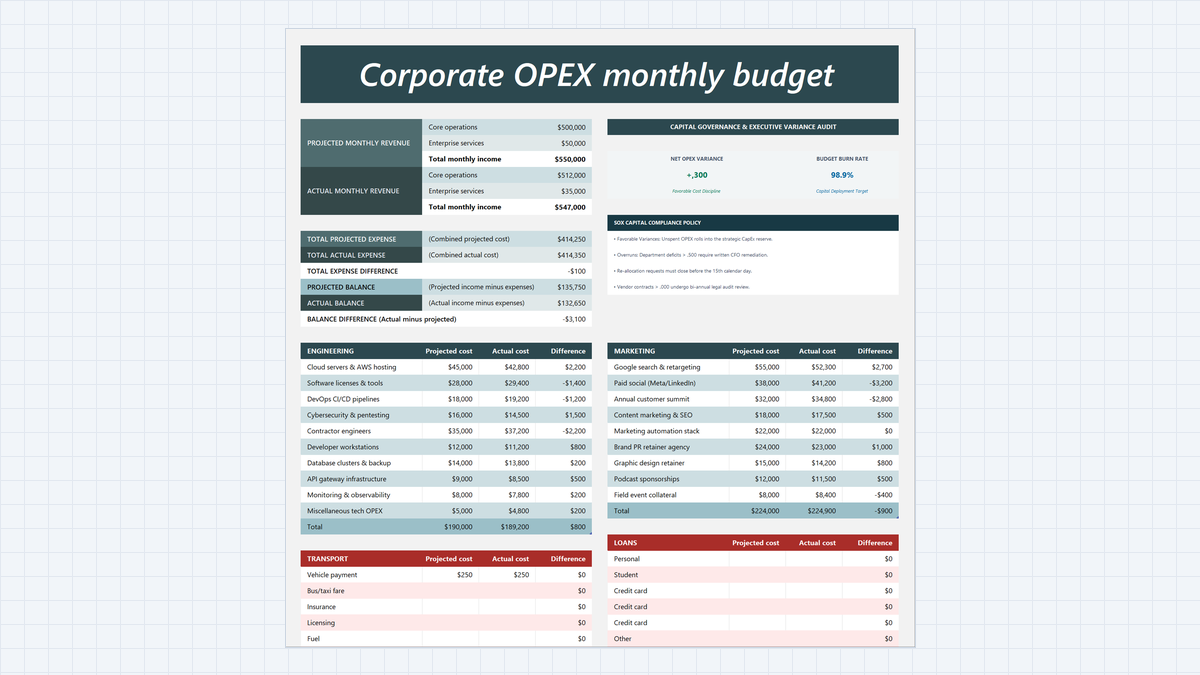
Build a Budget vs Actual Variance Analysis Excel Template with Engineering and Marketing cost centers, structured variance formulas, filter-proof SUBTOTAL totals, overrun highlights, and an executive SOX compliance card.
 Finance
12-Month Cash Flow Statement Excel Template
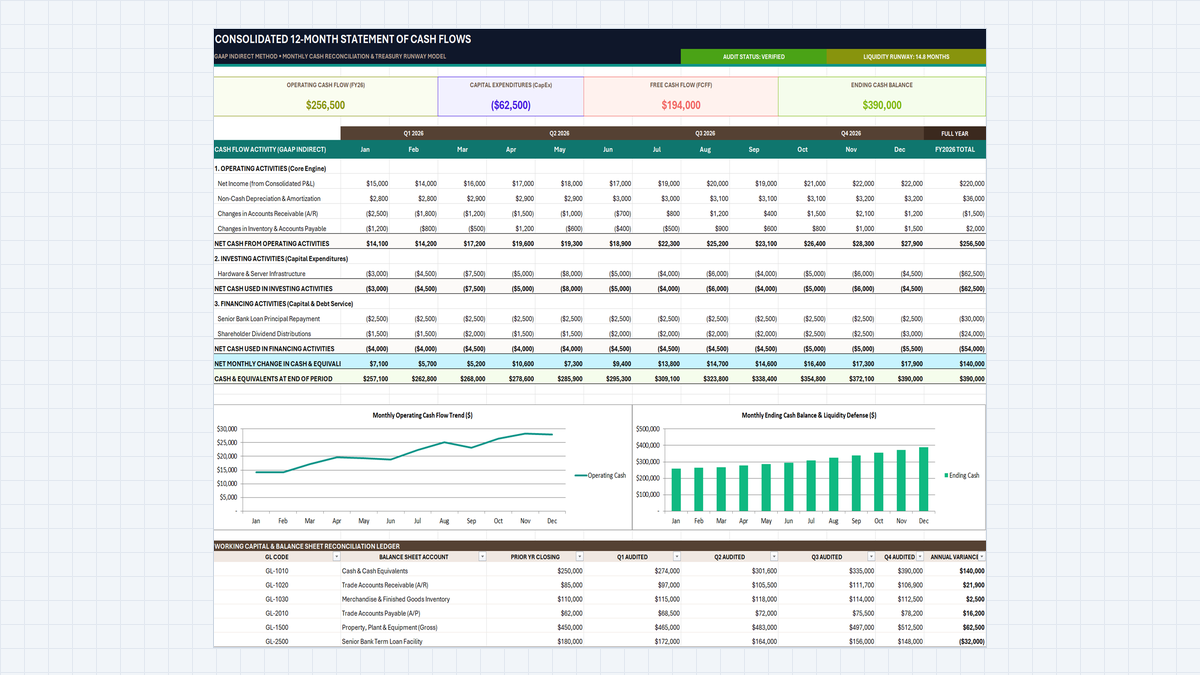
Build a 12-month cash flow statement in Excel with the indirect method: operating, investing and financing sections, a rolling cash balance, a Free Cash Flow to Firm (FCFF) card and a simple low-cash alert.
Discussion
Ask questions, share formula tips, or discuss alternative approaches with fellow spreadsheet builders.
Loading discussion...