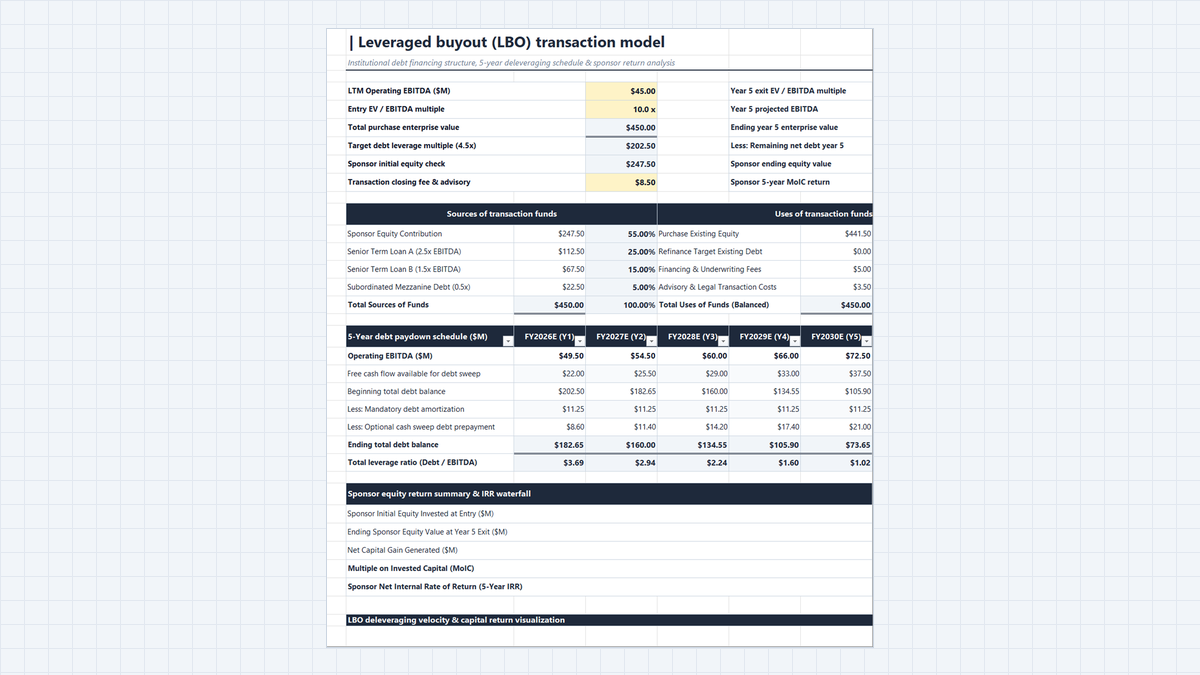
Buying a company with borrowed money works only if the numbers hold up under pressure. This Leveraged Buyout (LBO) Model Excel Template gives you a tested structure for the whole deal, from purchase price to sponsor return.
You will build a 5-year LBO model for a company with $45.00M of EBITDA. It covers entry valuation, a balanced sources and uses table, a debt paydown schedule, and exit returns, with every figure traced back to a cell.
Why an Untested LBO Model Is Risky
What a Leveraged Buyout (LBO) Model Excel Template Must Contain
- Entry valuation and assumptions: EBITDA, entry multiple, purchase price, debt and equity.
- Sources and uses: where the money comes from and where it goes, balanced to the dollar.
- Forecast and debt schedule: EBITDA growth, mandatory repayment, and the 80% cash sweep.
- Deleveraging ratio: debt divided by EBITDA, year by year.
- Exit and returns: exit value, remaining debt, ending equity, MoIC, and IRR.
| Block | Cells | Key Output |
|---|---|---|
| Entry assumptions | D4:D9 | EV $450.00M, debt $202.50M, equity $247.50M |
| Sources and uses | B11:H16 | Both sides total $450.00M |
| Debt schedule (the LBO debt schedule Excel core) | B18:G24 | Debt falls from $202.50M to $73.65M |
| Leverage ratio | C25:G25 | 3.69x in year 1 to 1.02x in year 5 |
| Exit valuation | F4:H9 | EV $761.25M, equity $687.60M, 2.78x MoIC |
| Return summary | B27:H32 | Gain $440.10M, IRR 22.69% |
Build the LBO Model in 5 Steps
LBO Model. Yellow cells are inputs and gray cells are calculated, so anyone can see what to change. Work through the steps in order, because the debt schedule needs the sources and uses first.1Step 1: Balance the Sources and Uses Table
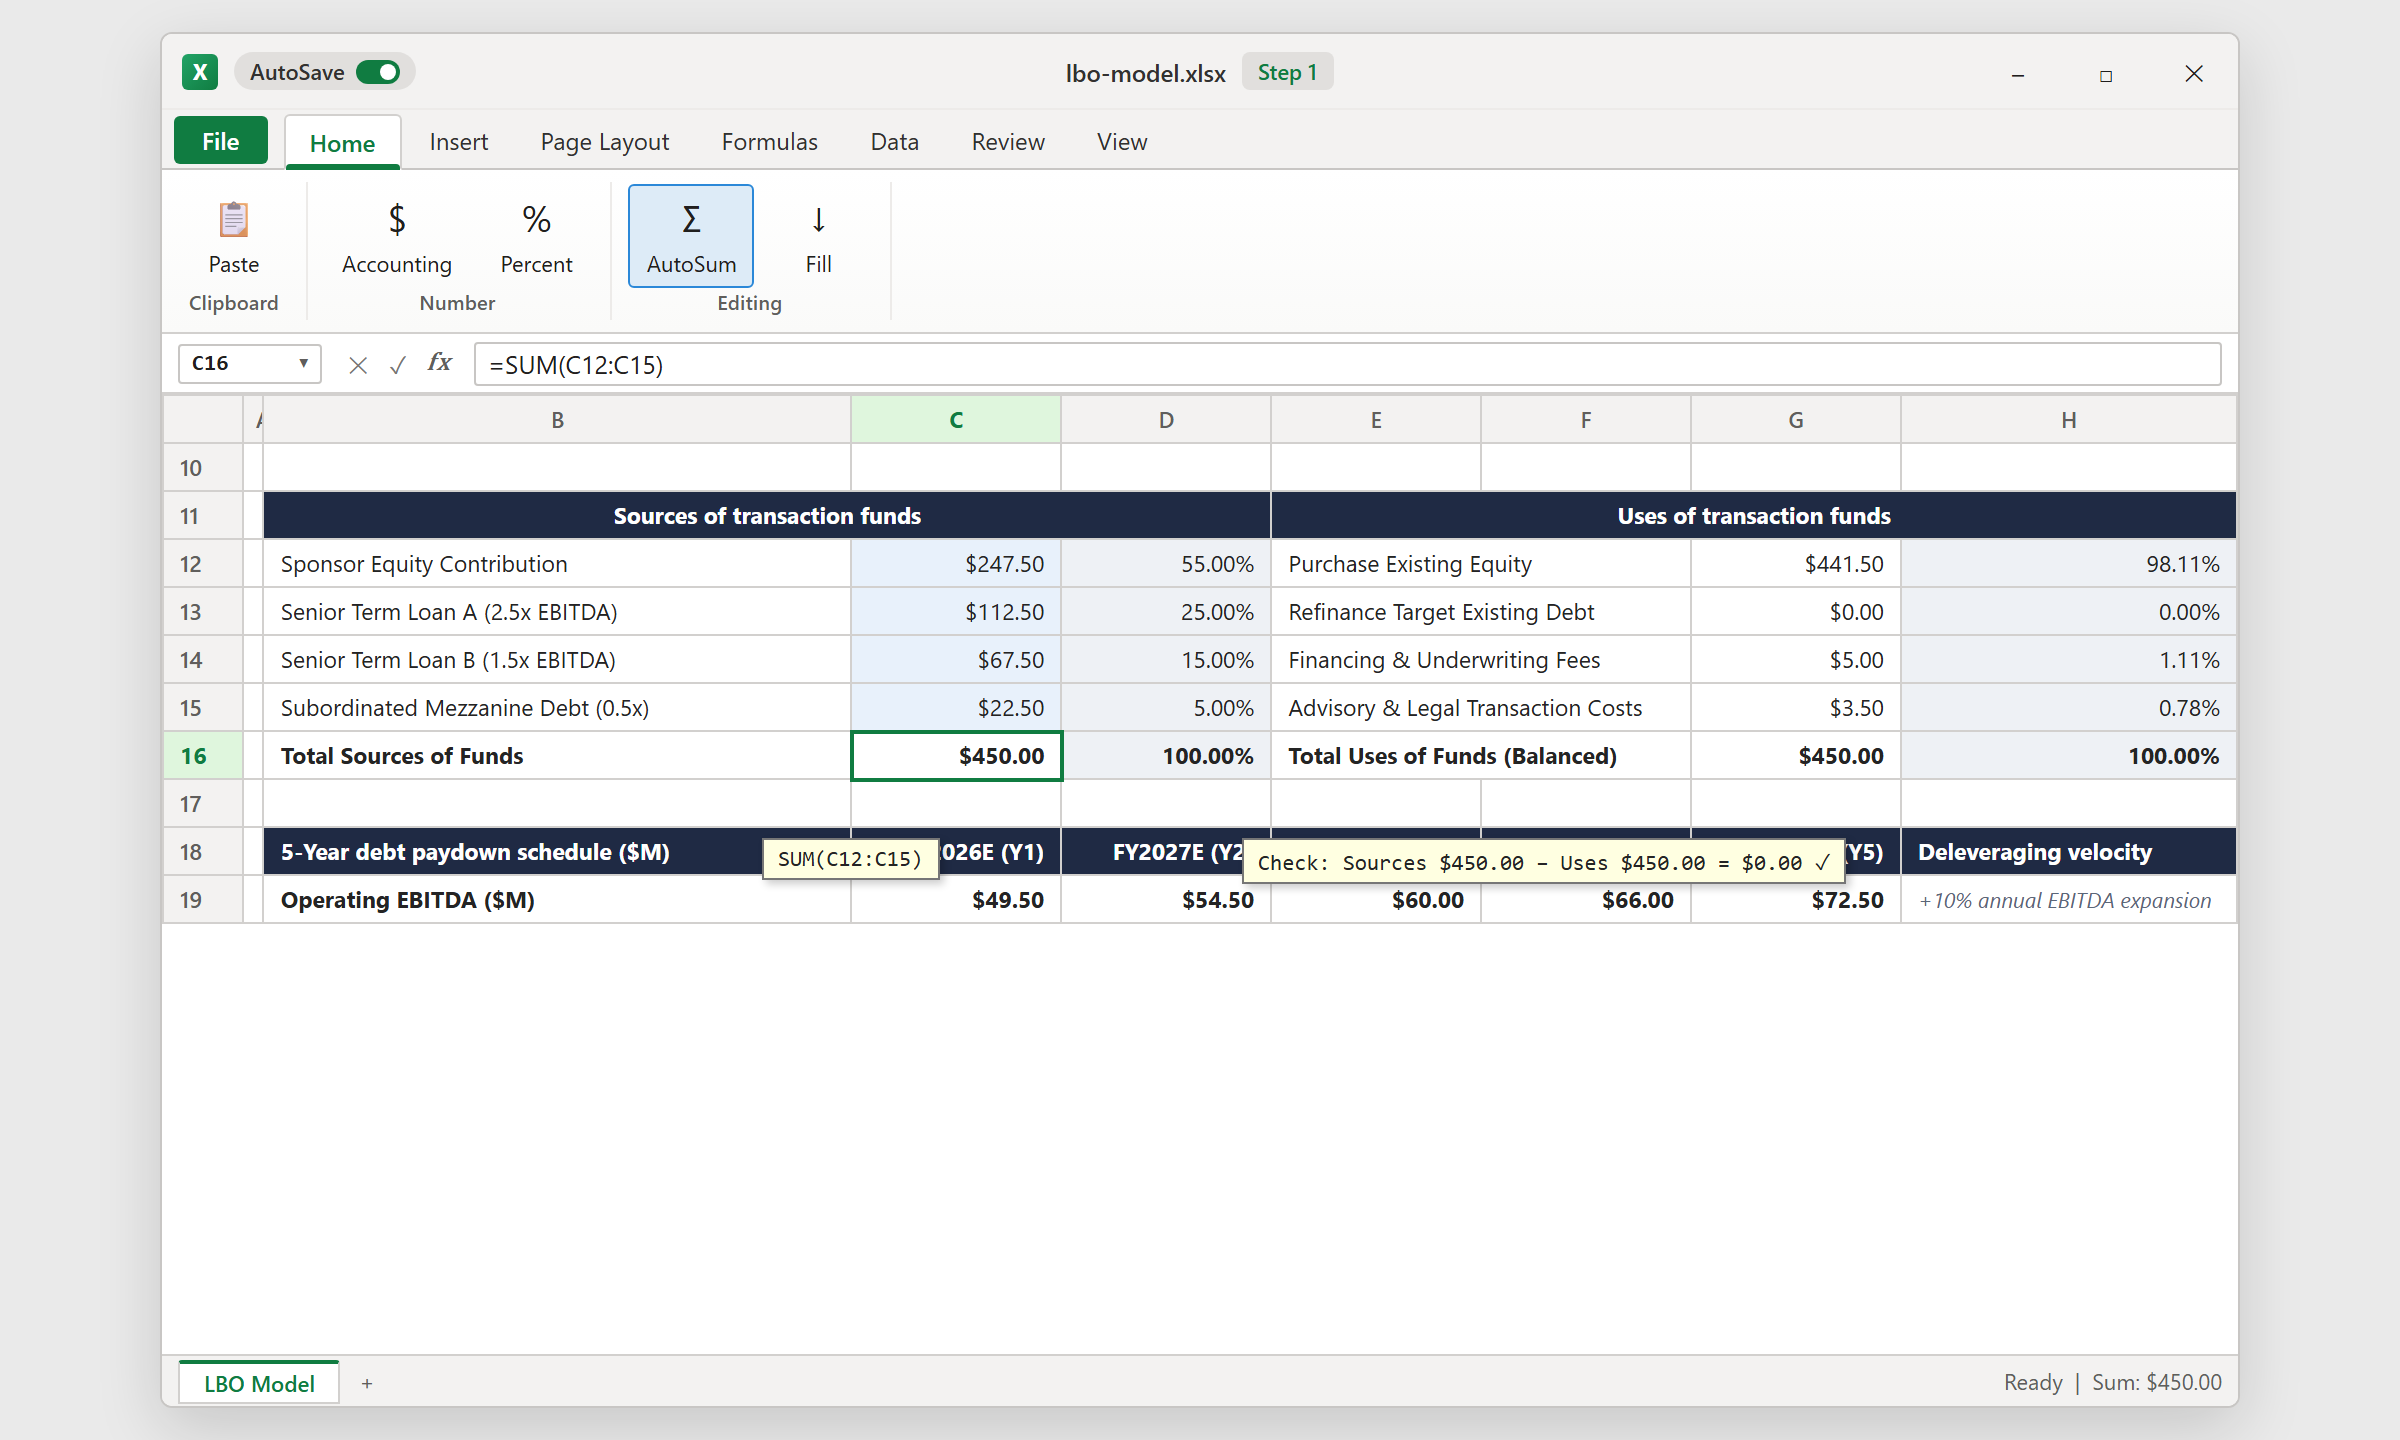
Start with sources: sponsor equity plus three debt tranches. Select the four cells and click AutoSum to total them at $450.00M. Then build the uses side: the purchase of existing equity ($441.50M, which is the enterprise value minus the $8.50M closing fee), plus $5.00M of financing fees and $3.50M of advisory costs.
The two totals must match exactly. Add a check cell that subtracts uses from sources and shows zero. If someone edits a fee later, the check tells you immediately that the deal no longer balances.
2Step 2: Structure the Debt Tiers and Format Multiples
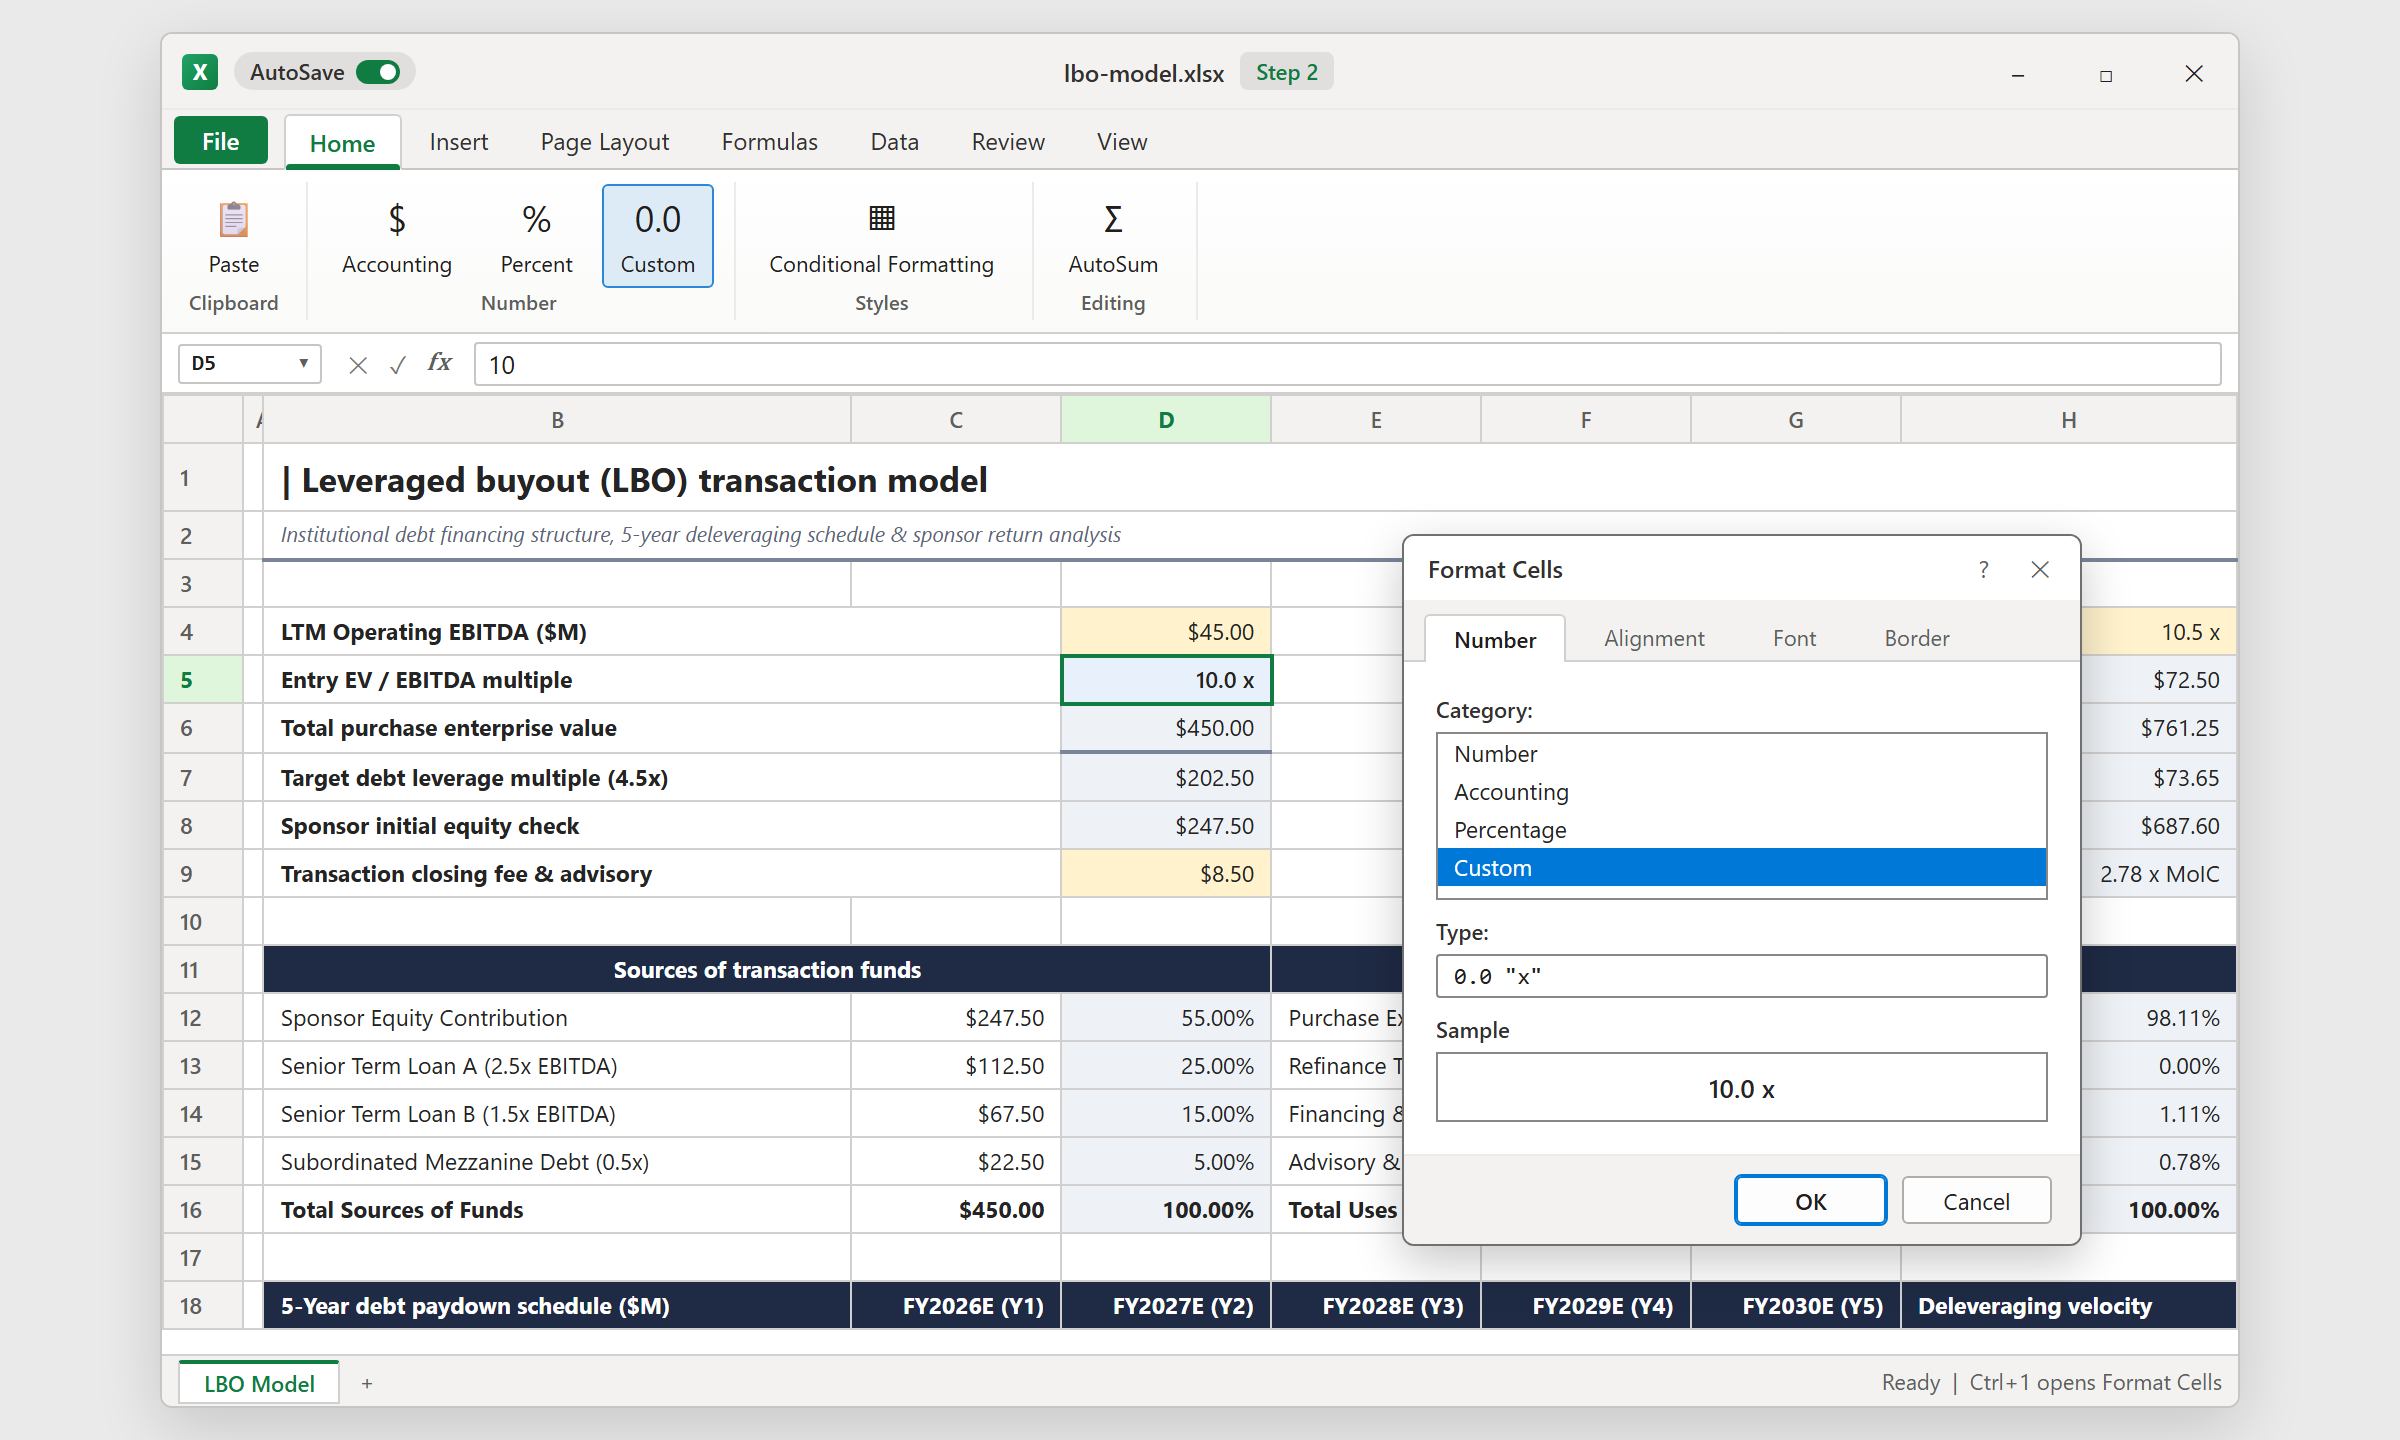
Total debt is 4.5x EBITDA, split into Term Loan A at 2.5x ($112.50M), Term Loan B at 1.5x ($67.50M), and mezzanine at 0.5x ($22.50M). Each tranche is EBITDA times its multiple, and the sponsor equity is the price minus total debt.
Select the multiple cells and press Ctrl+1. On the Custom tab, enter a number format that shows the digit with one decimal followed by an x, so 10 appears as 10.0 x. This workbook writes the tranche multiples inside formulas, so a good upgrade for your own Leveraged Buyout Model Excel file is to give each multiple its own yellow input cell.
3Step 3: Model Mandatory Amortization and the Cash Sweep
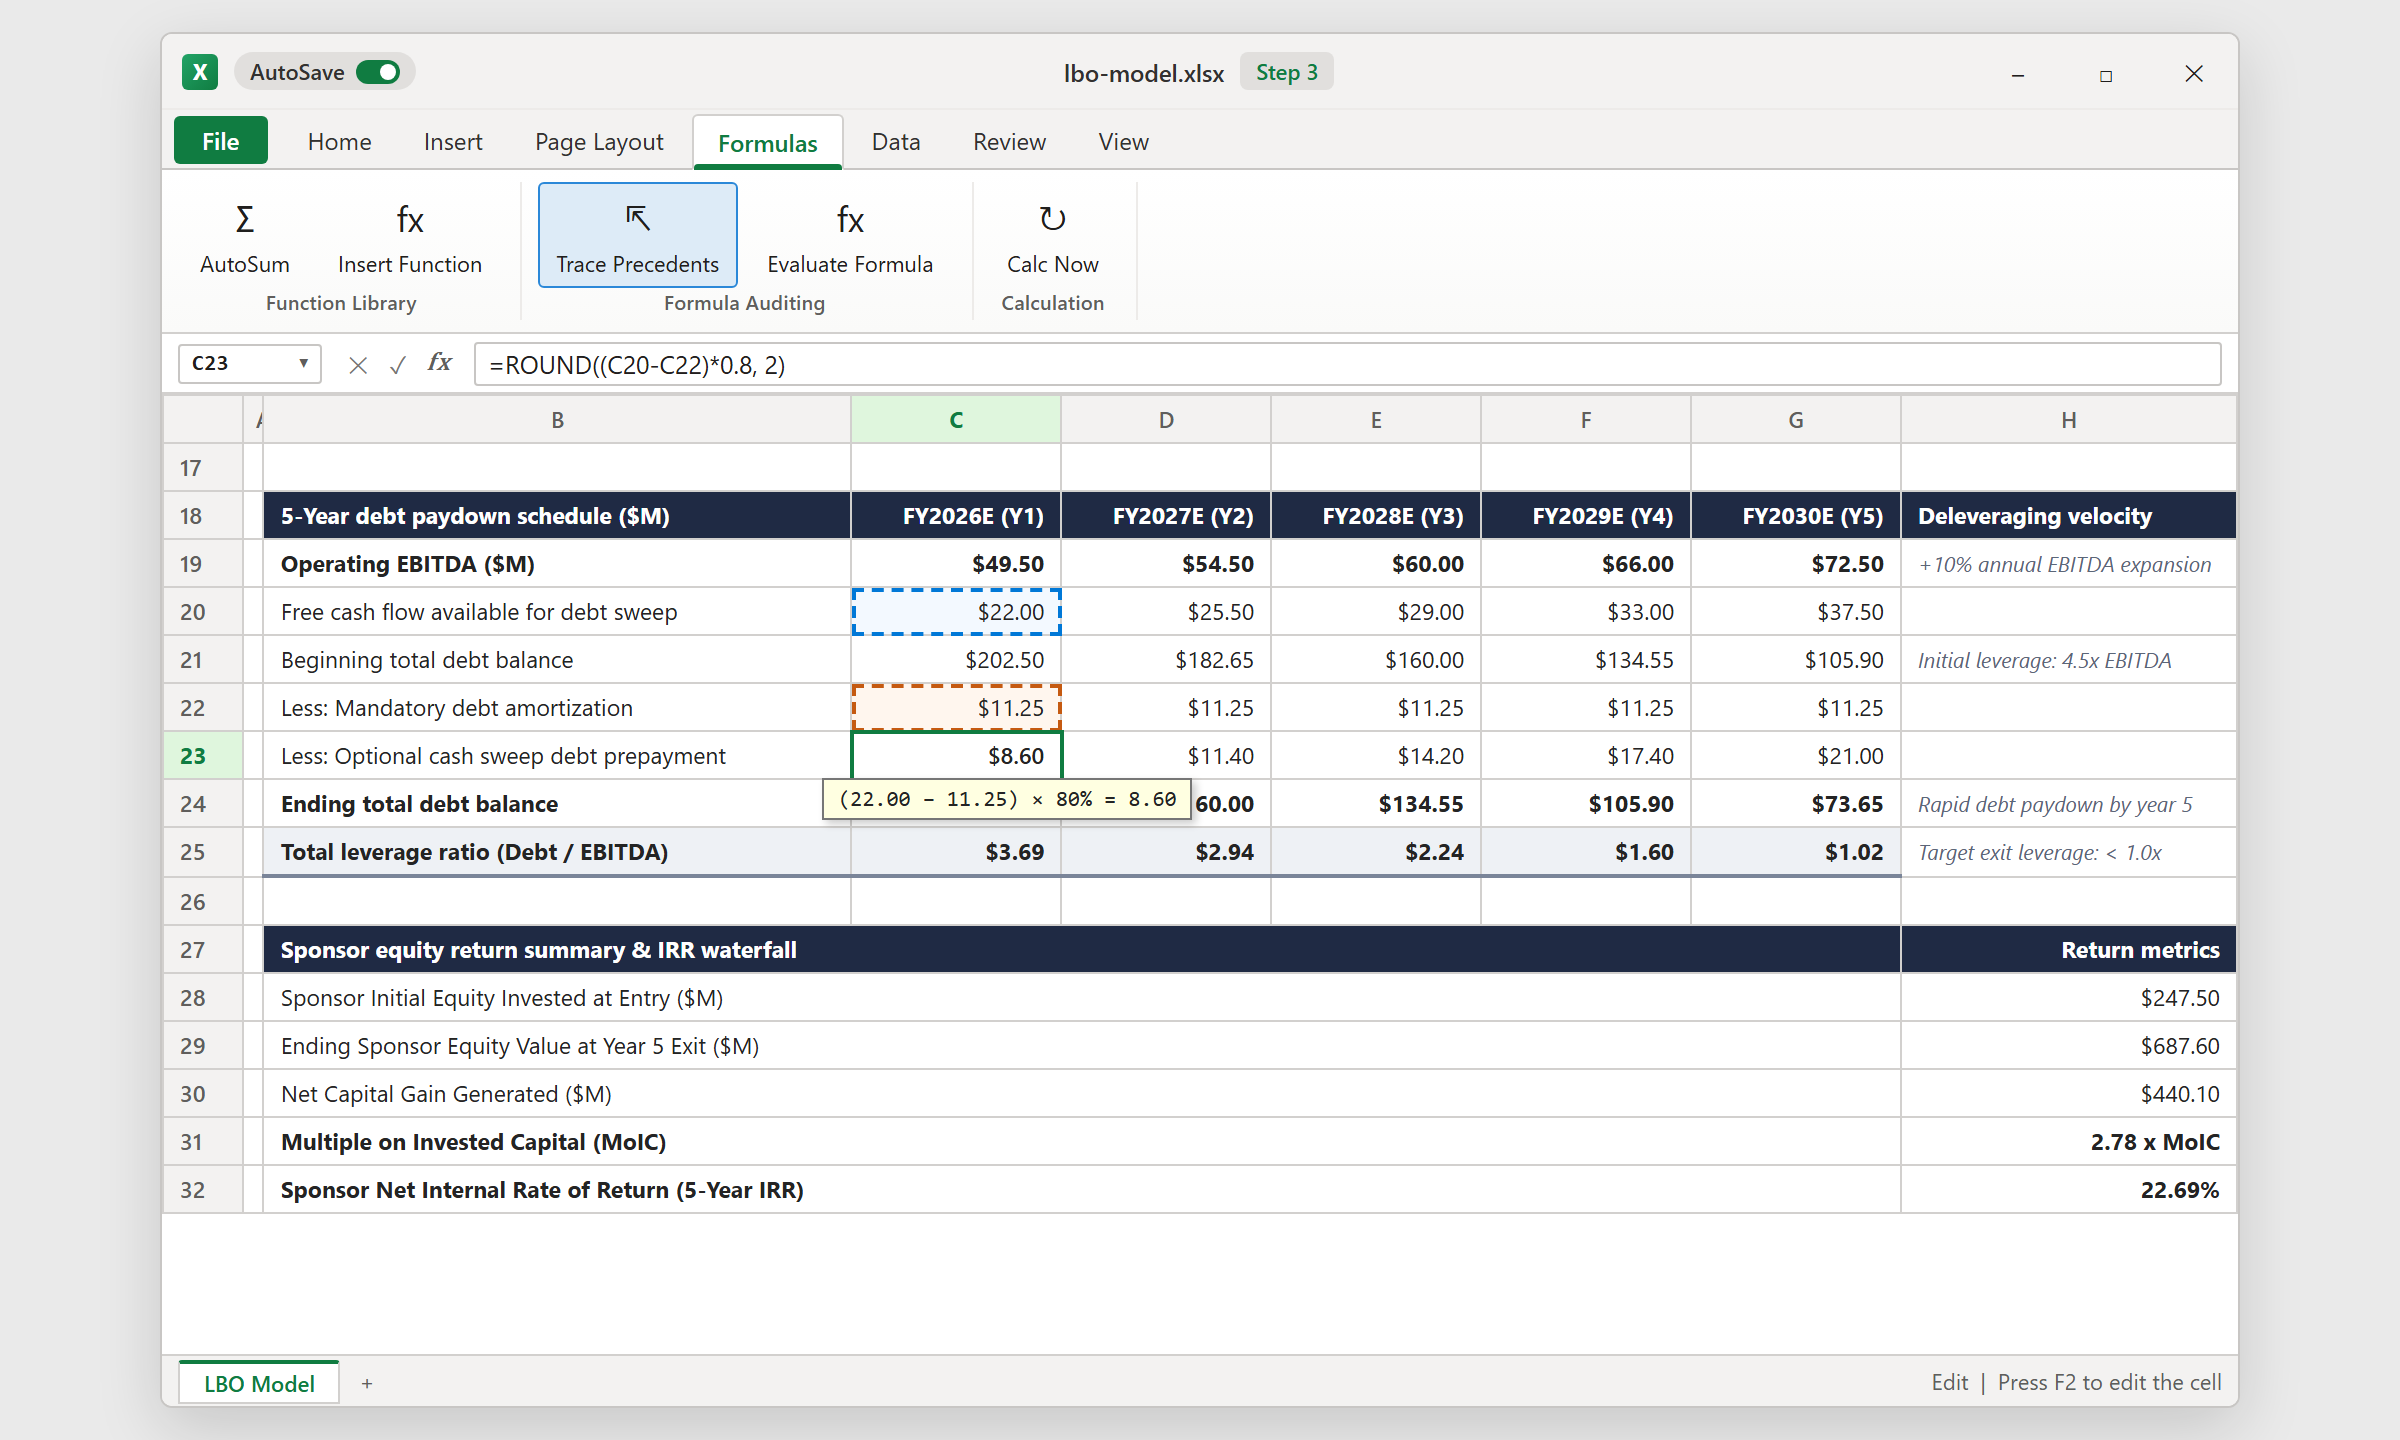
Each year has two repayments. Mandatory amortization is 10% of Term Loan A, which is $11.25M every year. The optional sweep takes 80% of the free cash flow left after that mandatory payment. In year 1, $22.00M minus $11.25M leaves $10.75M, and 80% of that is $8.60M.
Click the sweep cell and press F2 to see the two source cells highlighted. Total repayment in year 1 is $19.85M, so debt drops from $202.50M to $182.65M. Over five years the company repays $128.85M, about 64% of the original debt.
Notice that the remaining 20% of free cash flow is not tracked as cash. The model compares gross debt at exit, which is a conservative simplification. Also, free cash flow is typed in, so make sure it is already after interest and taxes when you use your own numbers.
4Step 4: Track Deleveraging with a Color Scale
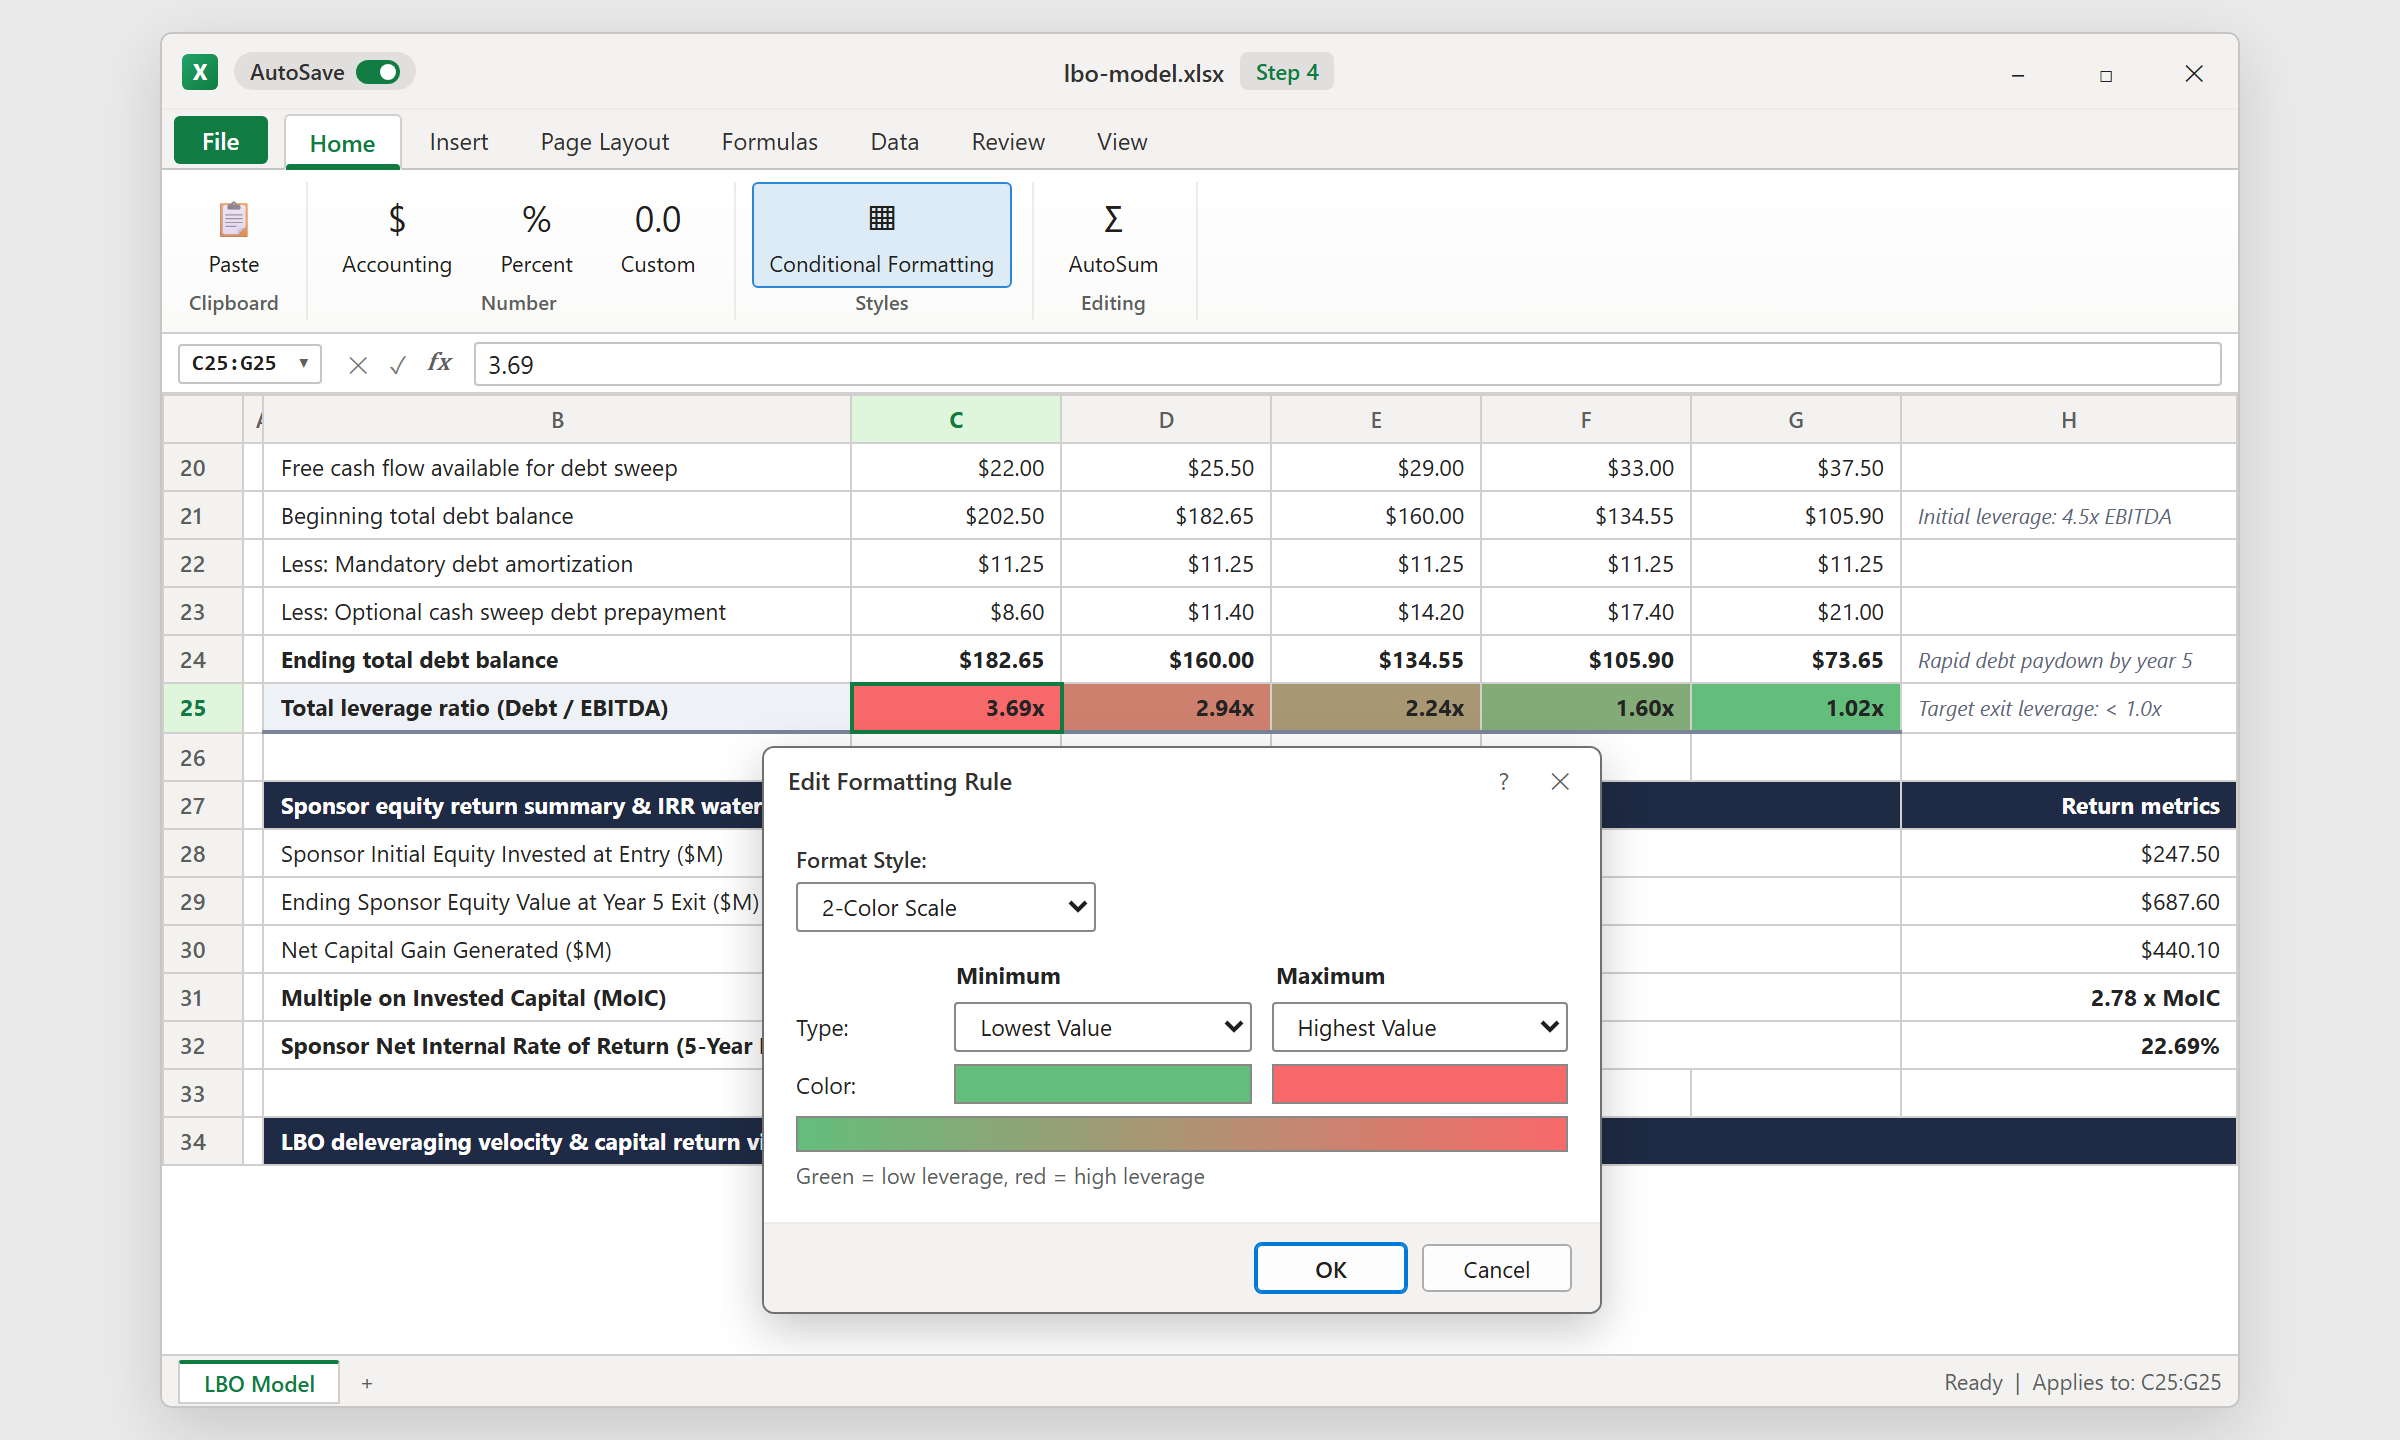
Divide ending debt by that year's EBITDA to get the leverage ratio: 3.69x, 2.94x, 2.24x, 1.60x, and 1.02x. Apply the same custom x format here. In the sample file this row still uses a dollar format, which is a small mistake to fix.
Select the five ratios and open Home > Conditional Formatting > Color Scales. Make the lowest value green and the highest red. The row now fades from red to green, so a lender or committee member sees the deleveraging story at once. Note that year 5 lands at 1.02x, just above the sheet's target of 1.0x.
5Step 5: Calculate MoIC and IRR
At exit, multiply year 5 EBITDA ($72.50M) by the exit multiple (10.5x) to get $761.25M of enterprise value. Subtract remaining debt of $73.65M, and the sponsor's equity is $687.60M. Divide by the $247.50M invested and MoIC is 2.78x.
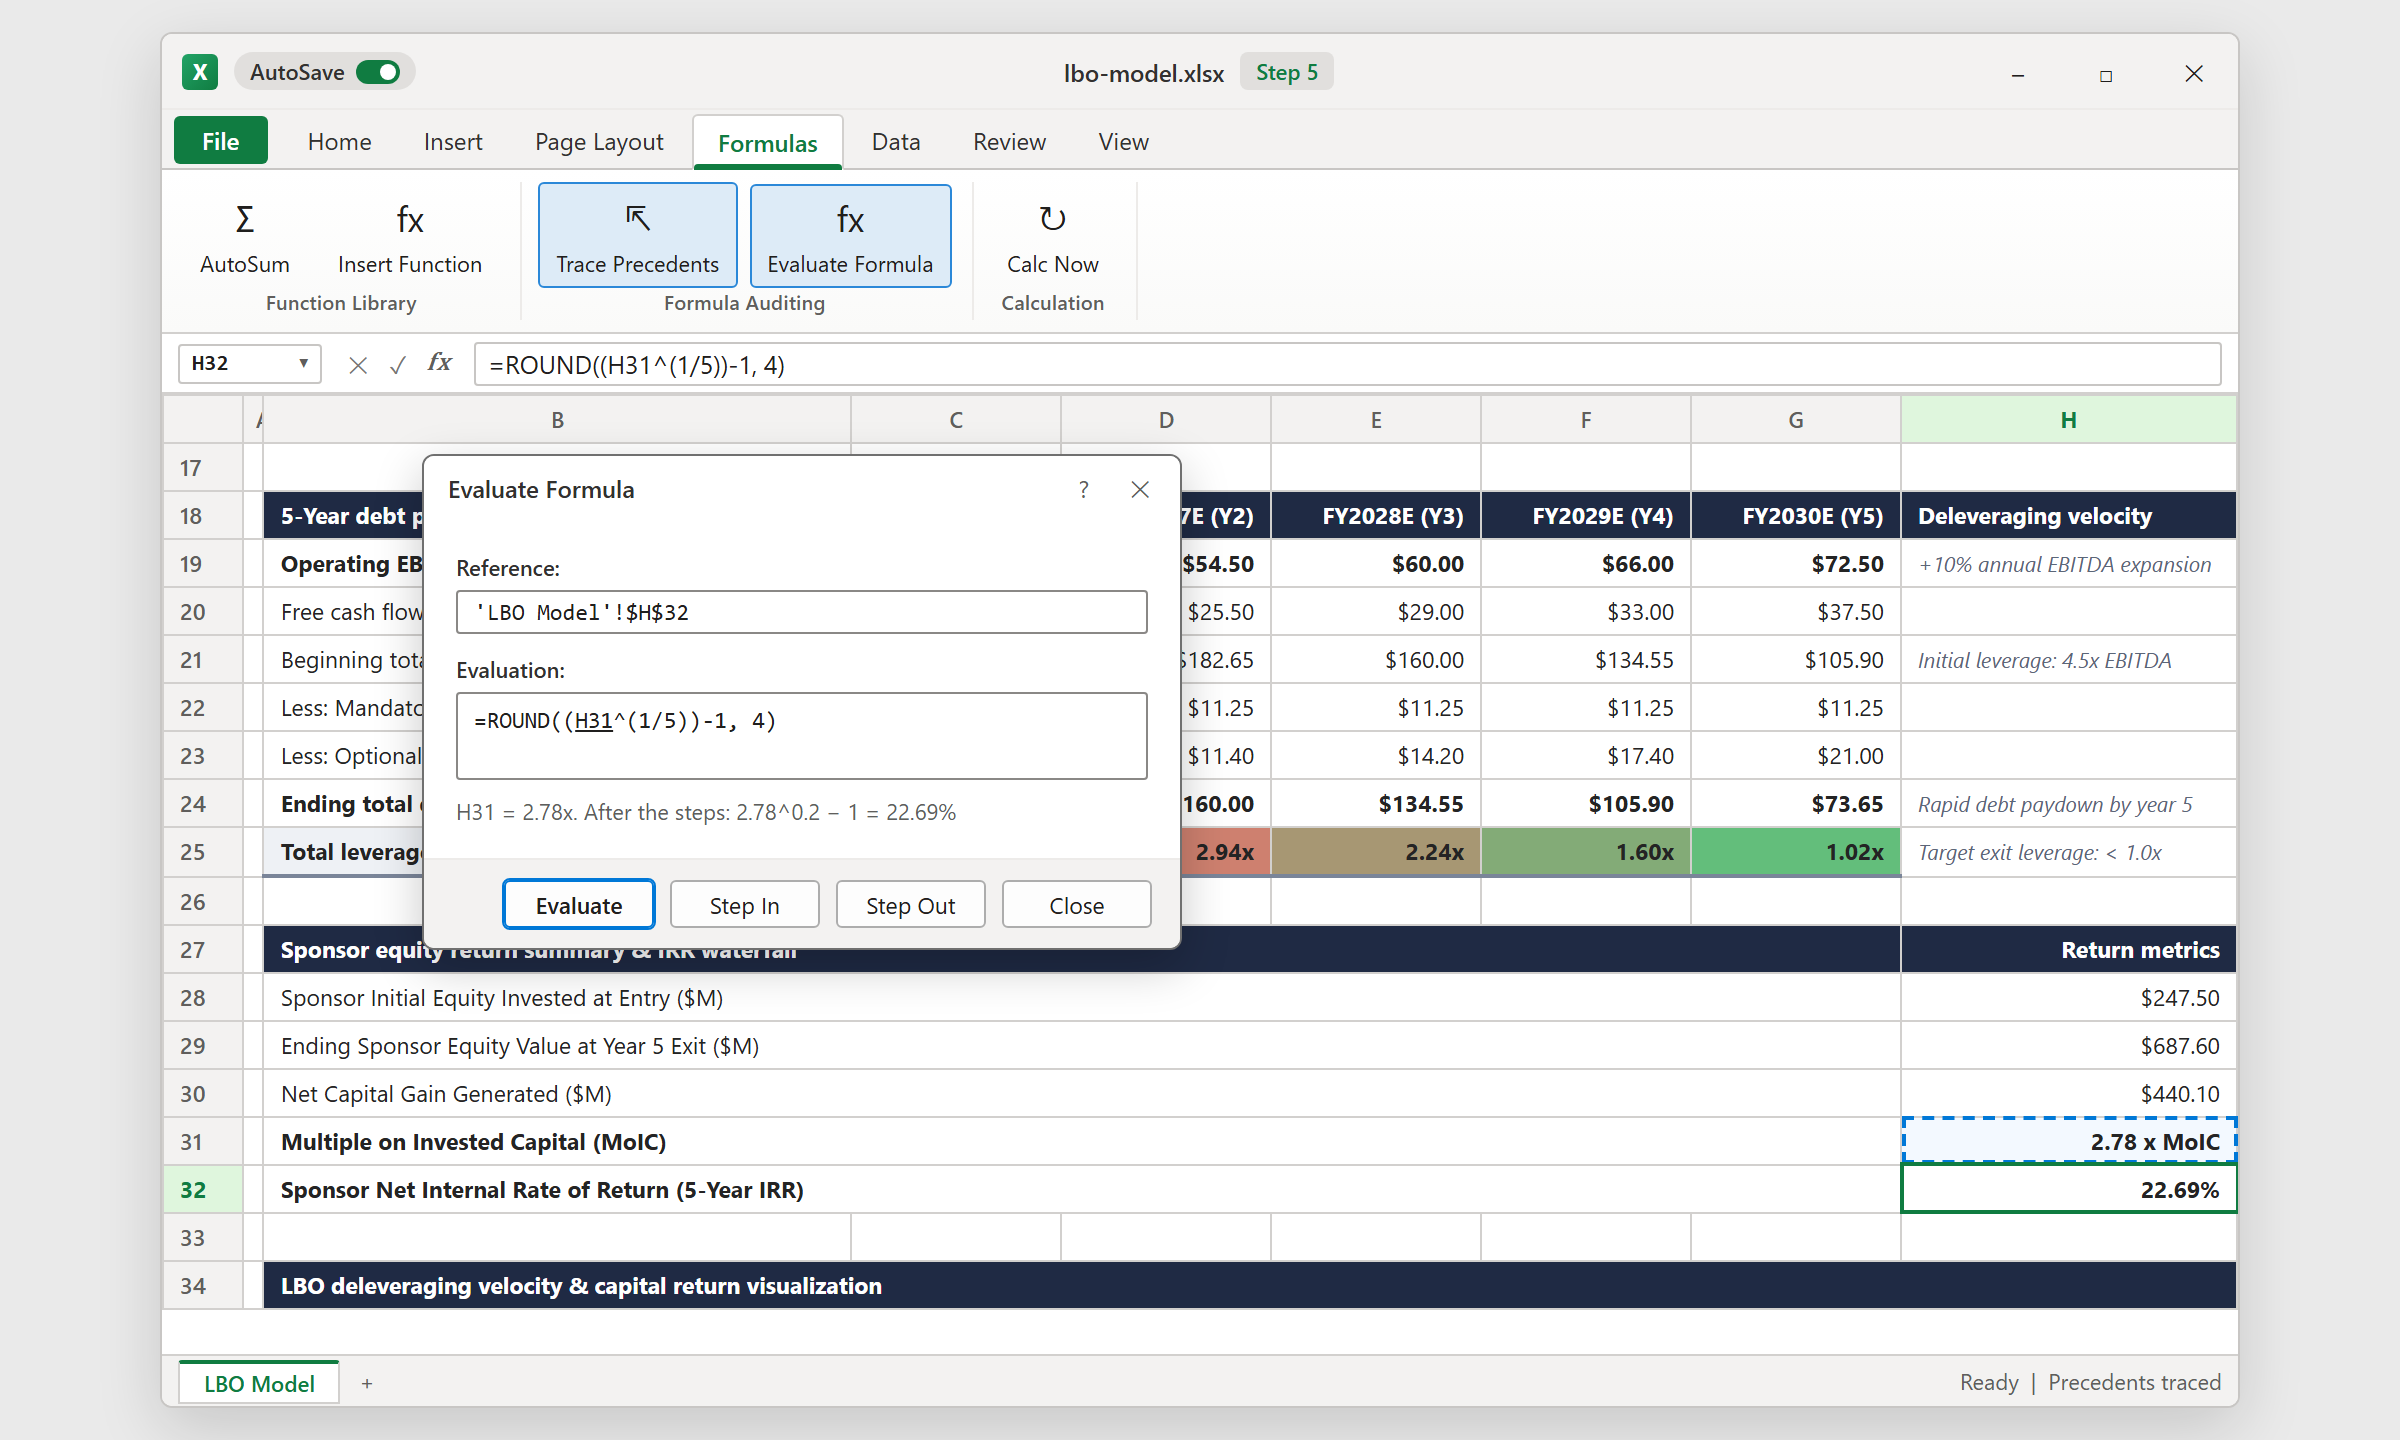
For IRR, raise MoIC to the power of one-fifth and subtract one, which gives 22.69%. Open Formulas > Evaluate Formula to watch Excel work through it. This shortcut only works when there are no dividends before exit. If cash moves in between, list dated cash flows and use IRR or XIRR instead.
Debt Tranche Structuring: Balancing Low-Cost Bank Debt vs Flexible Mezzanine Covenants
- More senior debt lowers the blended interest cost but raises the risk of a covenant breach in a weak year.
- More mezzanine keeps liquidity flexible but costs more and gives the sponsor less return.
- Here, mezzanine is only $22.50M, or 5% of total sources, so the structure leans on cheaper bank debt.
Download the Template

Spreadsheet educator and web developer passionate about hands-on interactive spreadsheet practice.
Related Practical Exercises
Explore more hands-on spreadsheet models with downloadable practice workbooks.
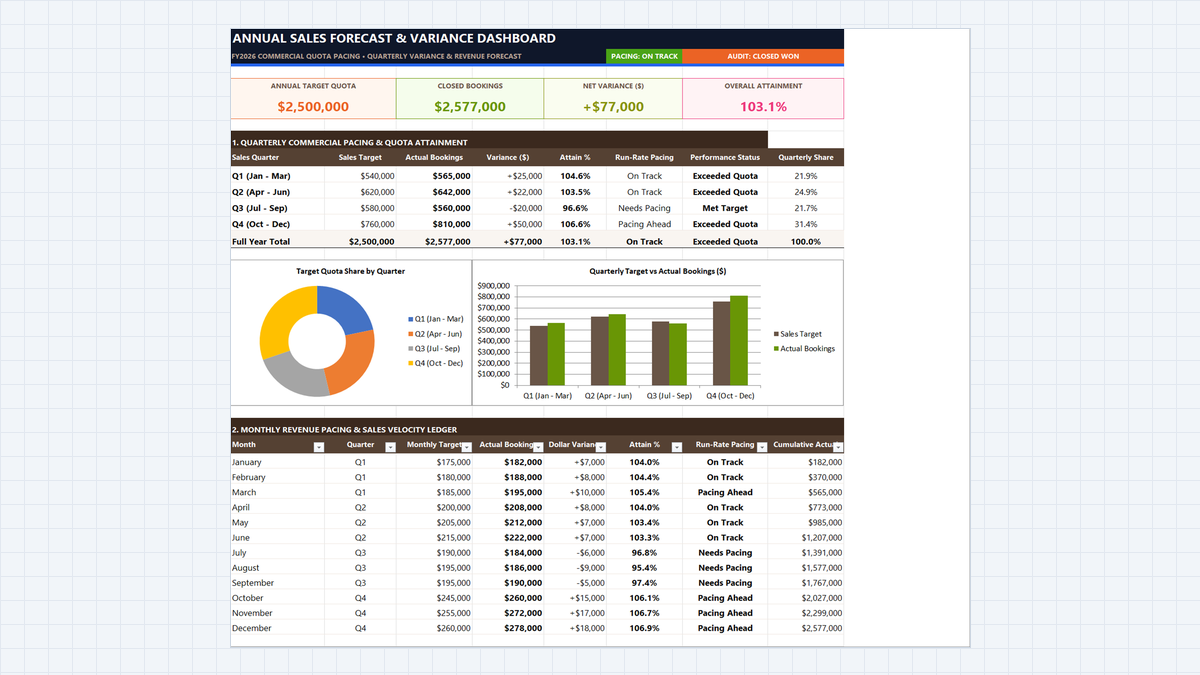 Sales
Sales Forecast Template Excel (Annual Model)
Learn commercial revenue forecasting in Microsoft Excel. Build an annual sales forecasting dashboard featuring quarterly variance calculations, dynamic quota attainment metrics, clustered column comparison charts, and executive pacing scorecards.
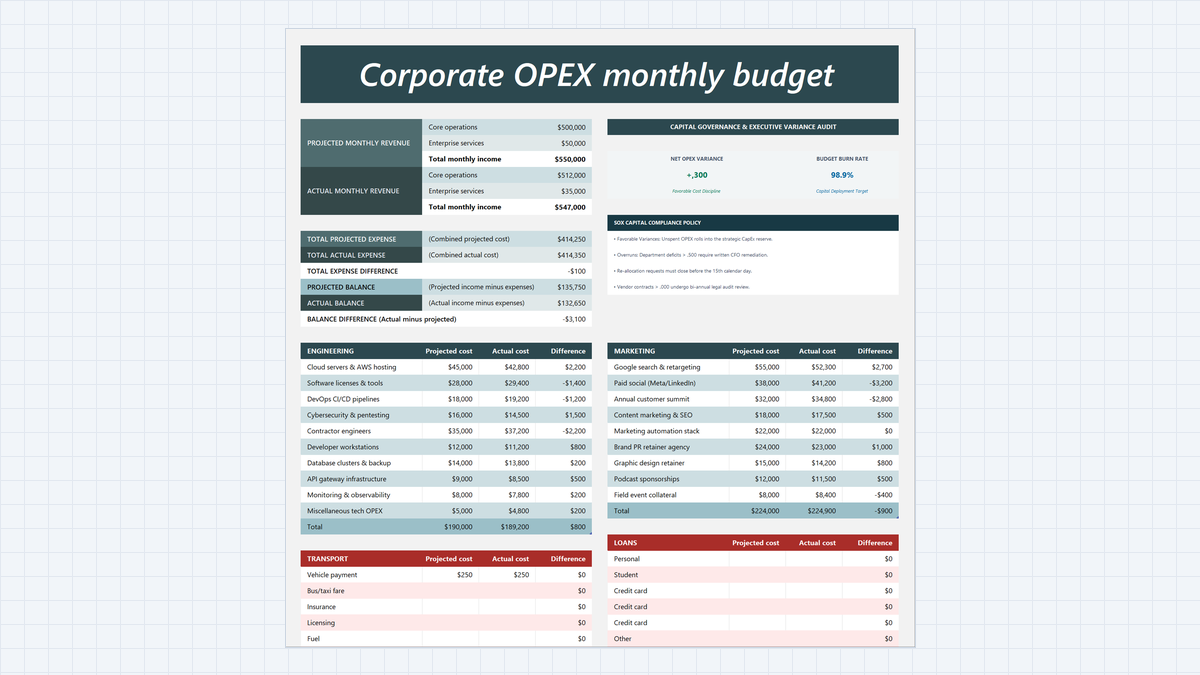 Finance
Budget vs Actual Variance Analysis Excel Template
Build a Budget vs Actual Variance Analysis Excel Template with Engineering and Marketing cost centers, structured variance formulas, filter-proof SUBTOTAL totals, overrun highlights, and an executive SOX compliance card.
 Finance
12-Month Cash Flow Statement Excel Template
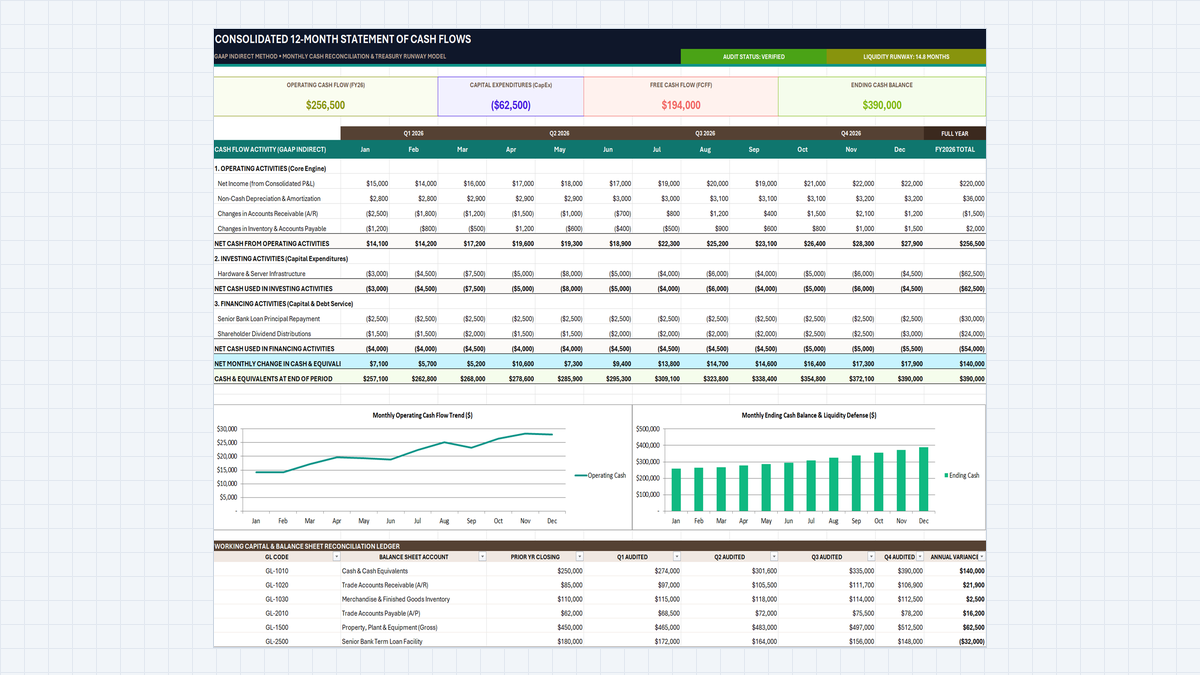
Build a 12-month cash flow statement in Excel with the indirect method: operating, investing and financing sections, a rolling cash balance, a Free Cash Flow to Firm (FCFF) card and a simple low-cash alert.
 Human Resources
Employee Attendance Tracker Excel Template
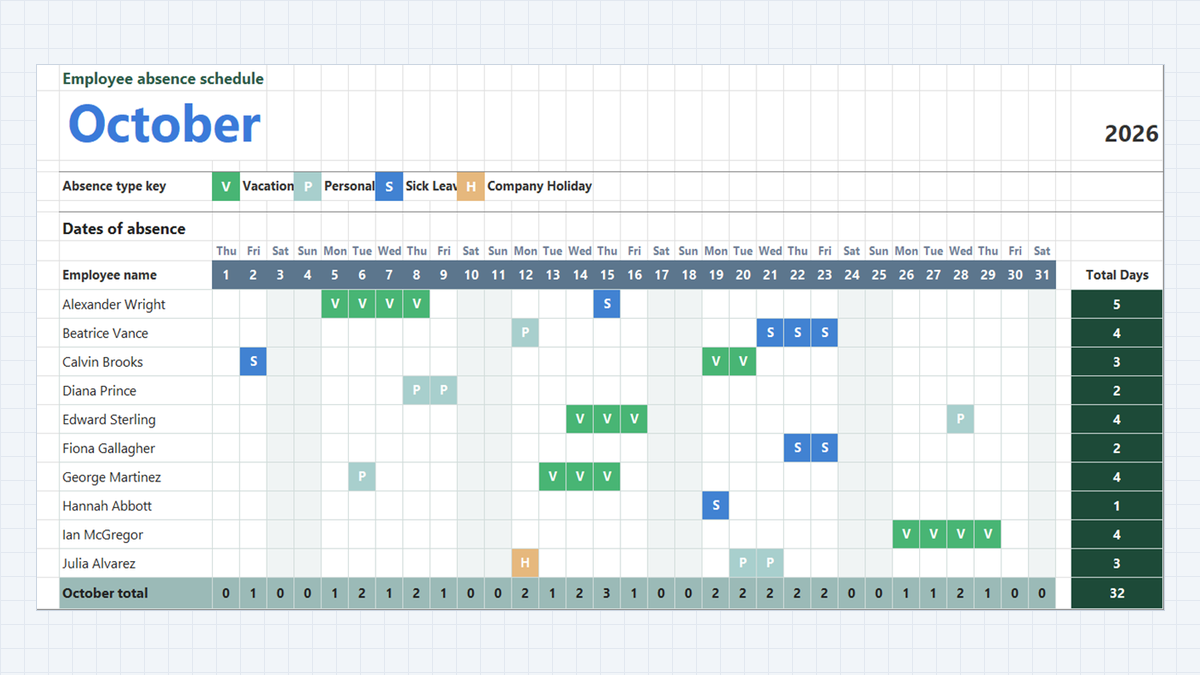
Manage team attendance, vacation days, and sick leave in Microsoft Excel. Build a clean monthly absence schedule featuring dropdown absence keys with Data Validation, automatic color-coded badges via Conditional Formatting, and dynamic attendance totals with COUNTA.
 Human Resources
Employee Payroll Calculator Excel Template
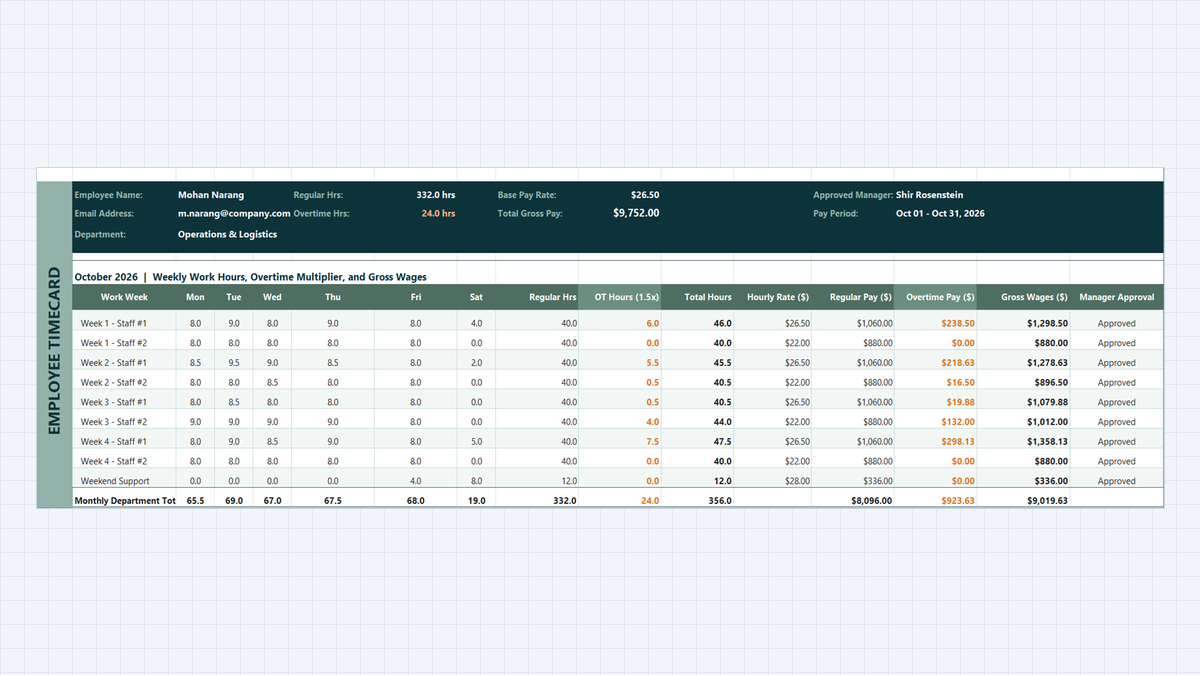
Payroll Friday should not be stressful. Learn how to build an employee payroll calculator in Microsoft Excel that automatically tallies timecards, caps regular hours at 40 with MIN, computes 1.5x overtime with MAX, and locks penny-perfect wages with ROUND.
Discussion
Ask questions, share formula tips, or discuss alternative approaches with fellow spreadsheet builders.
Loading discussion...