What You Will Learn
Five products with Q1 and Q2 revenue. A $500 increase means something different for a product that started at $600 versus one that started at $12,000. Percent change solves this by measuring the movement relative to the starting value.
The formula (column D):
=(C2-B2)/B2
Subtract the old value from the new to find the difference, then divide that difference by the old value. The parentheses matter — they tell Excel to calculate the subtraction first, before dividing.
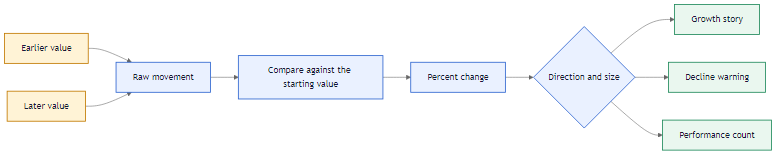
- Positive result = growth. For example, Pro Laptop went from 12,000 to 15,500 — a 29% increase.
- Negative result = decline. Gaming Monitor went from 4,500 to 4,200 — a 7% drop.
- Format column D as a percentage so 0.25 displays as 25%.
The summary:
- B9:
=SUM(B2:B6) — total Q1 revenue across all products.
- B10:
=COUNTIF(D2:D6,">0.2") — counts products with growth over 20%. The condition ">0.2" means greater than 20% — three products pass this threshold.
 Percent change makes growth comparable across products of different sizes.
Alternative: Compact Formula
Some analysts write percent change as =C2/B2-1 — divide the new by the old, then subtract 1. It returns the same result and is faster to type, but harder to read for beginners.
Alternative: Absolute Change with ABS
If you only care about the size of the change (not whether it was up or down), wrap the difference in ABS:
=ABS(C2-B2)/B2
This treats a 7% drop the same as a 7% increase. Useful for variance dashboards where direction is handled separately.
The COUNTIF in B10 uses ">0.2" as the condition — this means greater than 0.2 (20%). The value is written as a decimal because COUNTIF compares against the raw stored number, not the formatted percentage. If you wrote ">20%" instead, it would not work because Excel treats that as text, not a numeric comparison.
Percent change breaks if the old value is zero (division by zero). In real reports, handle this with IFERROR or check for zero before calculating. For this dataset, all starting values are positive, so it is safe.
Use =(C2-B2)/B2 in D2:D6 for percent change, format as percentage. Then use SUM in B9 for total Q1 revenue and COUNTIF in B10 for products with growth over 20%.