What You Will Learn
Five participants. Each has weight in kg (column B) and height in meters (column C). You need their BMI in column D and a health category in column E.
BMI = weight / height². In Excel, that is:
=B2/(C2^2)
The ^2 squares the height. The parentheses matter — without them, Excel would divide weight by height first, then square the wrong result.
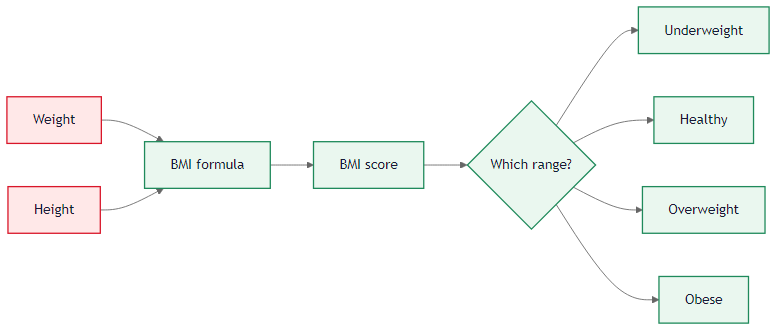 Weight divided by height squared gives BMI. IFS turns the score into a category.
Once the BMI is calculated, categorize it with these thresholds:
| BMI Range | Category |
|---|
| Under 18.5 | Underweight |
| 18.5 to 24.9 | Healthy |
| 25 to 29.9 | Overweight |
| 30 or higher | Obese |
The IFS formula for column E checks these thresholds in order — the first matching condition wins:
=IFS(D2<18.5,"Underweight",D2<25,"Healthy",D2<30,"Overweight",TRUE,"Obese")
The TRUE() at the end acts as a catch-all. If the BMI is 30 or higher, none of the earlier conditions match, so TRUE returns "Obese". This is the IFS equivalent of an ELSE clause in nested IF formulas.
Alice has a BMI of 23.03 (Healthy). Bob is 28.68 (Overweight). Charlie is 16.98 (Underweight). Diana is 32.32 (Obese). Ethan is 22.72 (Healthy). Two participants are Healthy.
The order of conditions matters. If "D2<30" came before "D2<25", then a BMI of 22 would match the "<30" check first and show "Overweight" instead of "Healthy". Always put the narrowest range first.
The audit formulas:
- B9:
=COUNTA(A2:A6) — total participants.
- B10:
=COUNTIF(E2:E6,"Healthy") — Healthy count.
Alternative: POWER Instead of ^
If you prefer function names over operators, POWER does the same math:
=B2/POWER(C2,2)
Both are correct. The ^ version is shorter; POWER is more explicit. The parentheses around (C2^2) are essential — without them, Excel would calculate B2/C2^2 as (B2/C2)^2 due to operator precedence, squaring the division result instead of just the height.
The categories used here are standard WHO BMI ranges. If you are working with different health guidelines (such as adjusted ranges for older adults or specific populations), the IFS thresholds can be updated easily without changing the structure of the formula.
This formula assumes height is in meters. If your data uses centimeters (168 instead of 1.68), divide height by 100 first or the BMI will be wildly wrong.
Use =B2/(C2^2) in D2:D6 for BMI, then =IFS(...) in E2:E6 for categories. Use COUNTA in B9 and COUNTIF in B10 for Healthy count.