Calculating student grades manually at the end of the semester is slow and prone to errors. With homework, quizzes, midterms, group projects, and final exams carrying different weights, a simple arithmetic average gives the wrong result.
A weighted gradebook handles the math automatically, ensuring students always know their current standing. In this tutorial, we build a Student Gradebook & GPA Calculator in Microsoft Excel. You will learn how to apply syllabus weights, convert percentage scores into letter grades with XLOOKUP, and summarize cohort performance with academic scorecards.
Gradebook Structure and Syllabus Weights
A dependable course gradebook separates syllabus component weights from raw student exam marks. In our workbook, row 9 defines the grading breakdown: Homework (20%), Quizzes (15%), Midterm (25%), Group Projects (20%), and Final Exam (20%).
Rows 13 through 20 track individual student grades across columns B through K, recording student names, IDs, category marks, weighted totals, 4.0 scale GPAs, letter grades, and academic honors status.
Review the gradebook data schema below before entering student scores:
| Col | Field Name | Type | Format | Operational Role |
|---|---|---|---|---|
| B | Student Name & ID | Text | General | Enrolled student full name and university ID number. |
| C | HW (20%) | Numeric | #,##0 | Composite homework assignment average out of 100. |
| D | Quiz (15%) | Numeric | #,##0 | Weekly lecture quiz average out of 100. |
| E | Midterm (25%) | Numeric | #,##0 | Proctored midterm examination score. |
| F | Project (20%) | Numeric | #,##0 | Term engineering project evaluation mark. |
| G | Final Exam (20%) | Numeric | #,##0 | Comprehensive semester final examination score. |
| H | Total % | Formula (Percentage) | 0.0% | Syllabus weighted composite course grade: =C13*0.2+D13*0.15+E13*0.25+F13*0.2+G13*0.2. |
| I | GPA (4.0) | Decimal | 0.00 | Equivalent quality grade point on standard 4.0 academic scale. |
| J | Grade | Text (Lookup) | General | Official letter grade (A, B+, B, D, F). |
| K | Academic Status | Text | General | Student status badge (Honors, Passing, Academic Warning). |
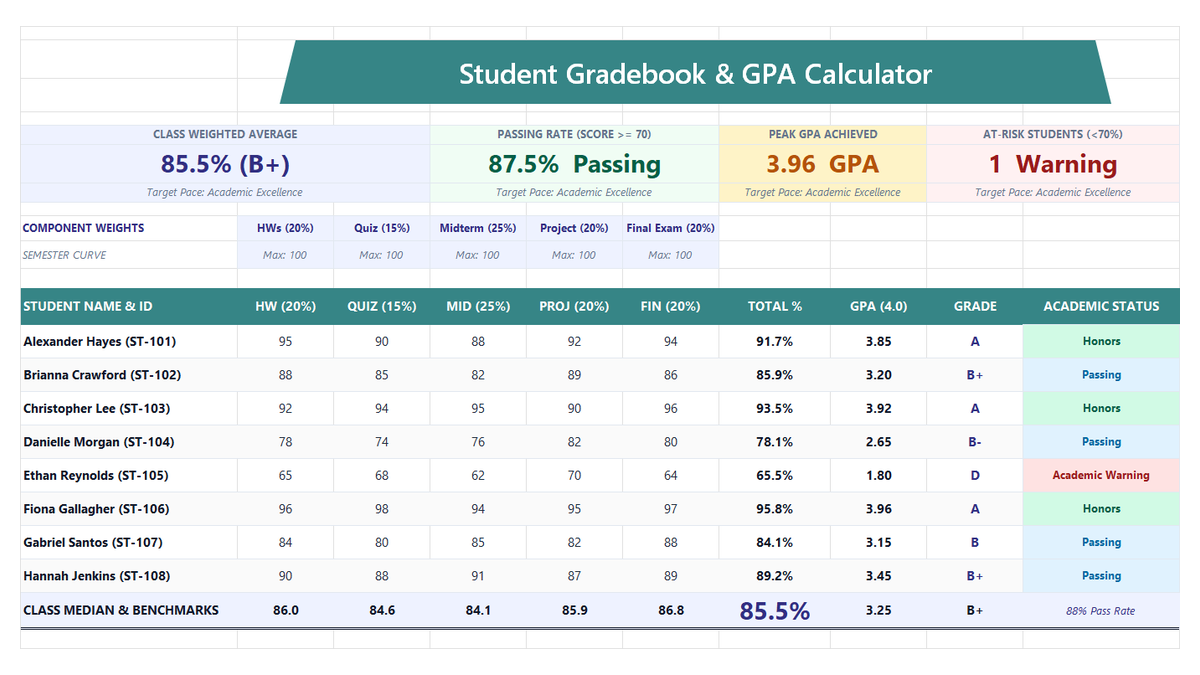
Workbook Blueprint: The Student Gradebook & GPA Calculator model showing syllabus weights, student rosters, and executive cohort scorecards.
With our grading matrix layout ready, let us set up the weighted formulas and letter grade conversions.
Setting Up Weighted Grade Formulas, Letter Lookups, and Class Rollups
Setting up this calculator involves three key steps: writing the syllabus weight equation, automating letter grade conversions using the XLOOKUP function dialog, and auditing cohort benchmark averages.
Follow each step below:
1Step 1: Calculate Weighted Course Score
Because assignments carry different values in the syllabus, each category score must be multiplied by its specific weight.
In cell H13, calculate Alexander Hayes's composite score: =C13*0.2 + D13*0.15 + E13*0.25 + F13*0.2 + G13*0.2.
With strong marks across homework (95), quizzes (90), midterm (88), project (92), and final exam (94), cell H13 produces a composite final grade of 91.7%.
Copy this formula down through row 20 to compute course scores for every student in the cohort.
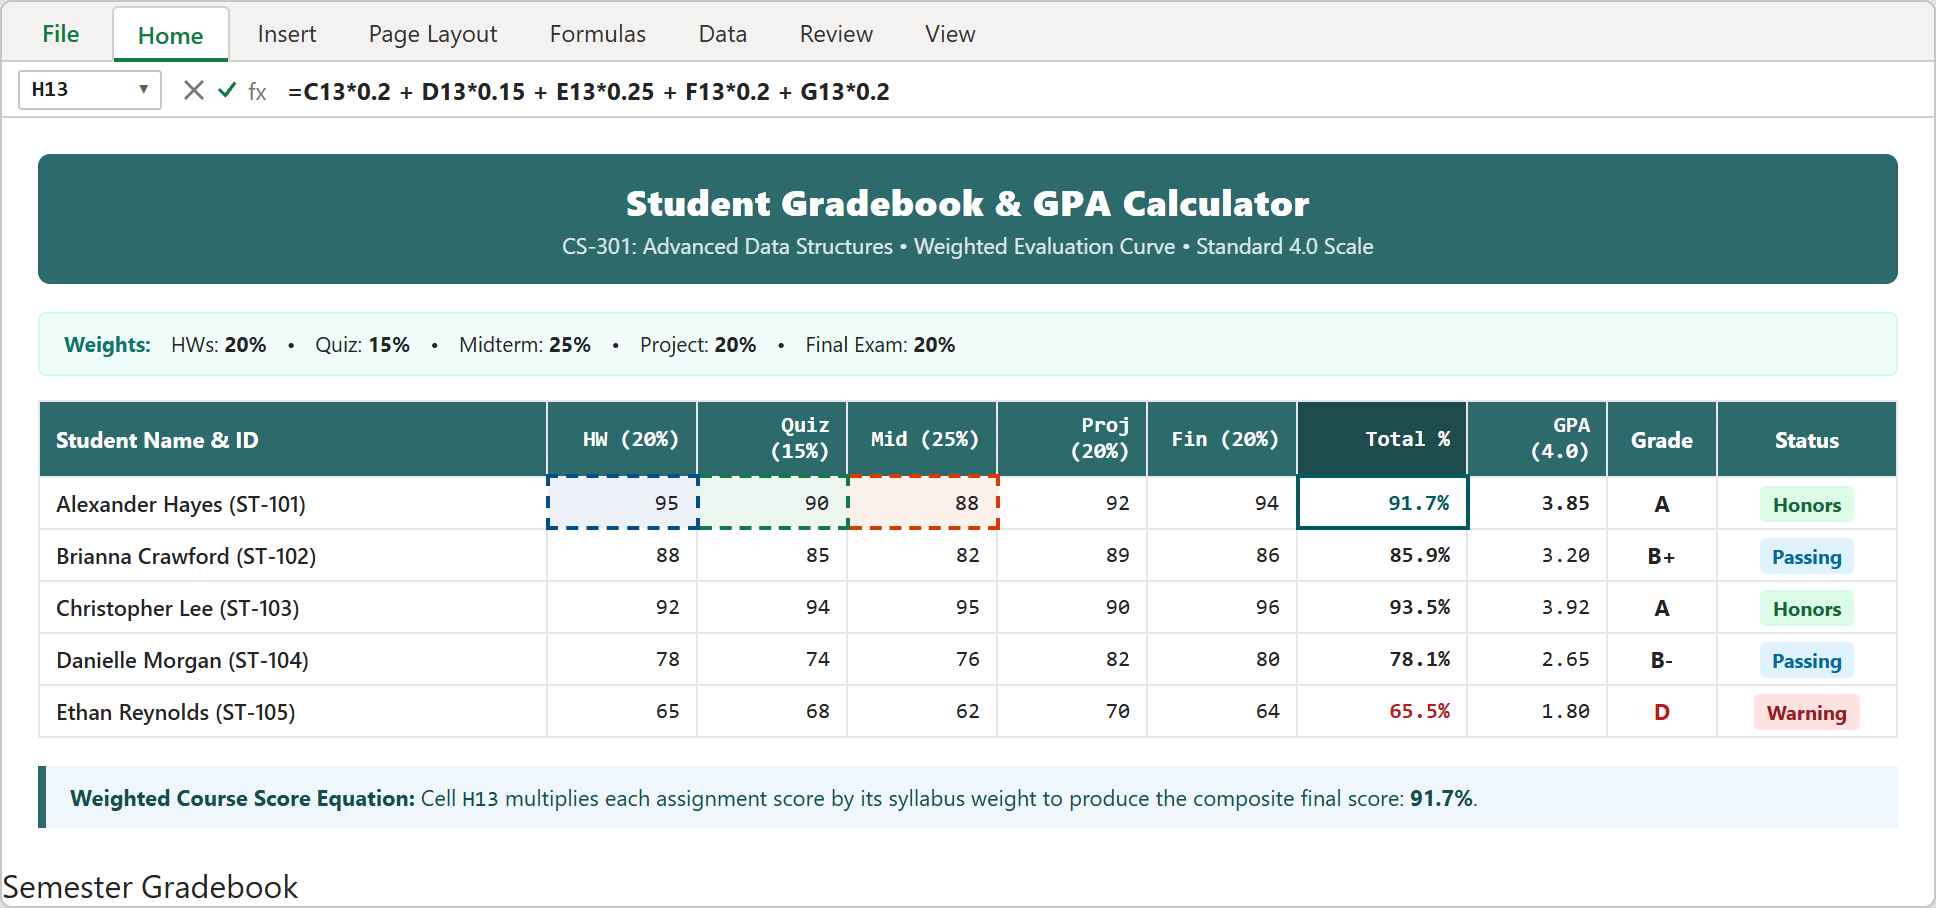
Step 1: Formula bar showing the weighted sum equation multiplying student assignment marks by syllabus weights in cell H13.
2Step 2: Assign Letter Grades via XLOOKUP Dialog Box
Instead of writing long nested IF statements, use XLOOKUP with approximate matching mode to translate percentages into letter grades.
Select cell J13 and click the fx button on the formula bar to open the Function Arguments dialog for XLOOKUP.
Set Lookup_value to H13, Lookup_array to GradeScale!$A$2:$A$12, Return_array to GradeScale!$B$2:$B$12, If_not_found to "F", and Match_mode to -1 (exact match or next smaller item).
Click OK. Alexander's 91.7% evaluates cleanly to an A grade, while Ethan Reynolds's 65.5% automatically maps to a D.
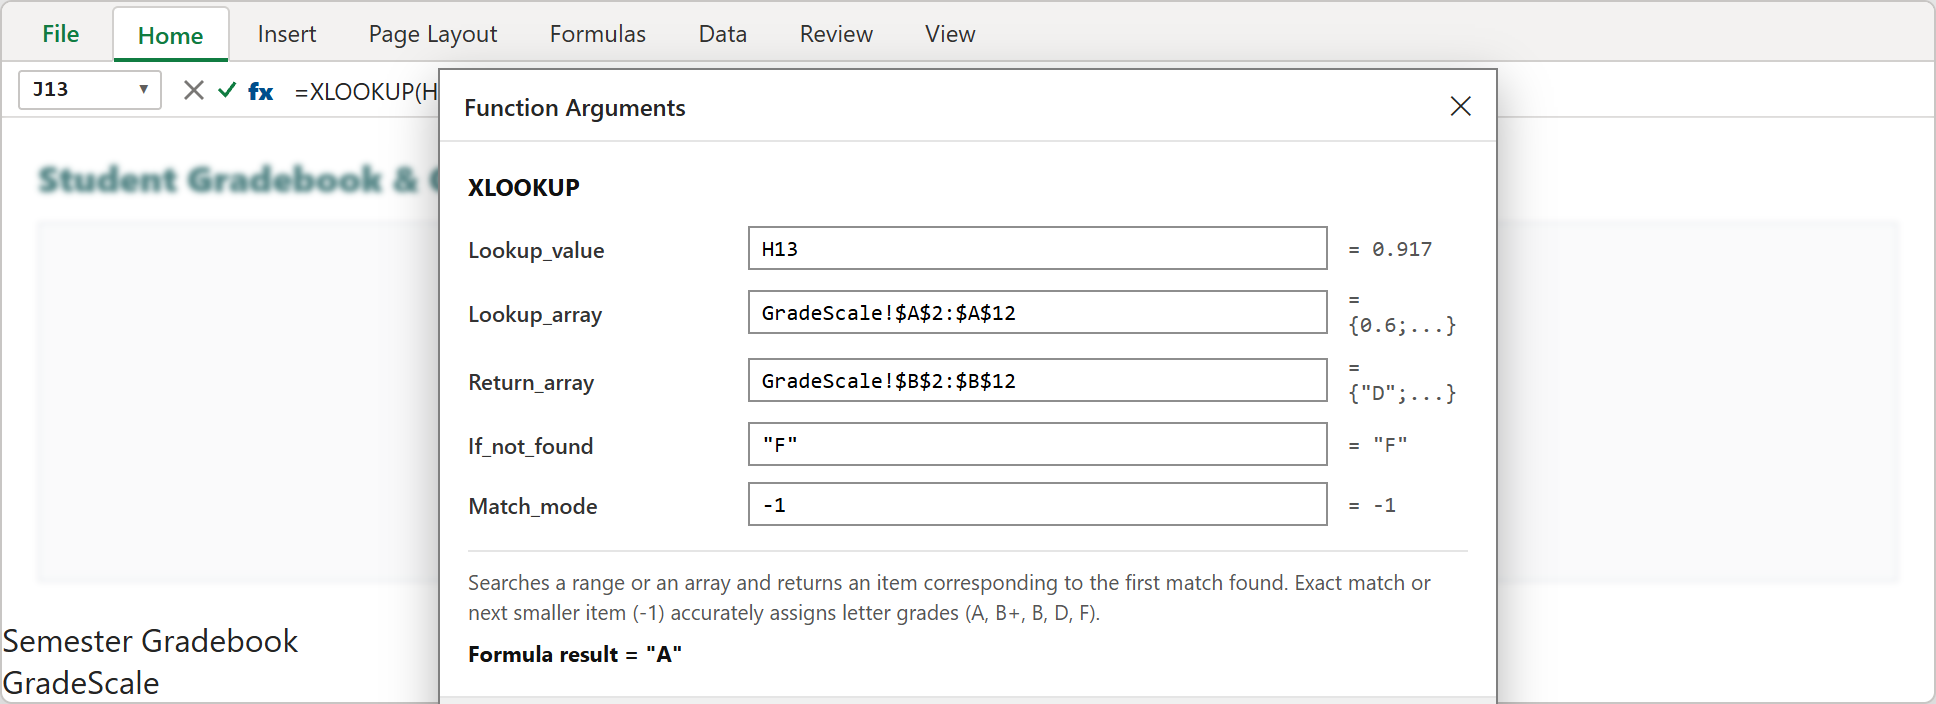
Step 2: Excel Function Arguments dialog configuring XLOOKUP with approximate match mode (-1) for academic letter grade assignment.
3Step 3: Executive Academic Performance Matrix and Cohort KPIs
Now examine the completed executive gradebook dashboard.
Top KPI cards summarize cohort health: Class Weighted Average (85.5% / B+), Passing Rate (87.5% Passing) with 7 of 8 students cleared, Peak GPA (3.96 GPA) achieved by Fiona Gallagher, and At-Risk Students (1 Warning) highlighting where academic tutoring is needed.
The bottom summary row computes median benchmarks across each assessment, showing that students performed strongest on the Final Exam (86.8 median).
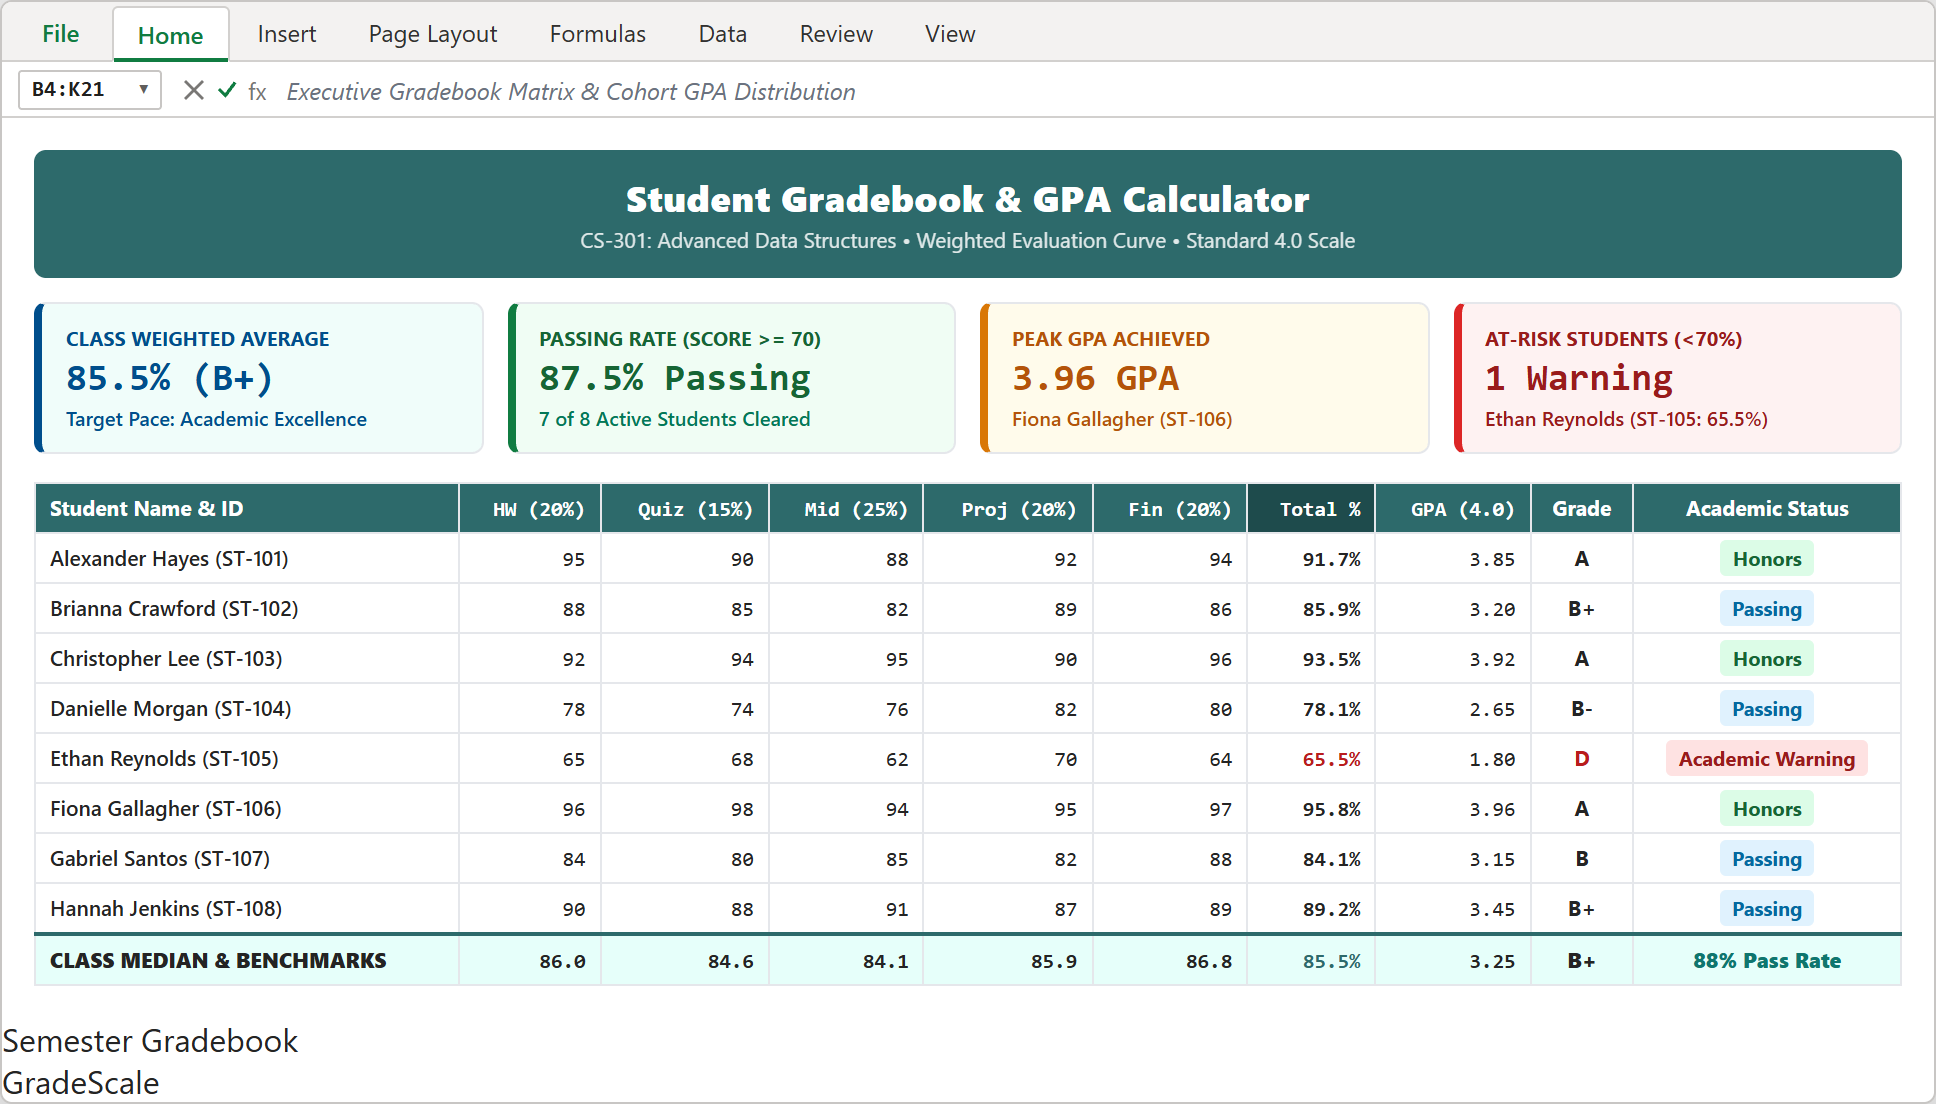
Step 3: Completed gradebook view showing top cohort KPI cards, student grades, letter badges, and benchmark medians.
Academic Grading Standards and Syllabus Governance
To ensure grading fairness and compliance with university policies, maintain these three core standards:
1. Keep Weights Equal to 100%: Always sum your component weights in row 9. If weights do not equal exactly 1.0 (100%), overall grade calculations will be skewed.
2. Audit Borderline Scores: Use conditional formatting to highlight scores within 0.5% of grade boundaries (such as 89.5% for an A-) for manual review.
3. Protect Lookup Tables: Keep your GradeScale tab locked so grade boundary thresholds cannot be accidentally edited by teaching assistants.
Conclusion and Next Steps
You have built a reliable Student Gradebook & GPA Calculator in Microsoft Excel. With automated syllabus weighting, instant letter lookups, and clear cohort KPI scorecards, managing semester grades is fast and accurate.
Download the template below to plug in your own syllabus criteria, or practice modifying formulas directly inside our interactive spreadsheet playground.

Spreadsheet educator and web developer passionate about hands-on interactive spreadsheet practice.
Related Practical Exercises
Explore more hands-on spreadsheet models with downloadable practice workbooks.
 Operations
Vendor Performance Scorecard Excel Template
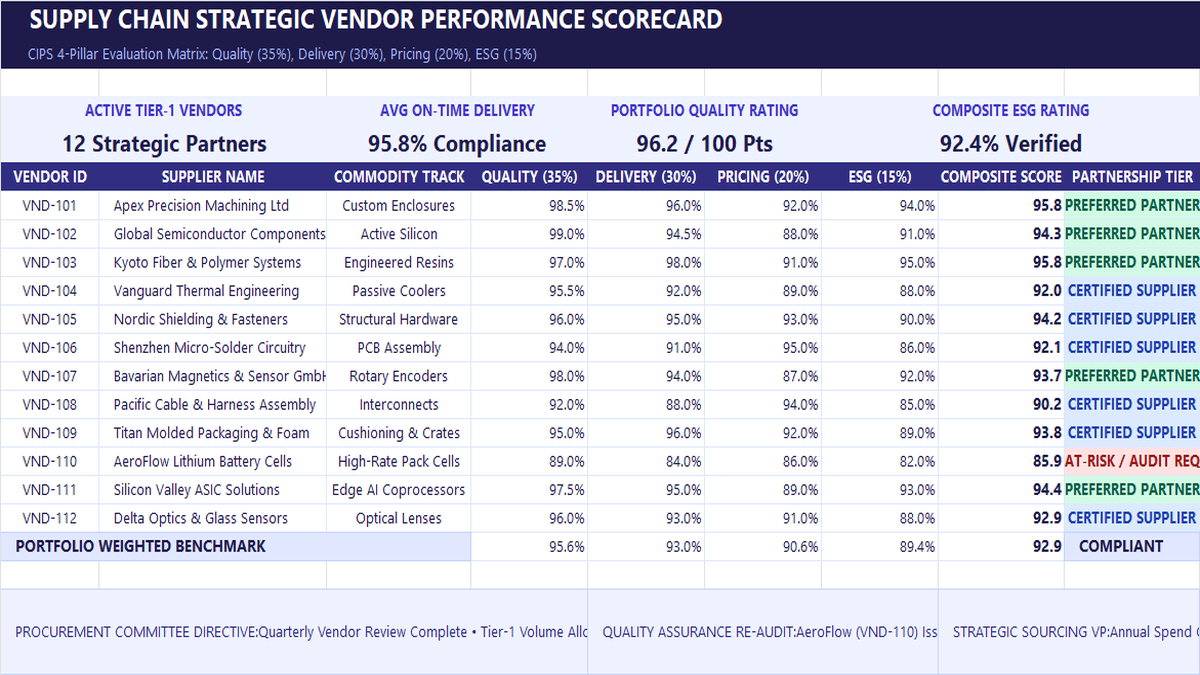
Learn strategic vendor evaluation in Microsoft Excel. Build a CIPS-compliant 4-pillar scorecard weighting Quality (35%), Delivery (30%), Pricing (20%), and ESG (15%). Automate weighted composite scores with SUMPRODUCT, calculate portfolio OTIF delivery, and establish tier-based purchase order allocations.
 Productivity
Wedding Budget Tracker Excel Template
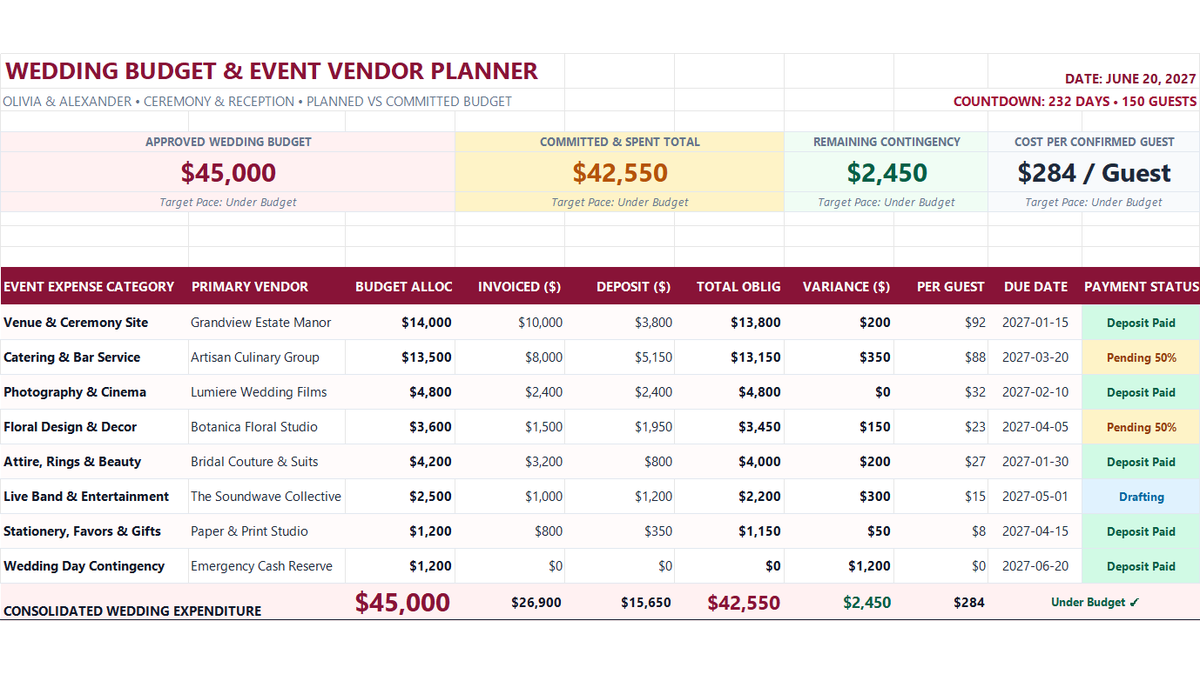
Learn how to build a wedding budget expense tracker in Microsoft Excel featuring single-sheet architecture, vendor deposit schedules, cost-per-guest formulas, and contingency reserve scorecards.
 Sales
Annual Sales Forecasting Model Excel Template
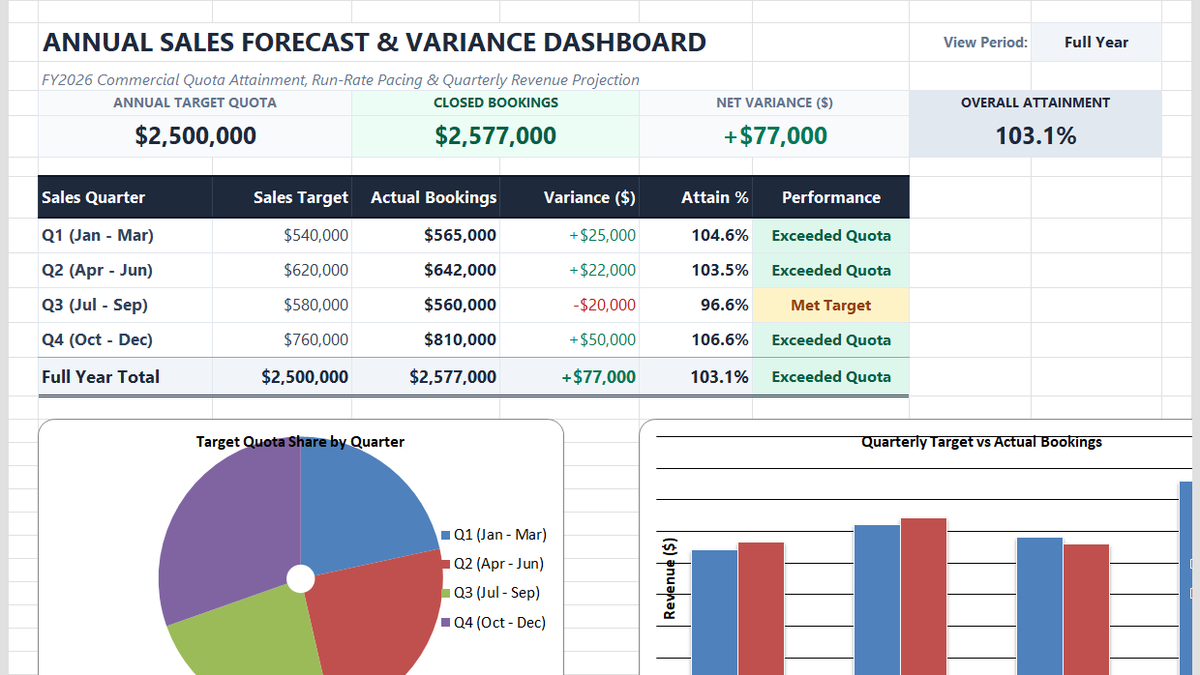
Learn commercial revenue forecasting in Microsoft Excel. Build an annual sales forecasting dashboard featuring quarterly variance calculations, dynamic quota attainment metrics, clustered column comparison charts, and executive pacing scorecards.
 Finance
Budget vs Actual Variance Analysis Excel Template
Learn how to build a corporate OPEX budget vs actual variance model in Microsoft Excel featuring departmental cost ledgers, automated dollar variances, in-cell data bars, and executive reconciliation scorecards.
 Finance
Daily Cash Book Ledger Excel Template
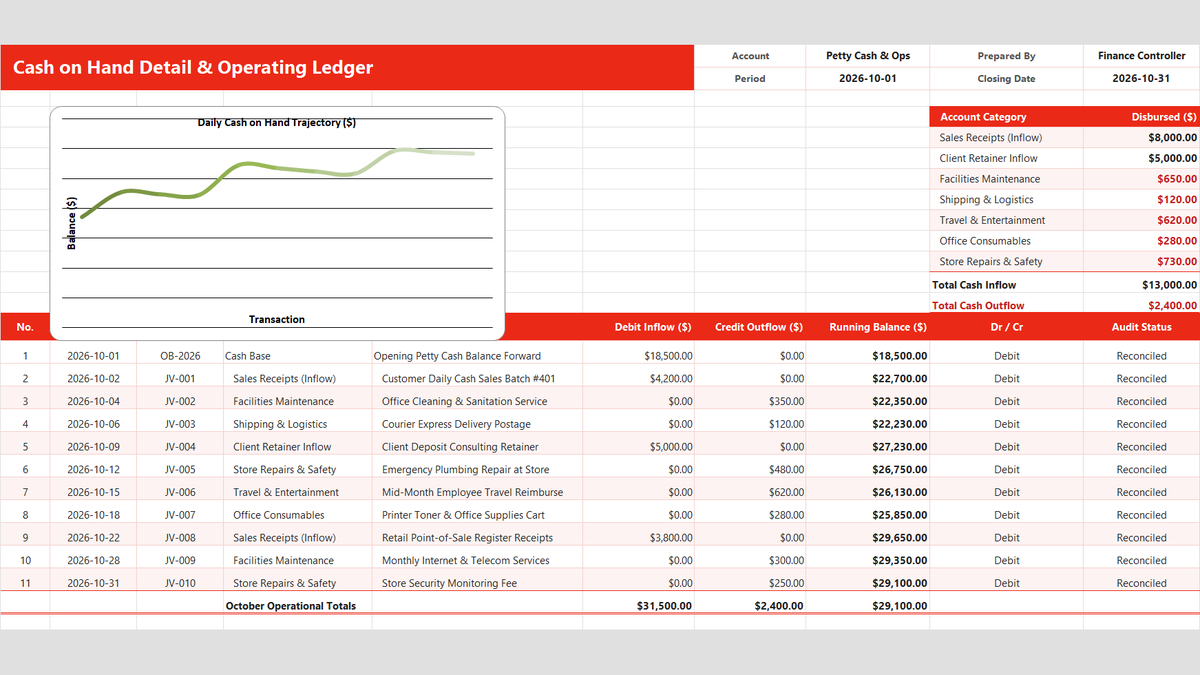
Keep track of physical cash, register receipts, and petty cash disbursements in Microsoft Excel. Build a daily cash book featuring category dropdowns with Data Validation, live running balance calculations, negative cash overdraft alerts, and month-end category expense rollups.
Discussion
Ask questions, share formula tips, or discuss alternative approaches with fellow spreadsheet builders.
Loading discussion...