Managing a sales team without an objective quota tracker is risky. Without real-time attainment numbers, managers often realize reps are falling behind only at the very end of the quarter.
A transparent sales tracker keeps everyone focused on revenue goals, pipeline coverage, and win rates. In this tutorial, we build a Sales Rep Performance Tracker in Microsoft Excel. You will learn how to calculate quota attainment percentages, highlight performance tiers with conditional formatting, and summarize team-wide velocity in an executive scorecard.
Sales Ledger Layout and Performance Metrics
An effective sales tracker balances individual accountability with team health metrics. Our single-sheet tracker organizes team performance into a clear table.
Rows 18 through 24 track individual account executives (Marcus Vance, Sarah Jenkins, Chloe Bennett, David Chen, Sophia Loren, Mei Ling, and Elena Rostova). Row 25 calculates team totals and averages. Columns C through L track quota assignments, closed revenue, win rates, and performance tiers.
Review the operational data schema below:
| Col | Field Name | Type | Format | Operational Role |
|---|---|---|---|---|
| C | Sales Rep | Text | General | Full name of assigned Account Executive. |
| D | Quota Assigned ($) | Currency | $#,##0 | Monthly baseline quota assigned by sales leadership. |
| E | Revenue Achieved ($) | Currency | $#,##0 | Total closed-won bookings credited to rep. |
| F | Attainment Rate (%) | Formula (Percentage) | 0.0% | Quota progress ratio: =E18/D18. |
| G | Deals Won | Integer | #,##0 | Count of successfully signed commercial contracts. |
| H | Pipeline Value ($) | Currency | $#,##0 | Current qualified active opportunity pipeline. |
| I | Avg Deal Size ($) | Formula (Currency) | $#,##0 | Average transaction value: =E18/G18. |
| J | Sales Cycle (Days) | Integer | #,##0 | Average elapsed days from first discovery to contract signature. |
| K | Win Rate (%) | Percentage | 0% | Ratio of won opportunities against closed-lost opportunities. |
| L | Performance Tier | Text (Formula) | General | Classification status (Top Performer, On Track, Needs Focus). |
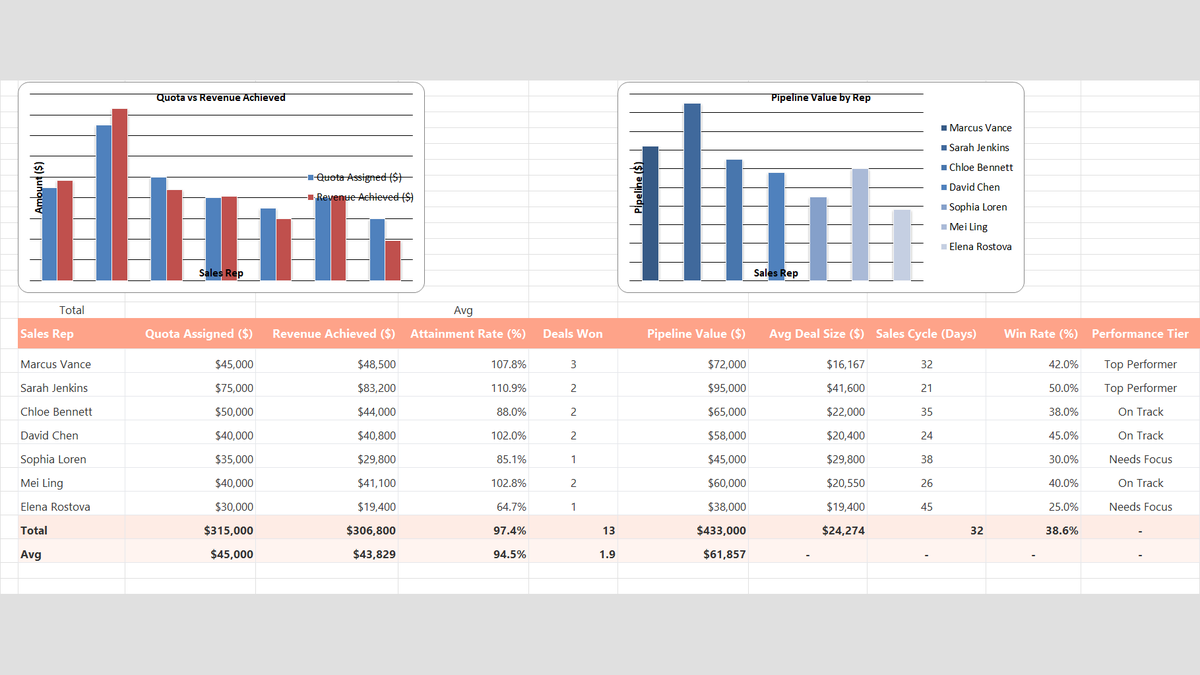
Workbook Blueprint: The Sales Rep Performance Tracker architecture displaying quota benchmarks, revenue closed, and executive scorecards.
With our team columns ready, let us set up the core attainment math and conditional status badges.
Setting Up Attainment Formulas, Conditional Badges, and Team Dashboards
Setting up this model involves three concrete steps: calculating quota progress with a division formula, creating color-coded performance badges using the Conditional Formatting Rules Manager, and auditing team totals.
Follow each step below:
1Step 1: Calculate Quota Attainment Percentage
Quota attainment measures what percentage of the assigned revenue target a rep has successfully closed.
In cell F18, calculate Marcus Vance's attainment: =E18/D18.
With $48,500 in revenue achieved against a $45,000 target, cell F18 evaluates to 107.8%.
Copy this formula down through row 24. Sarah Jenkins leads the team at 110.9% ($83,200 closed), while Elena Rostova sits at 64.7% ($19,400 closed).
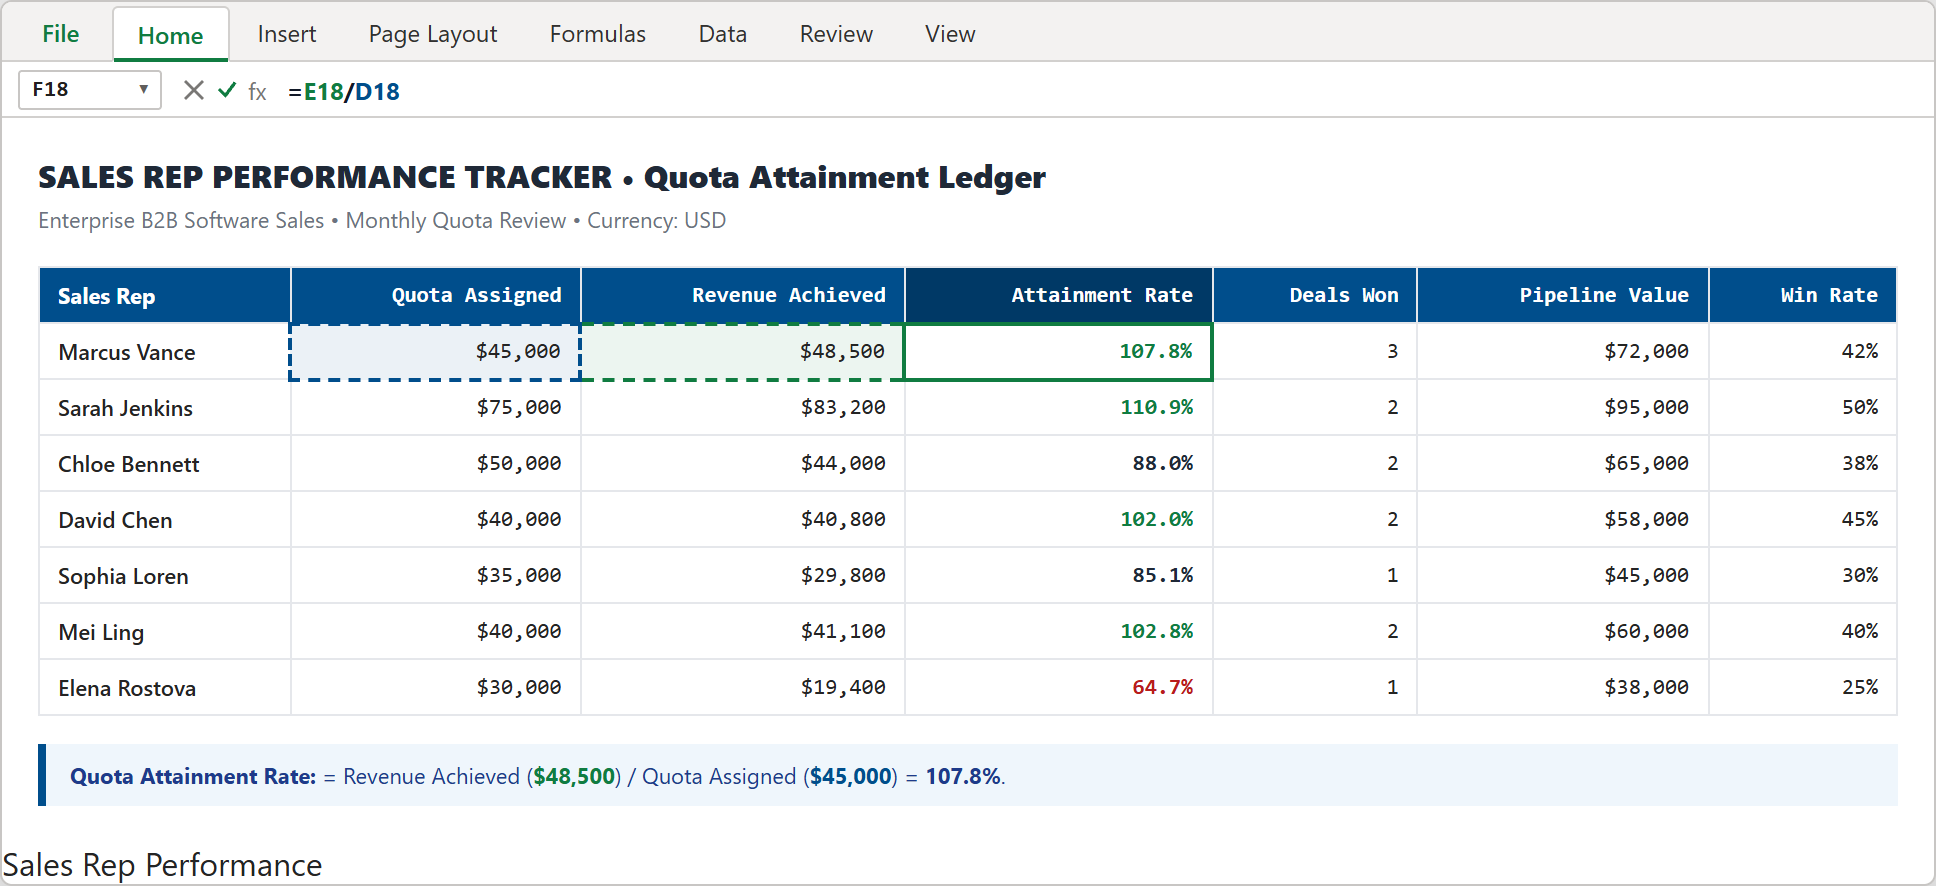
Step 1: Formula bar showing =E18/D18 dividing revenue achieved by assigned quota in cell F18.
2Step 2: Add Conditional Formatting Rules for Rep Badges
To quickly see which reps are excelling and which need coaching, set up a 3-tier conditional formatting rule.
Select range F18:F24, go to Home > Conditional Formatting > Manage Rules, and create three distinct conditions:
1. Top Performer (Green): Cell Value >= 1.0 (soft green fill #C6EFCE with dark green text #006100).
2. On Track (Yellow): Cell Value between 0.8 and 0.999 (soft yellow fill #FFEB9C with dark brown text #9C6500).
3. Needs Focus (Red): Cell Value < 0.8 (soft red fill #FFC7CE with dark red text #9C0006).
Click Apply and OK. The ledger instantly highlights reps who have hit their targets and signals where pipeline assistance is needed.
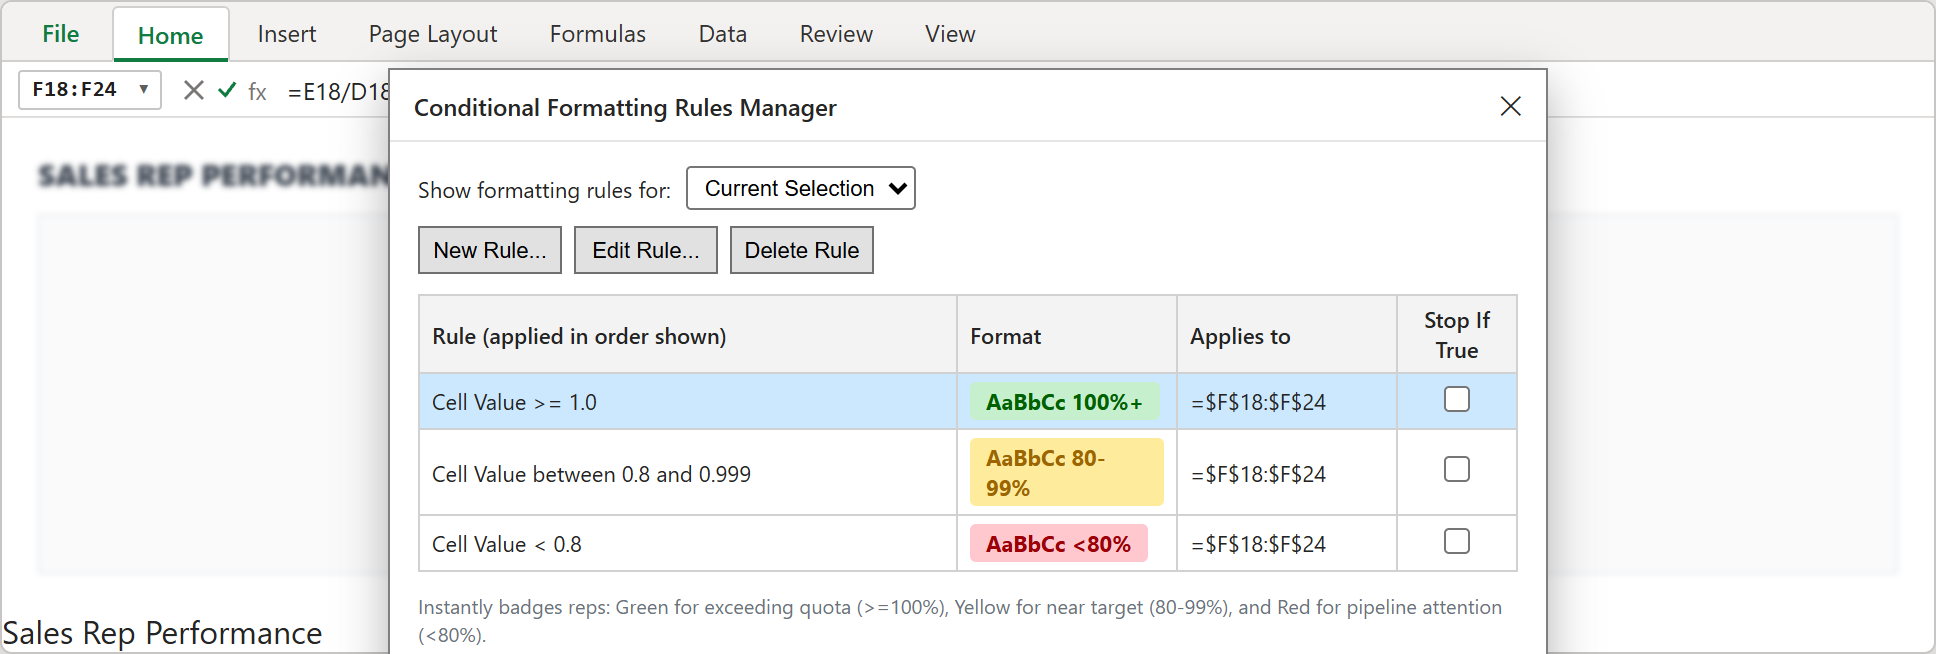
Step 2: Excel Rules Manager dialog configuring multi-tier thresholds for 100%+, 80-99%, and under 80% quota attainment.
3Step 3: Executive Scorecard and Team Rollup View
Now examine the completed executive dashboard view.
Top KPI cards summarize team performance: Team Quota Assigned ($315,000), Total Revenue Achieved ($306,800), Deals Closed Won (13 Deals), and Total Active Pipeline ($433,000).
Across the team, overall attainment stands at 97.4% with an average deal size of $23,600 and an average sales cycle of 31.6 days. The team has 1.4x pipeline coverage to close out remaining targets.
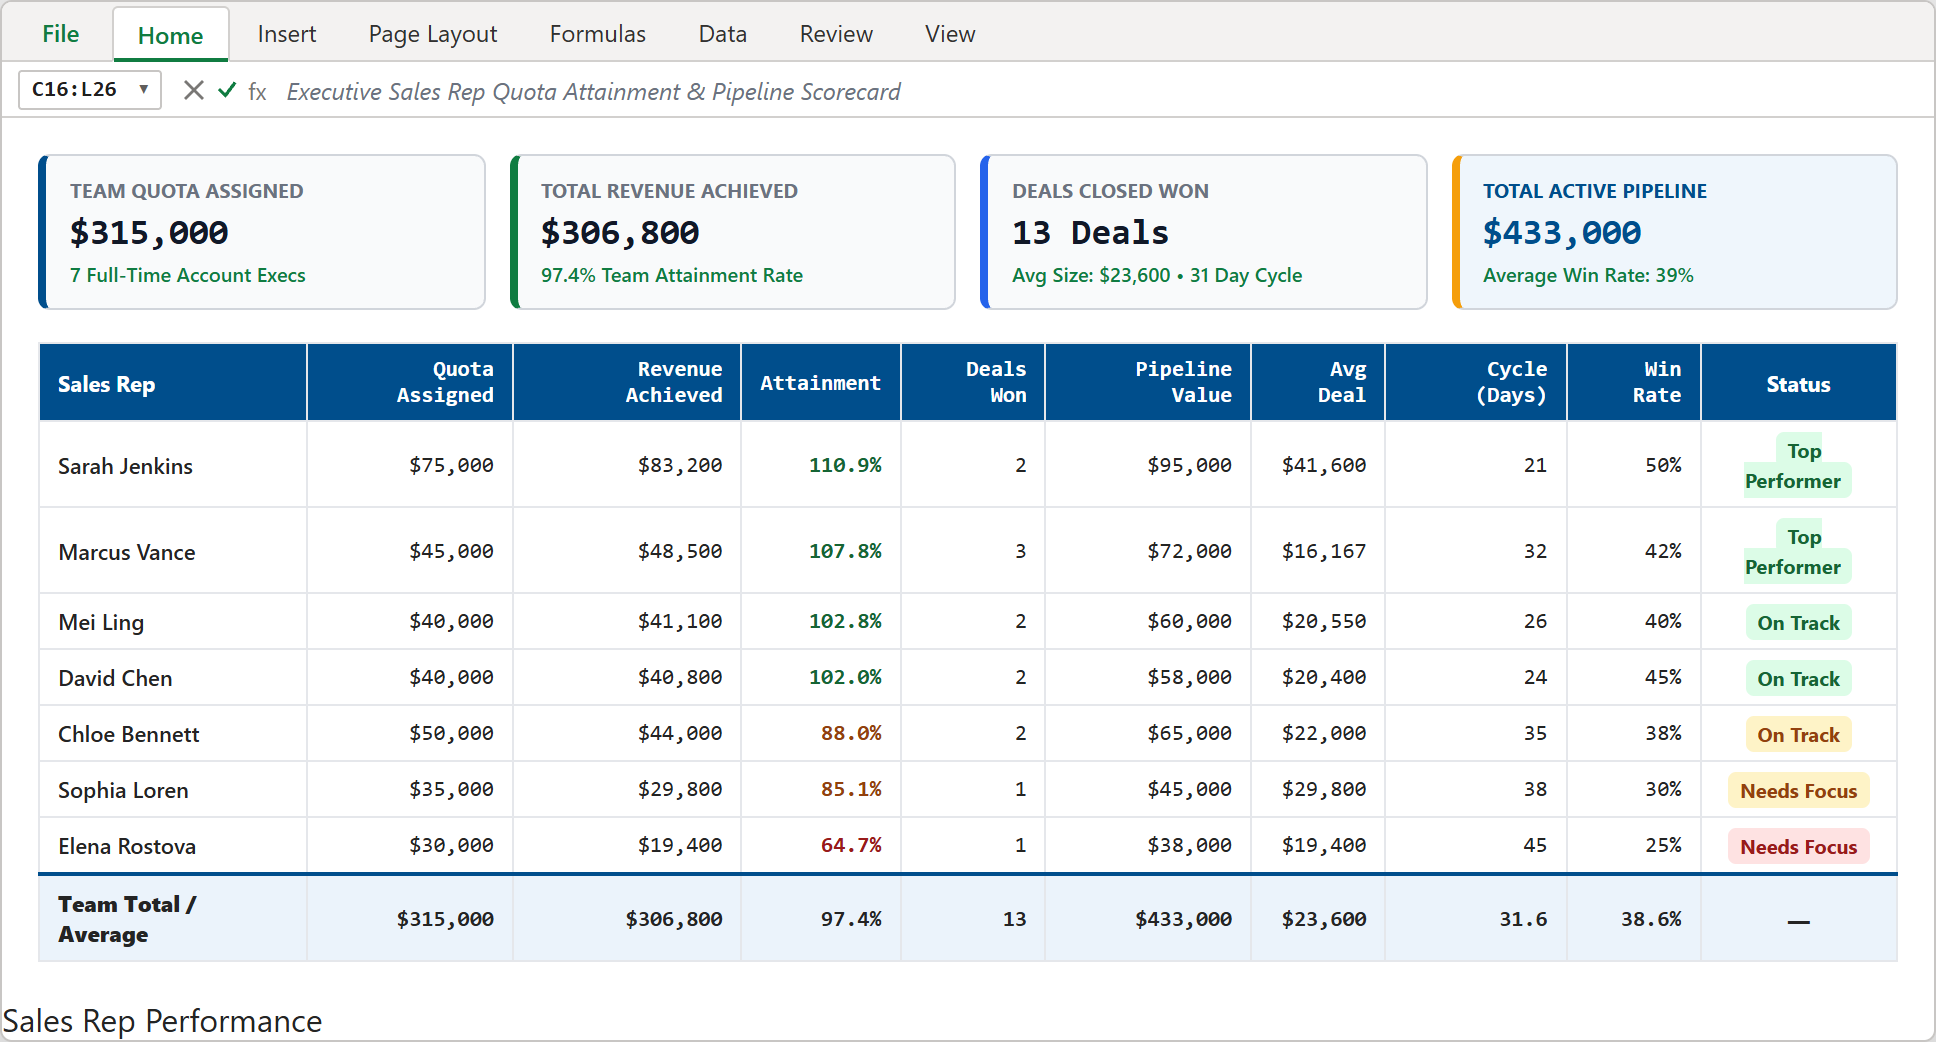
Step 3: Completed sales dashboard showing top KPI cards, individual rep attainment badges, and team average rollups.
Sales Operations Best Practices and Quota Rules
To get the most value from your sales tracking model, follow these three operational guidelines:
1. Maintain 3x Pipeline Coverage: Each rep should carry at least 3x their monthly quota in qualified active pipeline (e.g., $135,000 in pipeline for a $45,000 quota) to absorb lost deals.
2. Track Velocity Alongside Revenue: High revenue with long 60+ day cycles can hide cash flow delays. Monitor sales cycle days to ensure steady deal momentum.
3. Audit Win Rates Monthly: If a rep shows high activity but a sub-30% win rate, review discovery qualification rather than simply demanding more cold outreach.
Conclusion and Next Steps
You have built a comprehensive Sales Rep Performance Tracker in Microsoft Excel. With automated attainment calculations, visual conditional badges, and executive team rollups, your sales leadership has immediate visibility into pipeline health and rep execution.
Download the template below to customize it for your sales team, or practice editing formulas directly inside our interactive spreadsheet playground.

Spreadsheet educator and web developer passionate about hands-on interactive spreadsheet practice.
Related Practical Exercises
Explore more hands-on spreadsheet models with downloadable practice workbooks.
 Sales
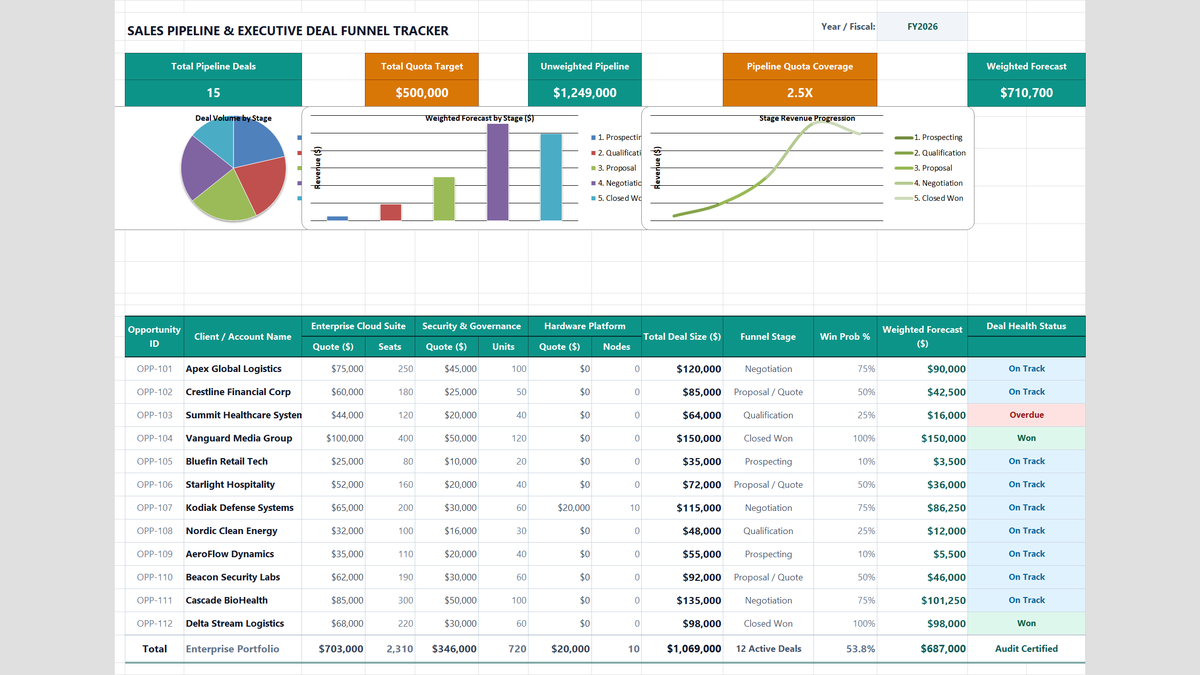
Sales Pipeline Tracker Excel Template
Learn how to construct an enterprise B2B sales pipeline tracker in Microsoft Excel featuring multi-product cross-sell quotes, weighted expected value forecasting, quota coverage ratios, and funnel conversion rollups.
 Finance
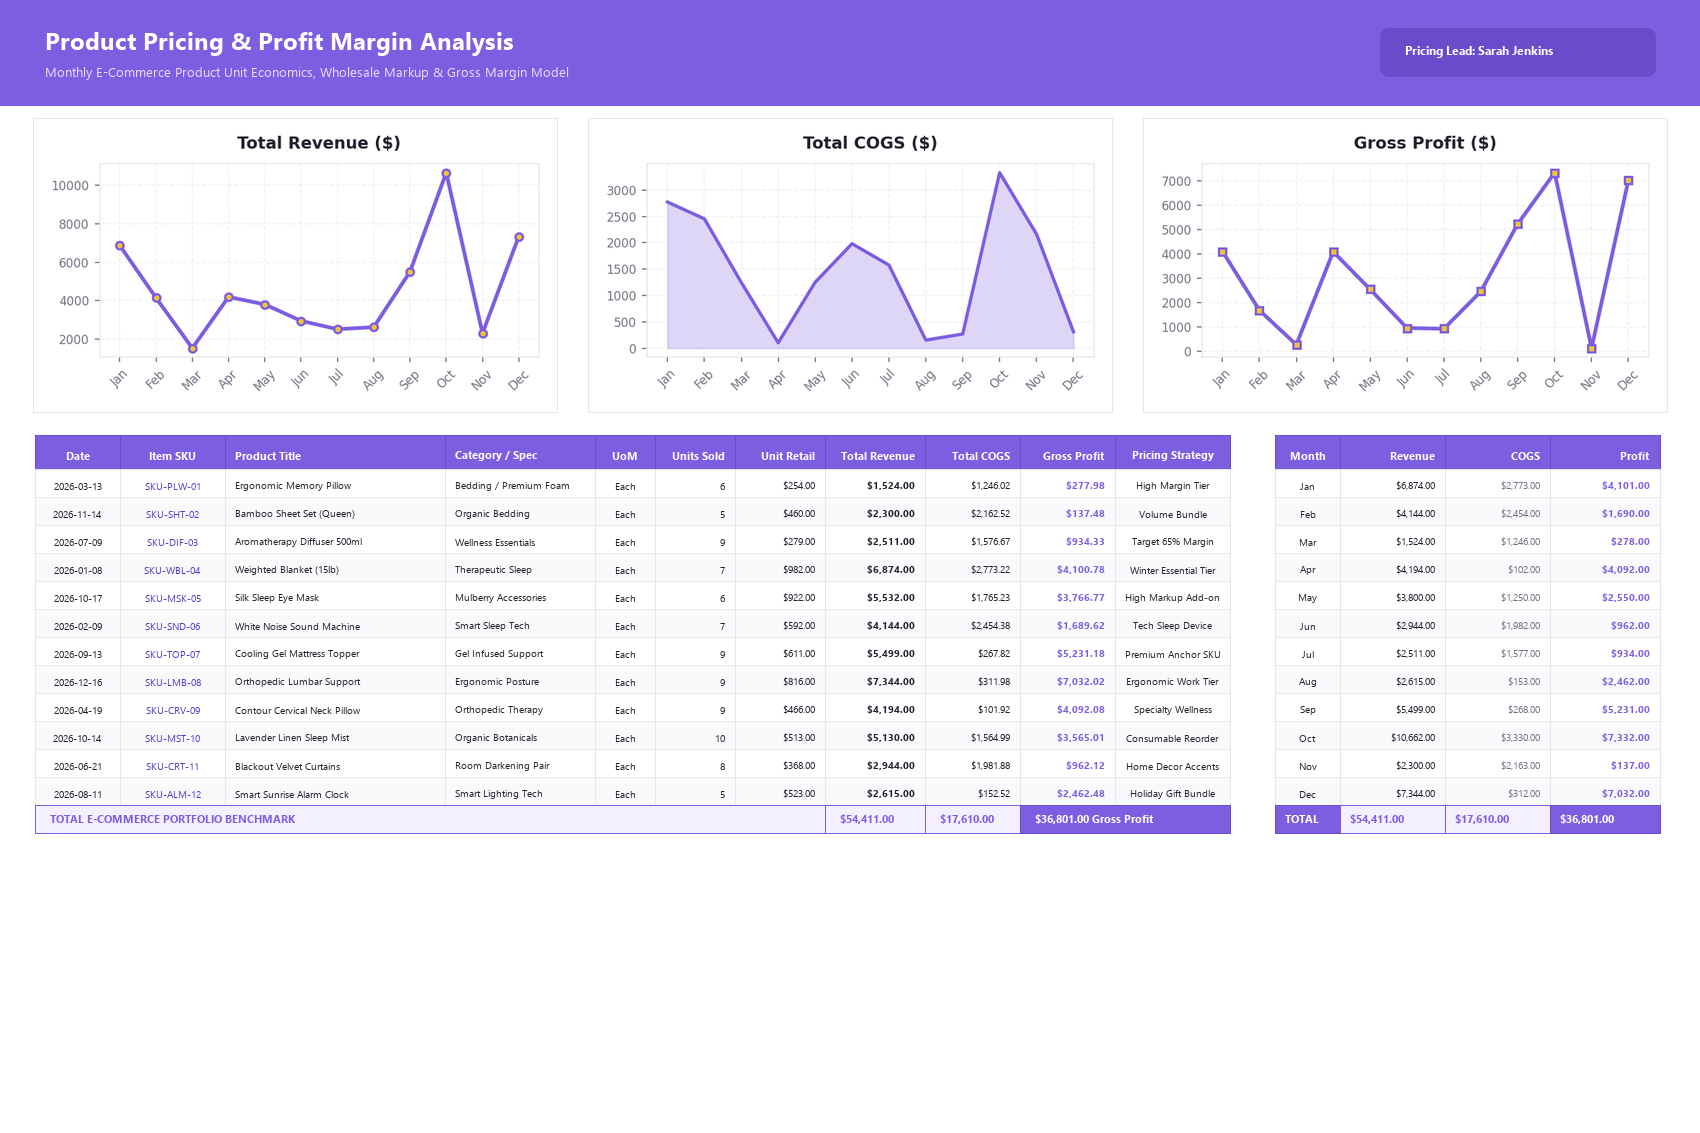
Product Pricing Calculator Excel Template
Build a practical product pricing and profit margin calculator in Microsoft Excel to track unit revenue, cost of goods sold, and monthly SKU profitability.
 Productivity
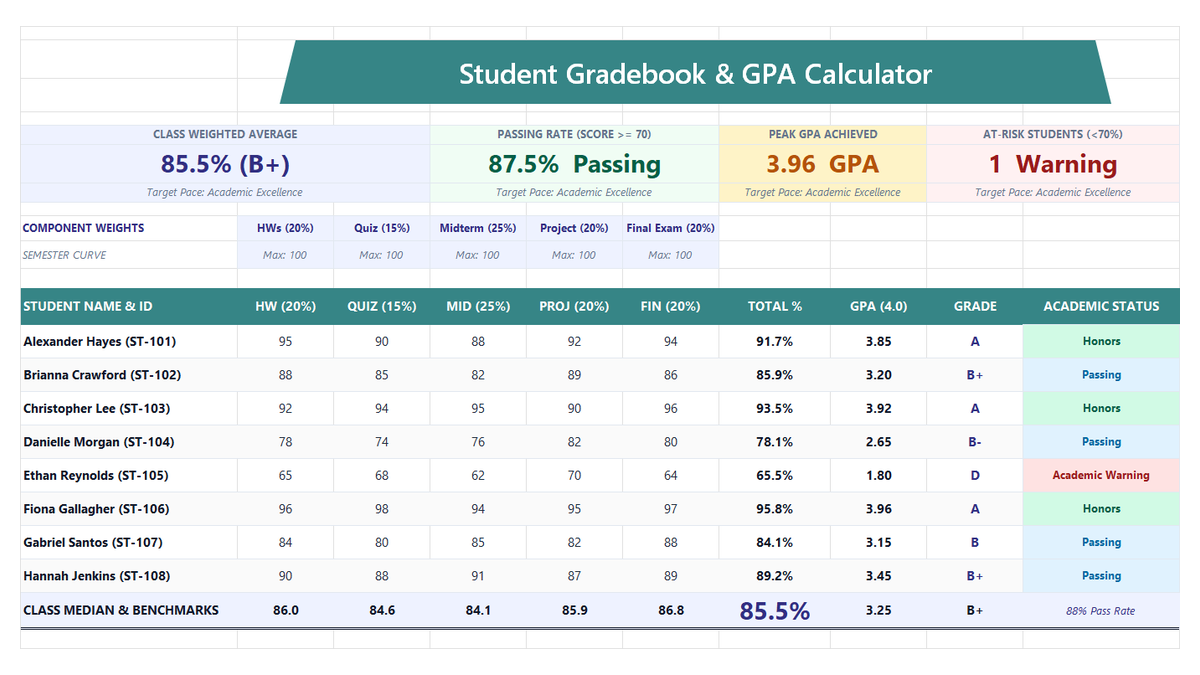
Student Gradebook GPA Calculator Excel Template
Build a practical student gradebook and semester GPA calculator in Microsoft Excel to compute weighted course grades, letter conversions, and class performance benchmarks.
 Operations
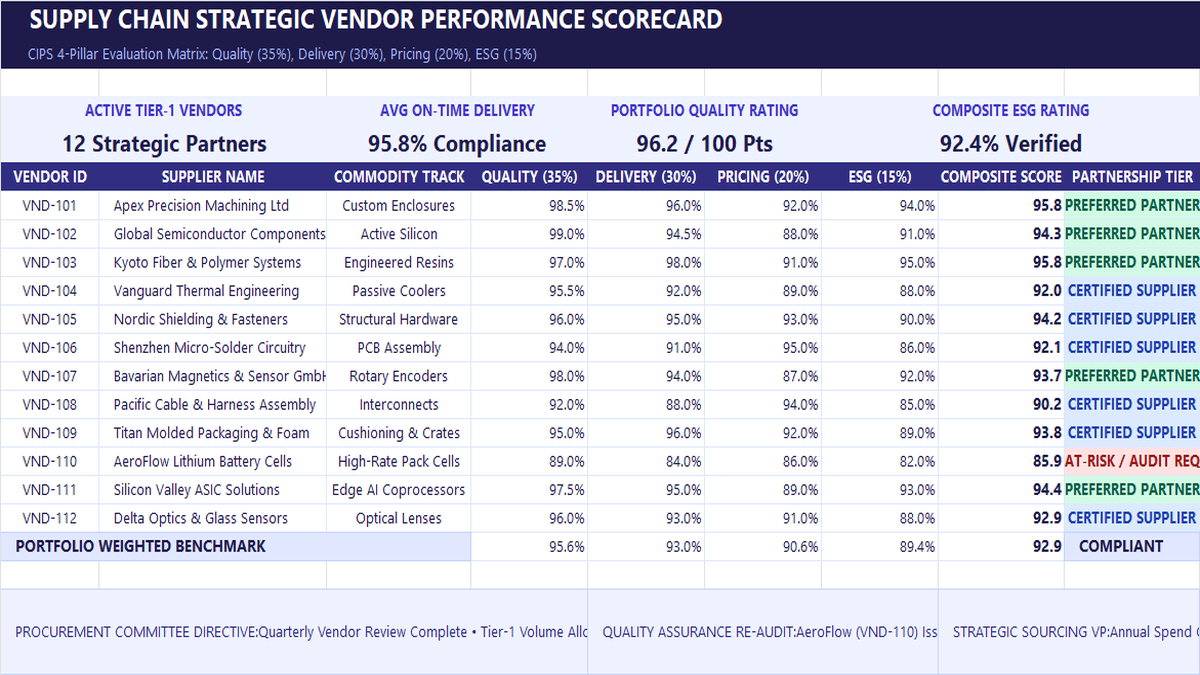
Vendor Performance Scorecard Excel Template
Learn strategic vendor evaluation in Microsoft Excel. Build a CIPS-compliant 4-pillar scorecard weighting Quality (35%), Delivery (30%), Pricing (20%), and ESG (15%). Automate weighted composite scores with SUMPRODUCT, calculate portfolio OTIF delivery, and establish tier-based purchase order allocations.
 Productivity
Wedding Budget Tracker Excel Template
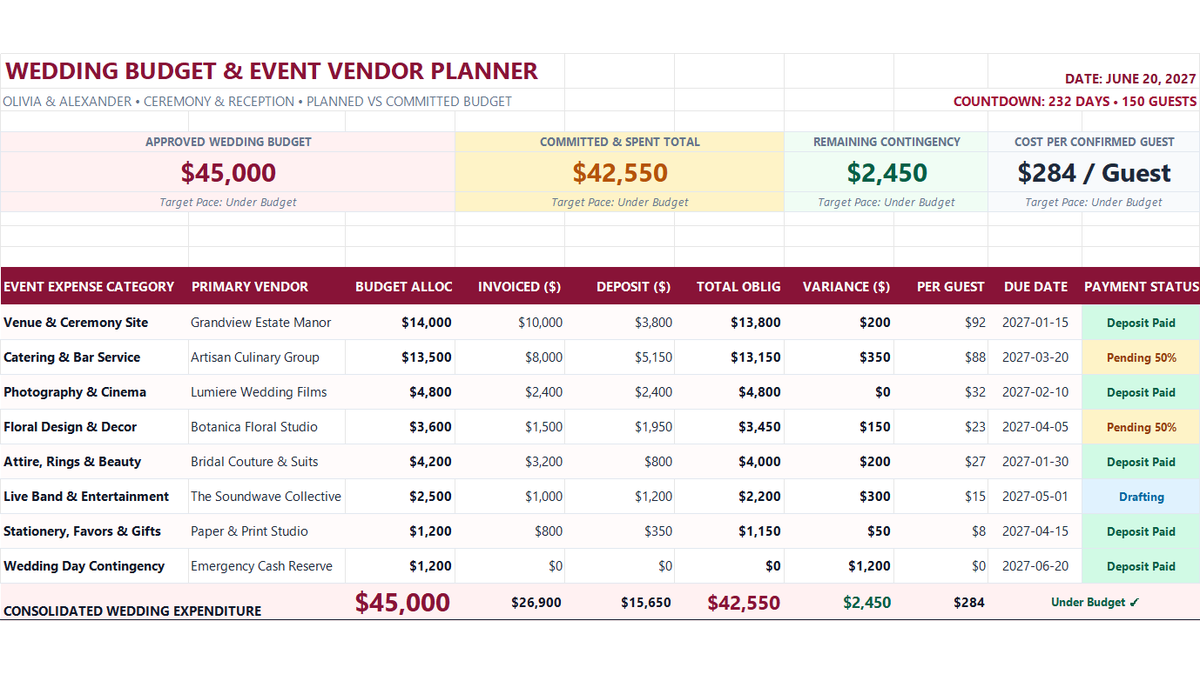
Learn how to build a wedding budget expense tracker in Microsoft Excel featuring single-sheet architecture, vendor deposit schedules, cost-per-guest formulas, and contingency reserve scorecards.
Discussion
Ask questions, share formula tips, or discuss alternative approaches with fellow spreadsheet builders.
Loading discussion...