In enterprise B2B sales leadership, the most dangerous number an executive can present to the board of directors is gross unweighted pipeline. Stating that your sales team possesses "$1.069 million in active opportunities" creates an illusion of prosperity that frequently unravels during quarter-end close when forty percent of those deals stall, slip, or evaporate into competitive losses.
Revenue Operations (RevOps) leaders and commercial VPs know that predictable growth requires mathematical conservatism. A $120,000 contract in early discovery carries vastly different revenue certainty than a $120,000 contract undergoing final legal redlines. Without staged win probabilities, quota coverage buffers, and deal health exception tracking, sales forecasts become wishful thinking.
In this comprehensive hands-on guide, we engineer a production-grade Sales Pipeline & Executive Deal Funnel Tracker in Microsoft Excel. From multi-product cross-sell quotes (Cloud, Security, Hardware) to risk-adjusted expected value calculations and executive quota coverage scorecards, this model delivers practical revenue forecasting control.
The Phantom Pipeline Trap: Why Raw Deal Totals Deceive Executive Boards
Quarterly revenue targets dictate hiring roadmaps, operational capacity, and investor confidence. Yet sales organizations routinely suffer from forecast volatility due to three structural flaws in their spreadsheet models:
1. The All-or-Nothing Fallacy: Summing raw contract values treats a deal with a 10% chance of closing identically to one with signed verbal approval. This artificial inflation blinds leadership to impending quarterly misses until the final two weeks of the fiscal cycle.
2. Multi-Product Quote Fragmentation: Modern B2B vendors rarely sell single SKUs. When Enterprise Cloud licenses, Security & Governance modules, and Hardware appliance nodes are tracked in separate disconnected tabs, sales reps fail to capture the consolidated annual contract value (ACV).
3. Inadequate Quota Coverage Ratios: In mature sales organizations, achieving a $500,000 quota requires at least 2.0x to 3.0x in active pipeline coverage. Failing to calculate this ratio dynamically leaves reps under-prospecting because they assume their gross deals are sufficient.
By integrating multi-line deal schedules with automated win probability multipliers and executive KPI scorecards, we transform raw opportunity lists into a predictive revenue engine.
Funnel Architecture: Multi-Product Matrix & Probability Staging
An executive pipeline model organizes opportunities across three distinct planes: executive quota KPI scorecards (rows 4 through 7), the active opportunity ledger (columns D through P, rows 16 through 29), and an executive stage distribution matrix (columns S through U).
Our ledger incorporates three core commercial product suites: Enterprise Cloud Suite (seats), Security & Governance (units), and Hardware Platform (nodes), standardizing cross-sell accounting.
Review the schema below to understand how the pipeline model functions across columns D through P.
| Col | Field Name | Type | Format | Operational Role |
|---|---|---|---|---|
| D | Opportunity ID | Code | Centered Tag | Unique CRM deal tracking code (OPP-101 through OPP-112). |
| E | Client Account Name | Text | General | Target enterprise customer organization. |
| F-G | Enterprise Cloud Suite | Currency / Int | $#,##0 / #,##0 | SaaS seat license quote and volume count. |
| H-I | Security & Governance | Currency / Int | $#,##0 / #,##0 | Cybersecurity add-on quote and managed unit count. |
| J-K | Hardware Platform | Currency / Int | $#,##0 / #,##0 | Dedicated on-premise hardware nodes and appliance cost. |
| L | Total Deal Size ($) | Formula (Currency) | $#,##0 | Consolidated opportunity ACV: Cloud + Security + Hardware. |
| M | Funnel Stage | Categorical | Badge Format | Active sales milestone: Prospecting, Qualification, Proposal, Negotiation, Closed Won. |
| N | Win Prob % | Percentage | 0% | Stage-calibrated probability factor (10%, 25%, 50%, 75%, 100%). |
| O | Weighted Forecast ($) | Formula (Currency) | $#,##0 | Risk-adjusted expected commercial revenue: Deal Size * Probability. |
| P | Deal Health Status | Categorical | Badge Format | Subjective deal hygiene flag: On Track, Stalled, or At Risk. |
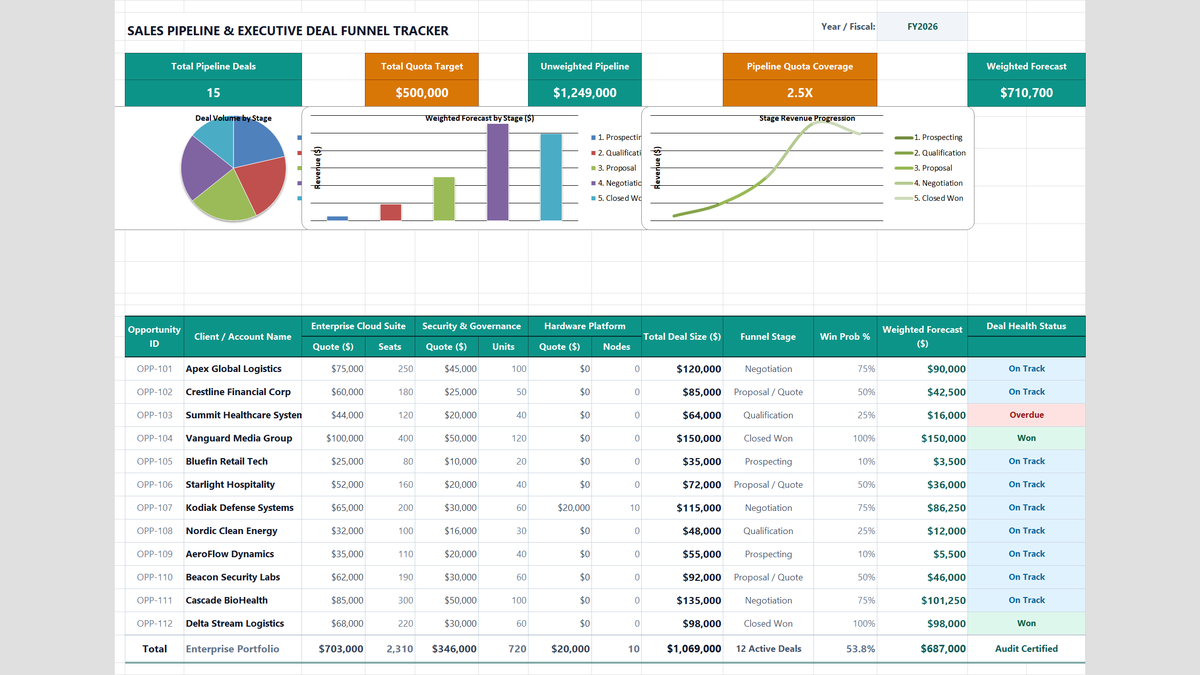
Workbook Blueprint: The Sales Pipeline Tracker layout displaying executive quota cards, multi-product quoting columns, and the stage conversion matrix.
With our schema established for cross-product enterprise opportunities, let us construct the core revenue calculation formulas.
Step-by-Step Implementation: Engineering the Enterprise Deal Forecaster
Follow this structured step-by-step sequence to construct the calculations, quota coverage ratios, stage summary matrix, and deal hygiene rules directly inside Microsoft Excel.
1Step 1: Consolidating Multi-Product Deal Sizes
Enterprise sales representatives frequently cross-sell across software licenses, security add-ons, and infrastructure hardware. To derive total annual contract value (ACV), we sum the quote values across all three offerings.
Select cell L18 and input the cross-product sum: =F18+H18+J18.
For Apex Global Logistics (OPP-101), with $75,000 in Enterprise Cloud, $45,000 in Security, and $0 in Hardware, cell L18 evaluates to a total deal size of $120,000.
Copy this formula down through row 29 to calculate consolidated deal sizes for all 12 opportunities across the portfolio.
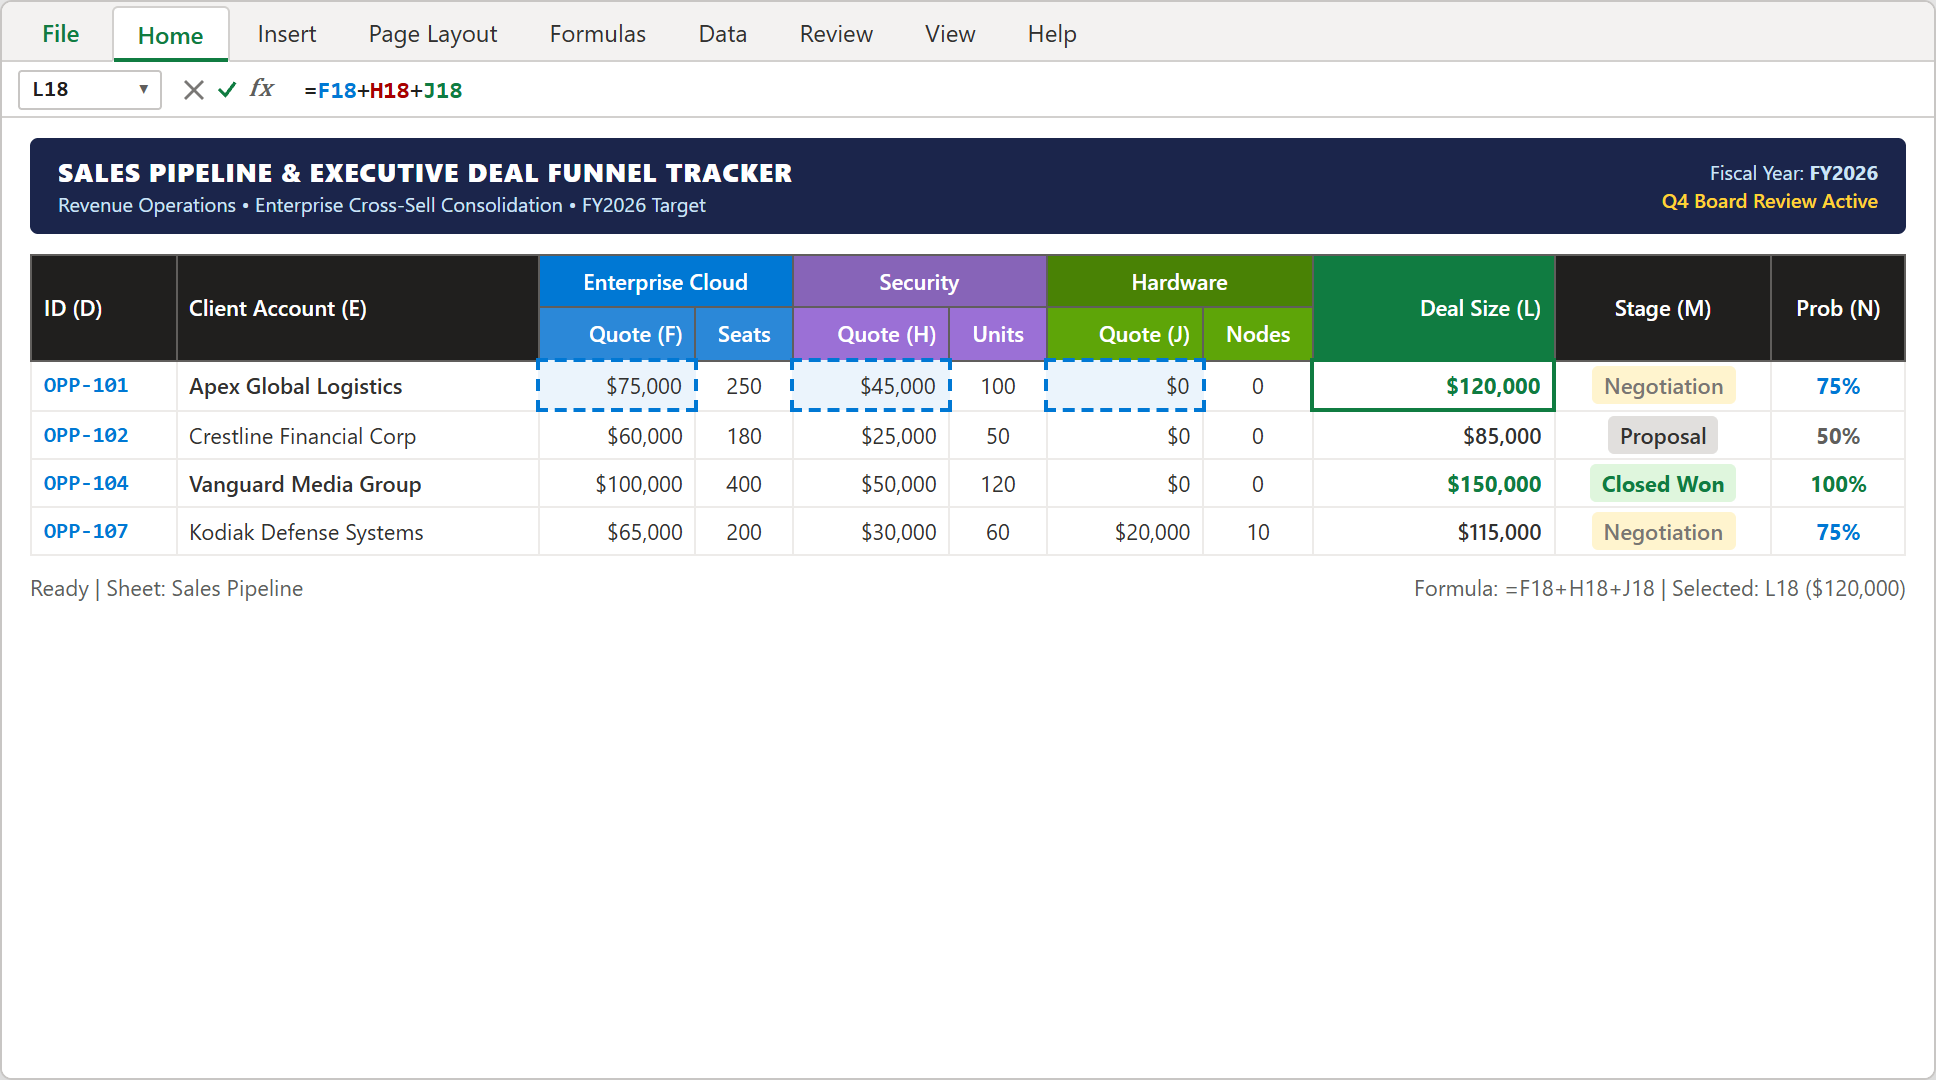
Step 1: Cell L18 formula bar active with =F18+H18+J18 consolidating cross-product quotes into a $120,000 deal total.
2Step 2: Calculating Risk-Adjusted Revenue with In-Cell Win Probabilities
To guard against forecast over-optimism, RevOps applies stage-weighted probability factors to determine the expected dollar value of every pipeline deal.
Select cell O18 and calculate the risk-adjusted expected revenue: =L18*N18.
With Apex Global Logistics positioned in the "Negotiation" stage at a 75% win probability, the formula evaluates $120,000 * 75%, yielding a conservative expected value of $90,000. Replicate this formula down through row 29.
Notice how an early-stage $35,000 opportunity like Bluefin Retail Tech (10% win probability) contributes just $3,500 to the forecast, preventing deceptive pipeline spikes.
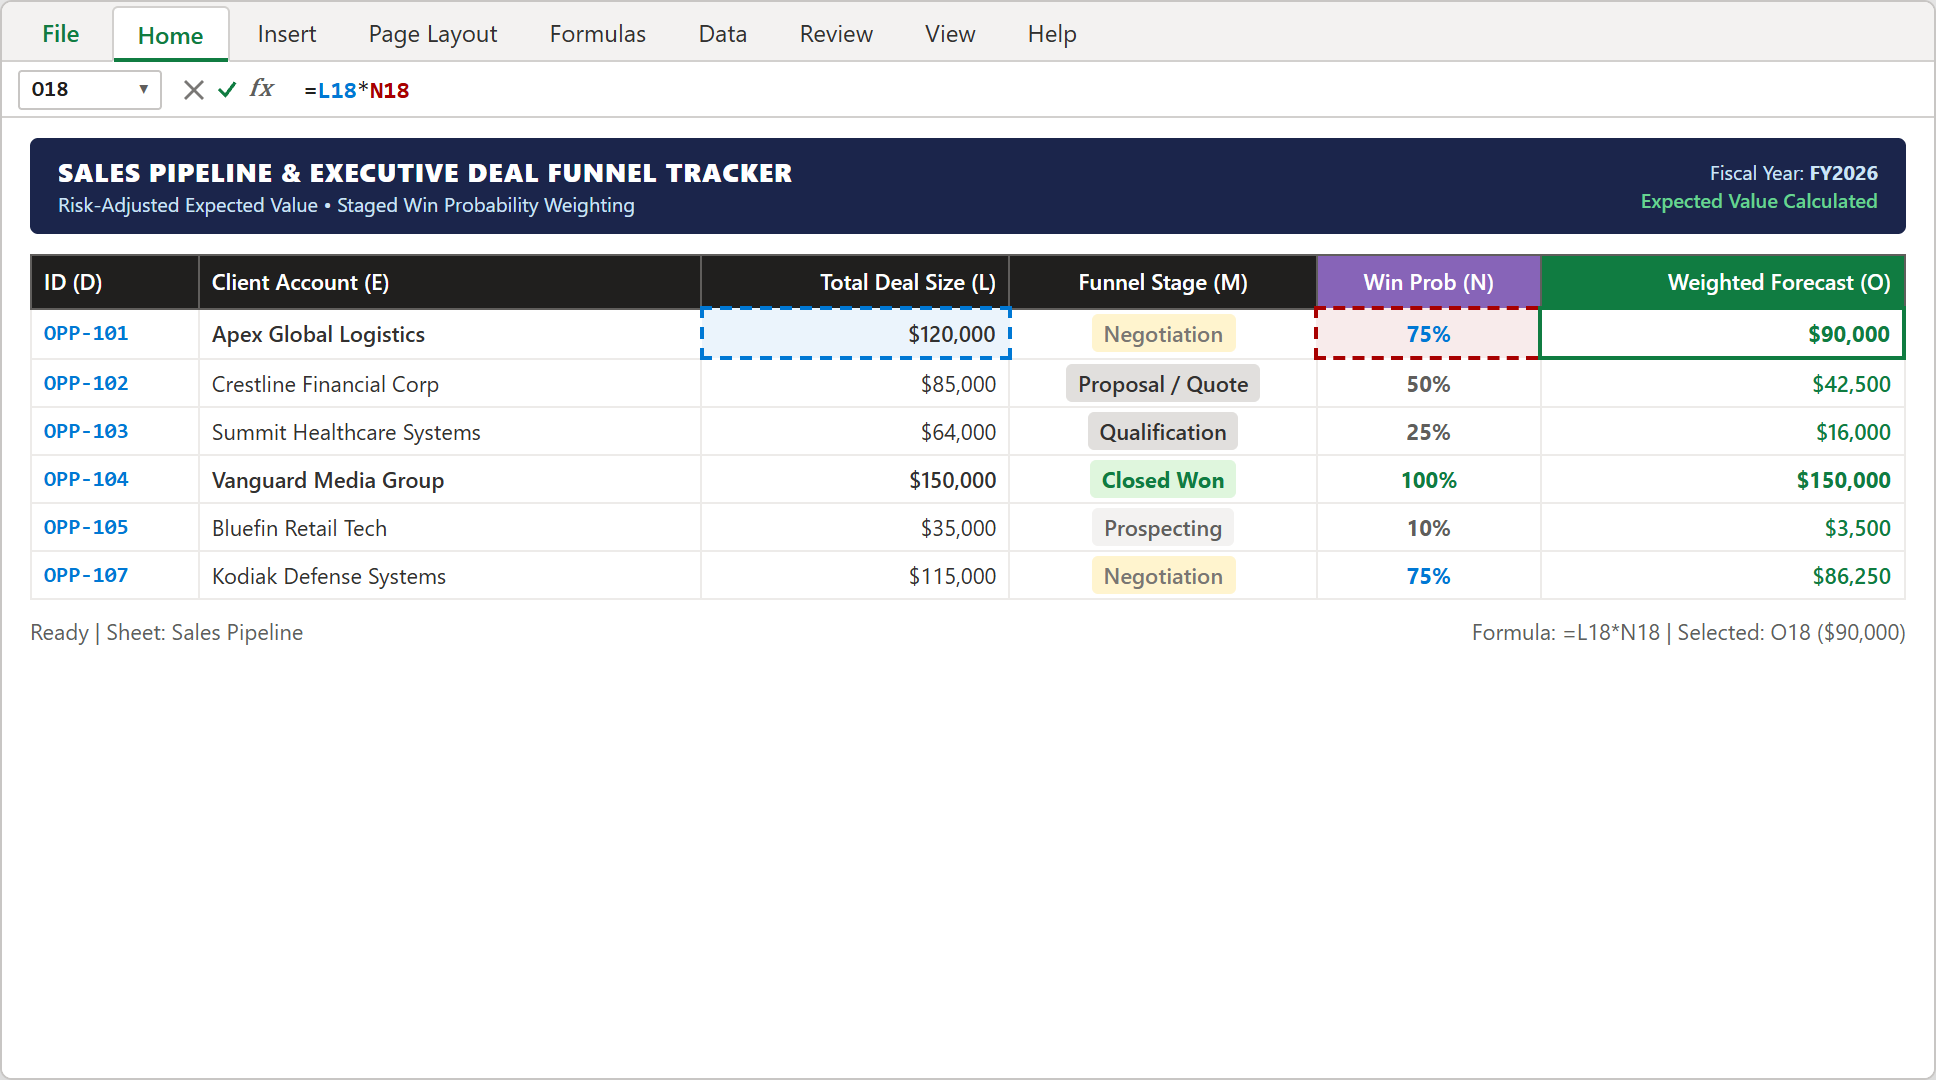
Step 2: Formula bar displaying =L18*N18 in cell O18 computing the risk-adjusted expected value of $90,000.
3Step 3: Measuring Executive Quota Coverage Ratio against the $500,000 Target
Does the commercial team possess adequate gross pipeline cushion to hit its annual quota target of $500,000?
In executive scorecard cell M6, derive the Quota Coverage Ratio: =J6/G7.
With total unweighted pipeline summing to $1,069,000 (cell J6) against an authorized quota envelope of $500,000 (cell G7), cell M6 evaluates to 2.14x (213.8%).
Because institutional best practices mandate a minimum 2.0x coverage ratio to account for standard 50% deal slippage, this indicator confirms that current top-of-funnel volume is healthy and sufficient to support board expectations.
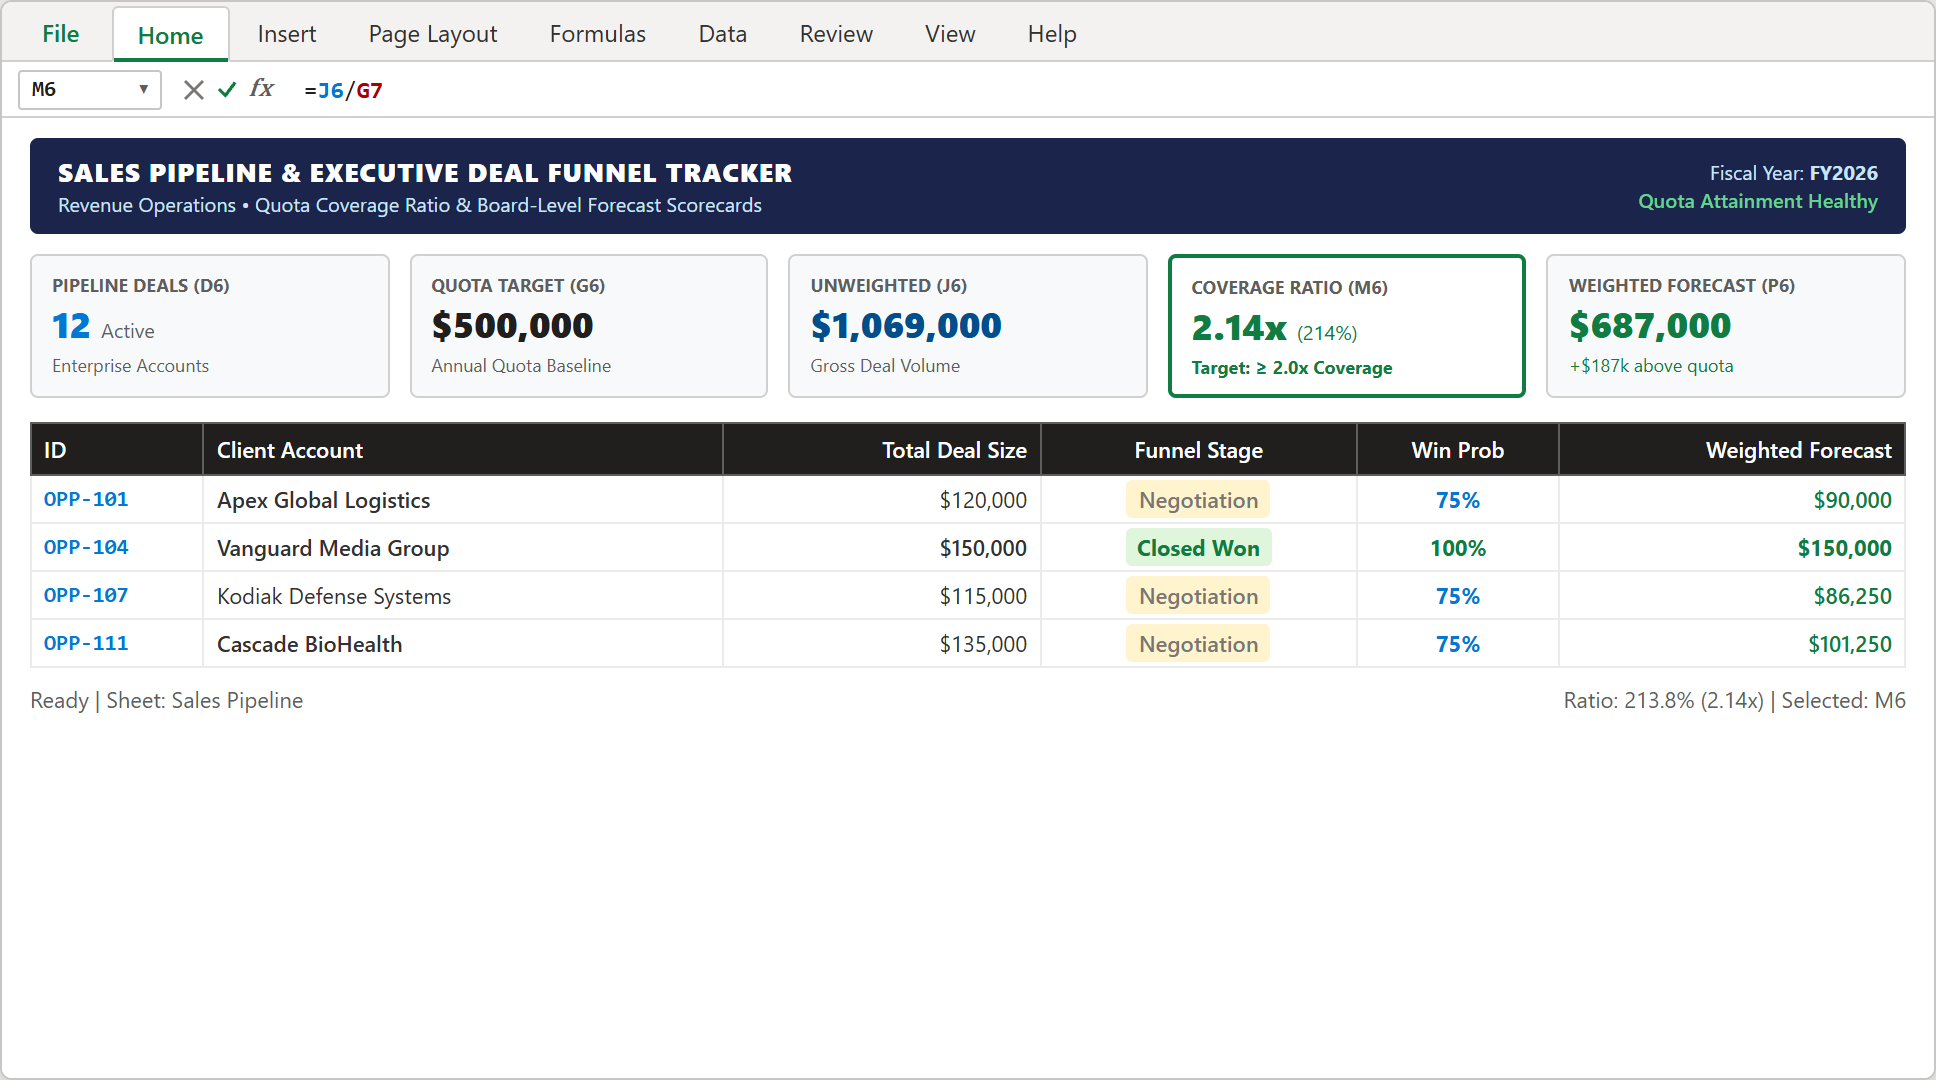
Step 3: Executive scorecard cell M6 rendering a 2.14x quota coverage ratio against the $500k target.
4Step 4: Funnel Stage Distribution Table with Stage Rollups
Where is capital currently concentrated across the customer acquisition journey? In columns S through U, we configure an executive conversion matrix aggregating opportunities by sales milestone.
In cell U21, calculate total weighted revenue in the Negotiation stage using SUMIF: =SUMIF($M$18:$M$29, "Negotiation", $O$18:$O$29), yielding $277,500 across 3 active deals.
The completed matrix reveals that $525,500 (76.5%) of our total weighted forecast ($687,000) is already consolidated in Late-Stage opportunities (Negotiation and Closed Won), giving executive leadership immense confidence for quarter-end delivery.
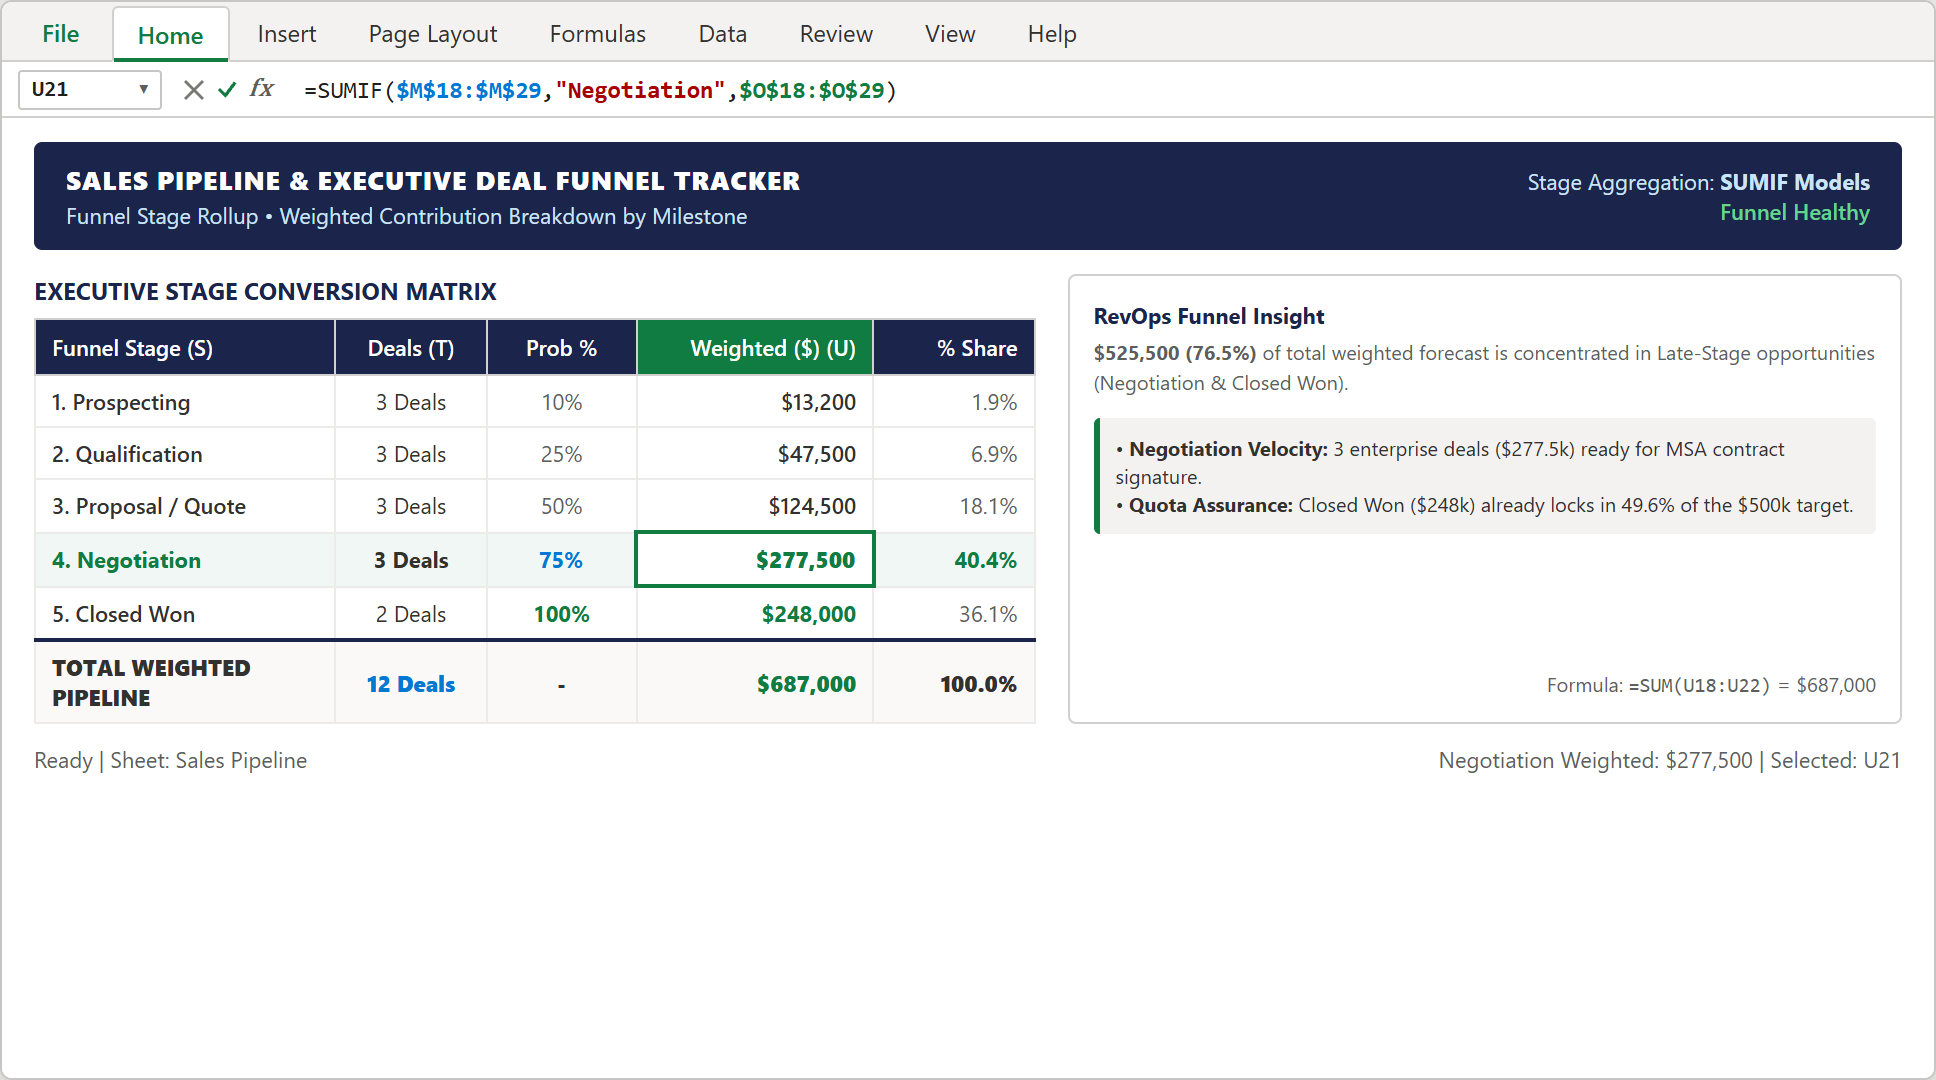
Step 4: Executive stage distribution matrix detailing deal counts, stage probabilities, and $687,000 weighted pipeline.
5Step 5: Highlighting At-Risk Deals using Custom Deal Health Validation
In revenue forecasting, identifying deteriorating deals early is far more important than celebrating already-won accounts. In column P, we implement deal hygiene flags supported by automated conditional formatting.
Select cells $P$18:$P$29, navigate to Home > Conditional Formatting > Highlight Cells Rules > Equal To, and define three visual health states:
• At Risk: Soft rose fill (#FDE7E9) with dark red text (#A80000) indicating critical champion turnover, security audit rejections, or pricing pushback.
• Stalled: Muted amber fill (#FFF4CE) with dark gray text (#797673) flagging opportunities lacking customer engagement for > 14 days.
• On Track: Soft emerald fill (#DFF6DD) with dark green text (#107C41) confirming clear next steps and active mutual action plans.
During weekly 1-on-1 pipeline reviews, sales managers can filter directly on crimson flags to deploy executive sponsorship and rescue at-risk revenue before quarter close.
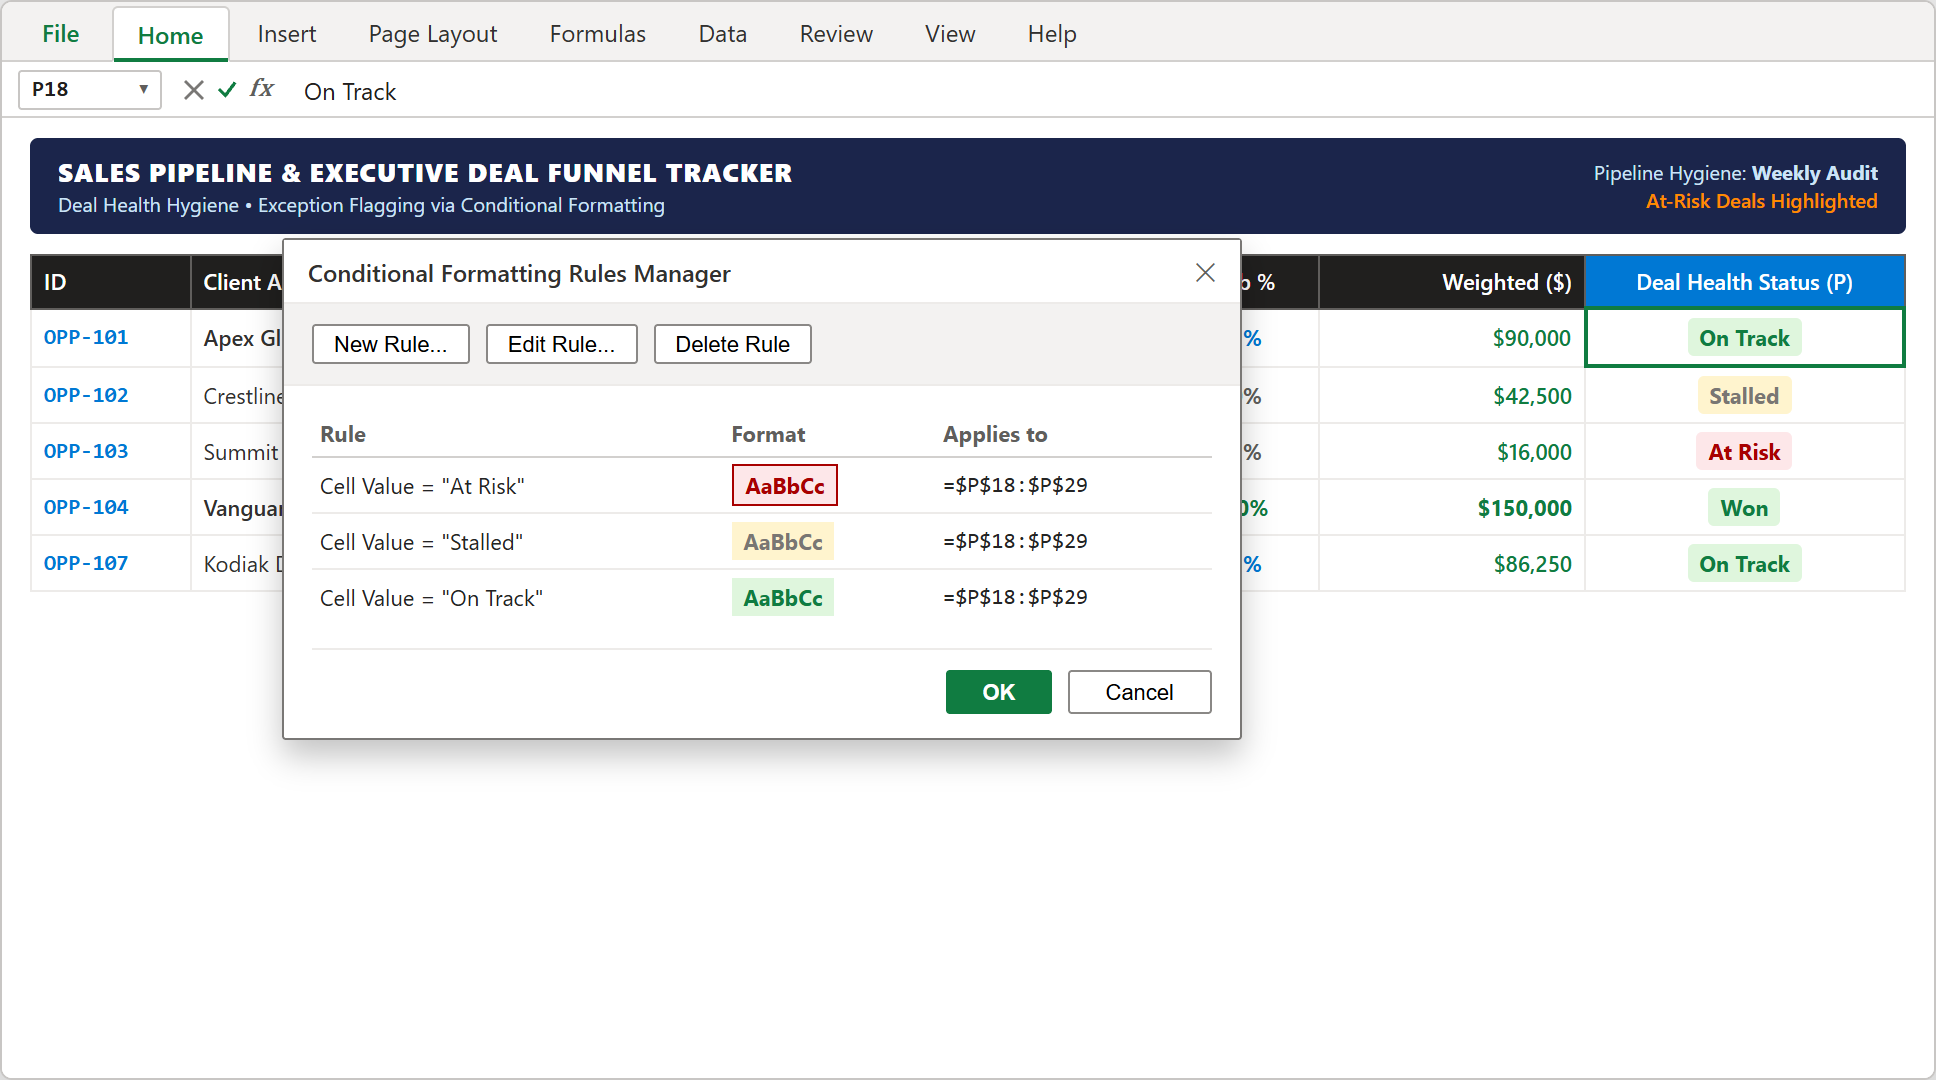
Step 5: The Conditional Formatting Rules Manager configuring automated red alerts for At-Risk opportunities in column P.
RevOps Governance Playbook: Weekly Pipeline Hygiene & Stage Discipline
A sophisticated sales pipeline model is only as credible as the CRM discipline enforced by frontline revenue teams. Implement these four operational protocols to maintain forecast accuracy above 95%:
1. The "No Close Date Slippage" Rule: Opportunity close dates cannot be pushed forward into next quarter more than twice without senior sales director review. Deals that slip three consecutive times must be downgraded to "Prospecting" or archived as "Closed Lost - Bad Timing".
2. Strict Exit Criteria for Stage Gates: Reps cannot advance an opportunity to "Proposal / Quote" (50% probability) without a verified business case presentation, and cannot advance to "Negotiation" (75% probability) without an approved commercial proposal signed off by client economic buyers.
3. Weekly Stalled Deal Scrub: Every Monday morning, RevOps runs an automated filter for deals marked "Stalled". Any account with zero customer calendar activity over 21 days is removed from the active weighted forecast to preserve model integrity.
4. Multi-Product Cross-Sell Quotas: Review columns F, H, and J monthly. If a representative consistently sells single-SKU Cloud packages without positioning Security & Governance modules, initiate solution engineering coaching to expand average deal sizes.
By institutionalizing these procedural standards alongside your Microsoft Excel sales tracker, your sales organization transforms pipeline management from guesswork into an exact, predictable science.

Spreadsheet educator and web developer passionate about hands-on interactive spreadsheet practice.
Related Practical Exercises
Explore more hands-on spreadsheet models with downloadable practice workbooks.
 Finance
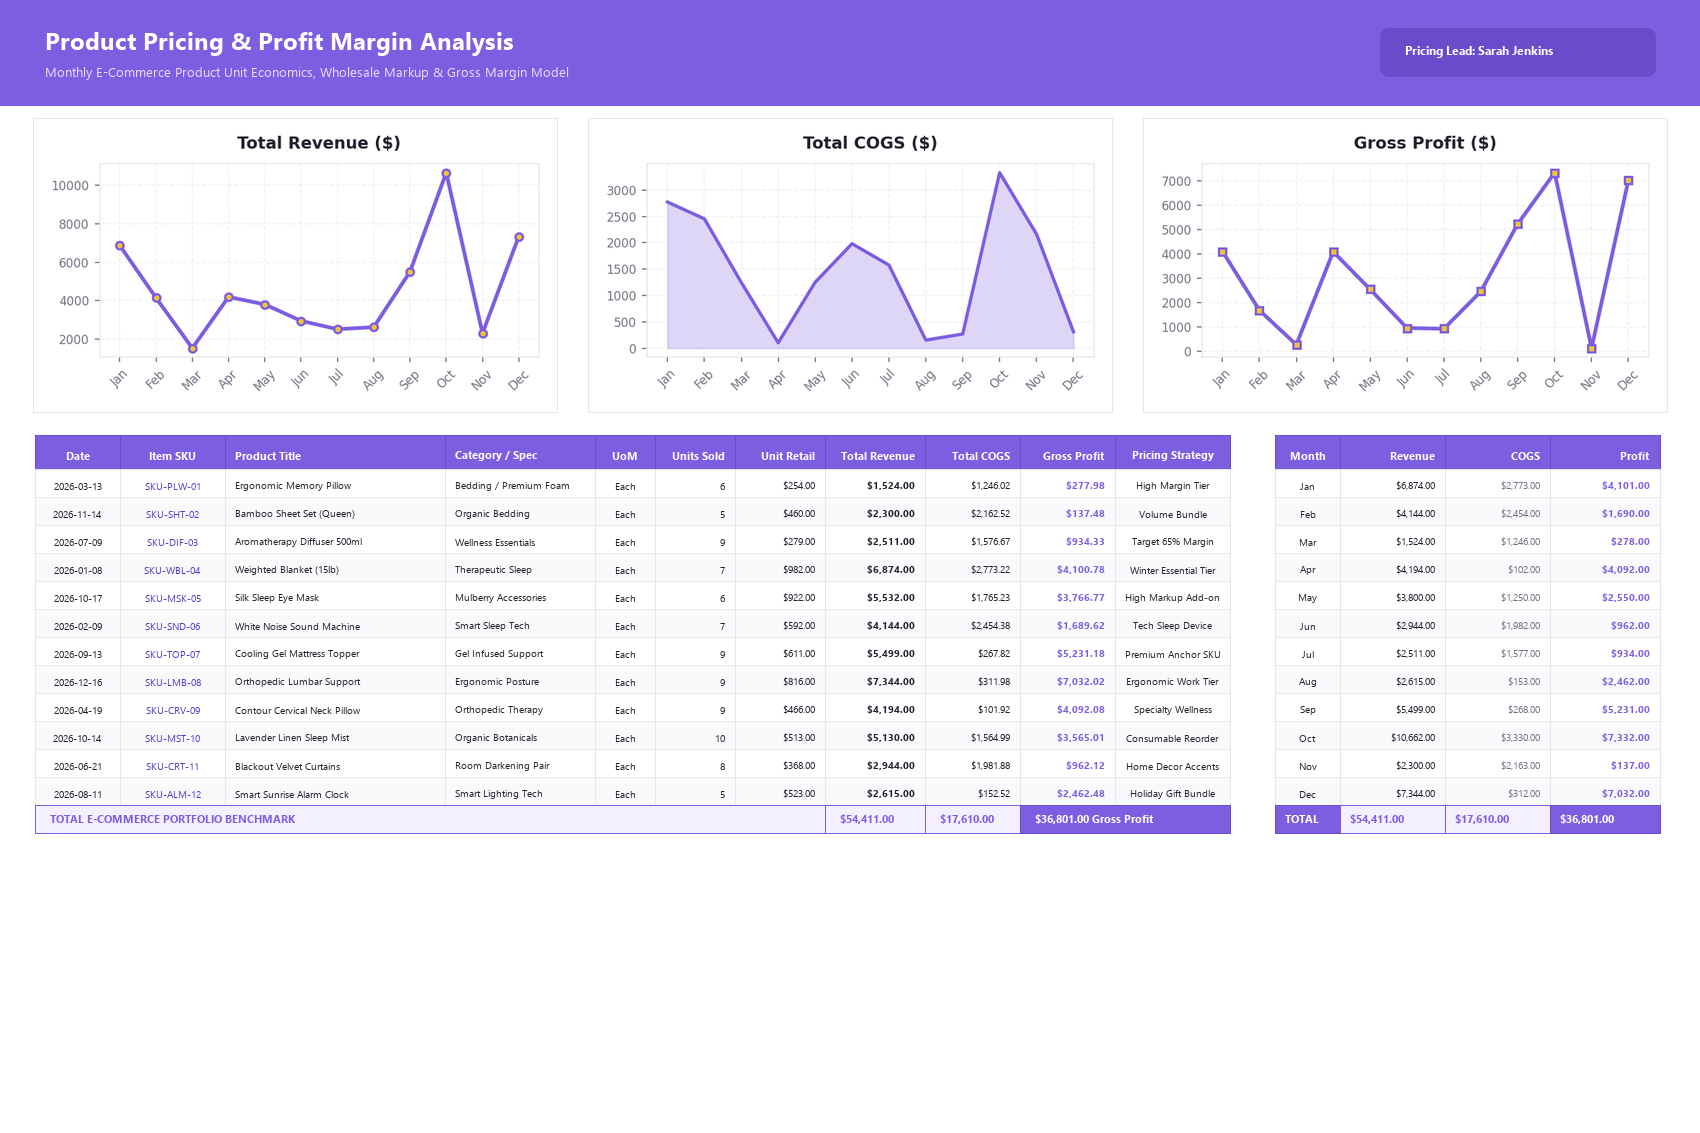
Product Pricing Calculator Excel Template
Build a practical product pricing and profit margin calculator in Microsoft Excel to track unit revenue, cost of goods sold, and monthly SKU profitability.
 Productivity
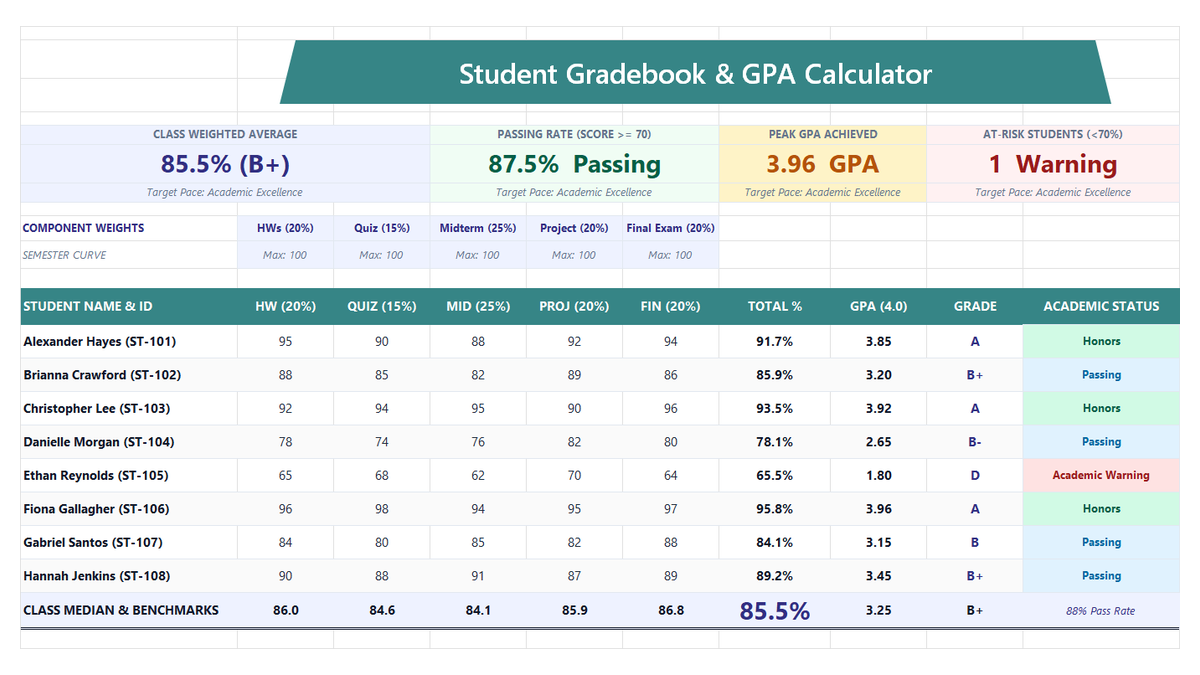
Student Gradebook GPA Calculator Excel Template
Build a practical student gradebook and semester GPA calculator in Microsoft Excel to compute weighted course grades, letter conversions, and class performance benchmarks.
 Operations
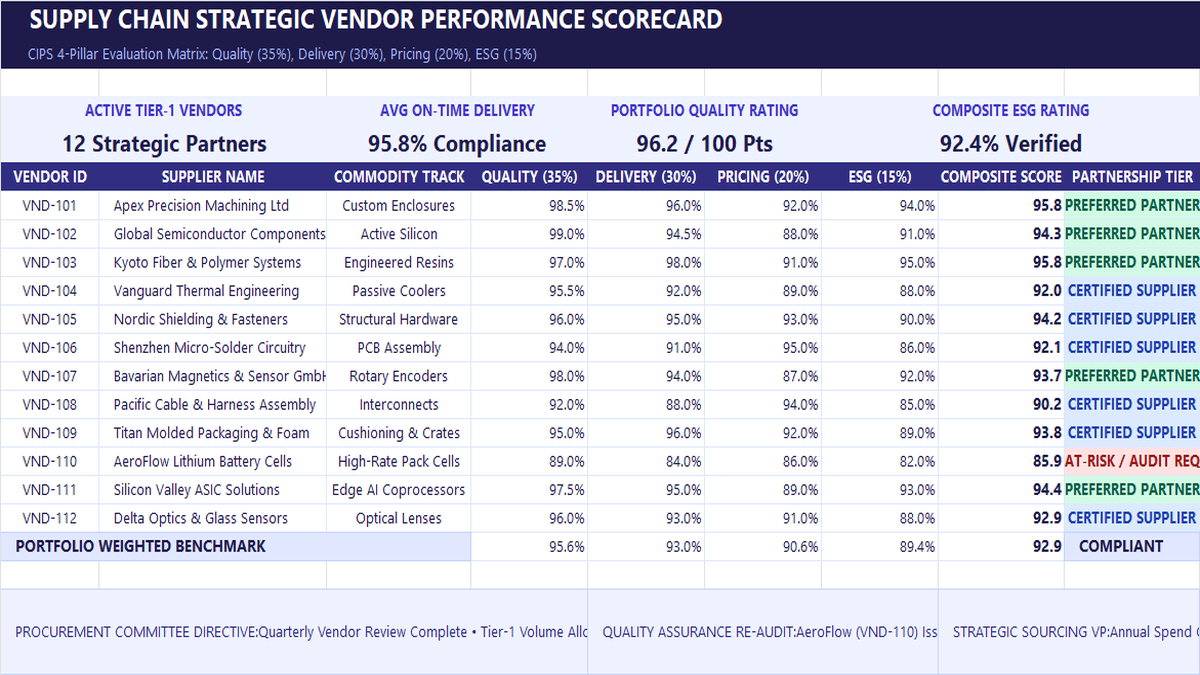
Vendor Performance Scorecard Excel Template
Learn strategic vendor evaluation in Microsoft Excel. Build a CIPS-compliant 4-pillar scorecard weighting Quality (35%), Delivery (30%), Pricing (20%), and ESG (15%). Automate weighted composite scores with SUMPRODUCT, calculate portfolio OTIF delivery, and establish tier-based purchase order allocations.
 Productivity
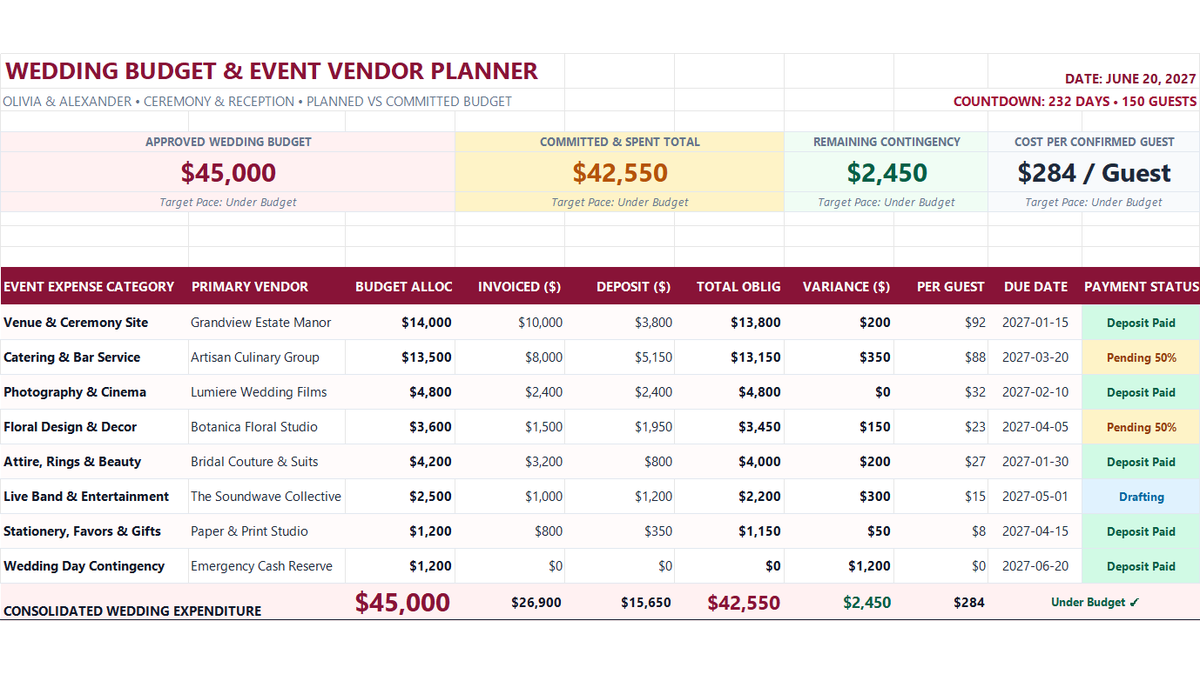
Wedding Budget Tracker Excel Template
Learn how to build a wedding budget expense tracker in Microsoft Excel featuring single-sheet architecture, vendor deposit schedules, cost-per-guest formulas, and contingency reserve scorecards.
 Sales
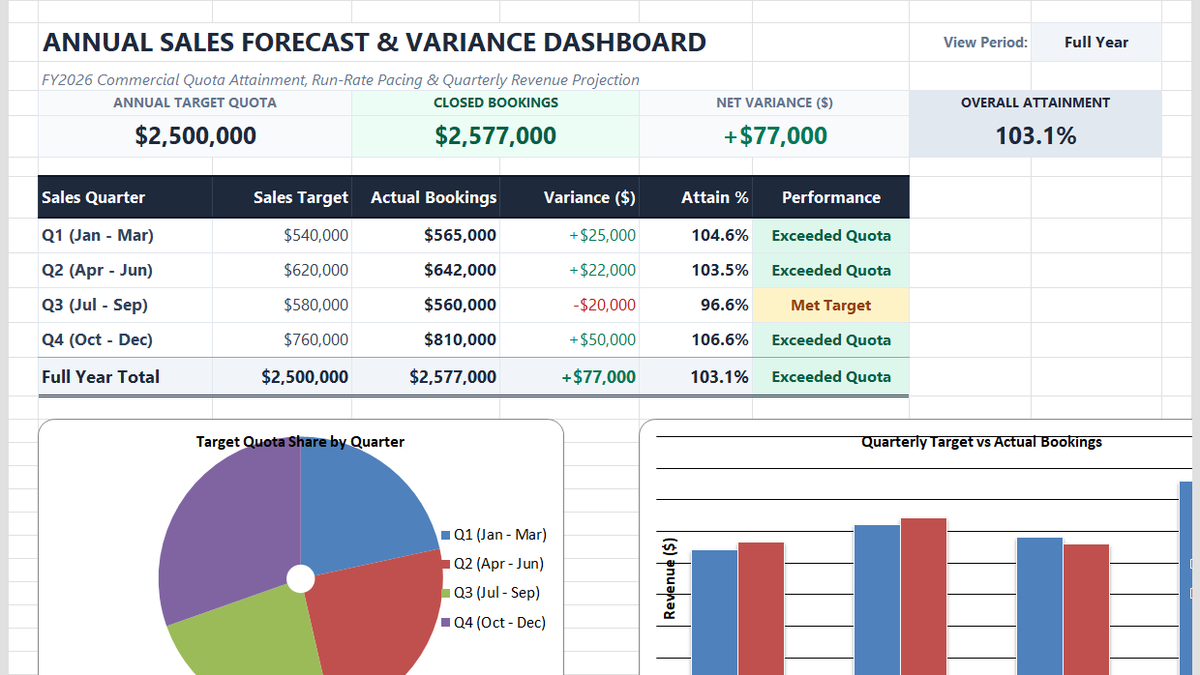
Annual Sales Forecasting Model Excel Template
Learn commercial revenue forecasting in Microsoft Excel. Build an annual sales forecasting dashboard featuring quarterly variance calculations, dynamic quota attainment metrics, clustered column comparison charts, and executive pacing scorecards.
Discussion
Ask questions, share formula tips, or discuss alternative approaches with fellow spreadsheet builders.
Loading discussion...