Motivating Reps Without Breaking the Commission Budget
A great commission plan does two things: it motivates top account executives to crush their quotas, and it protects company profit margins from unexpected payroll spikes. But when commission plans rely on manual calculations or ambiguous tier cutoffs, sales reps spend their Fridays questioning payout statements instead of closing new deals.
A transparent tiered commission model eliminates friction between sales and finance. By connecting quota attainment directly to progressive tier multipliers, reps know the exact dollar bonus they earn for every contract they close.
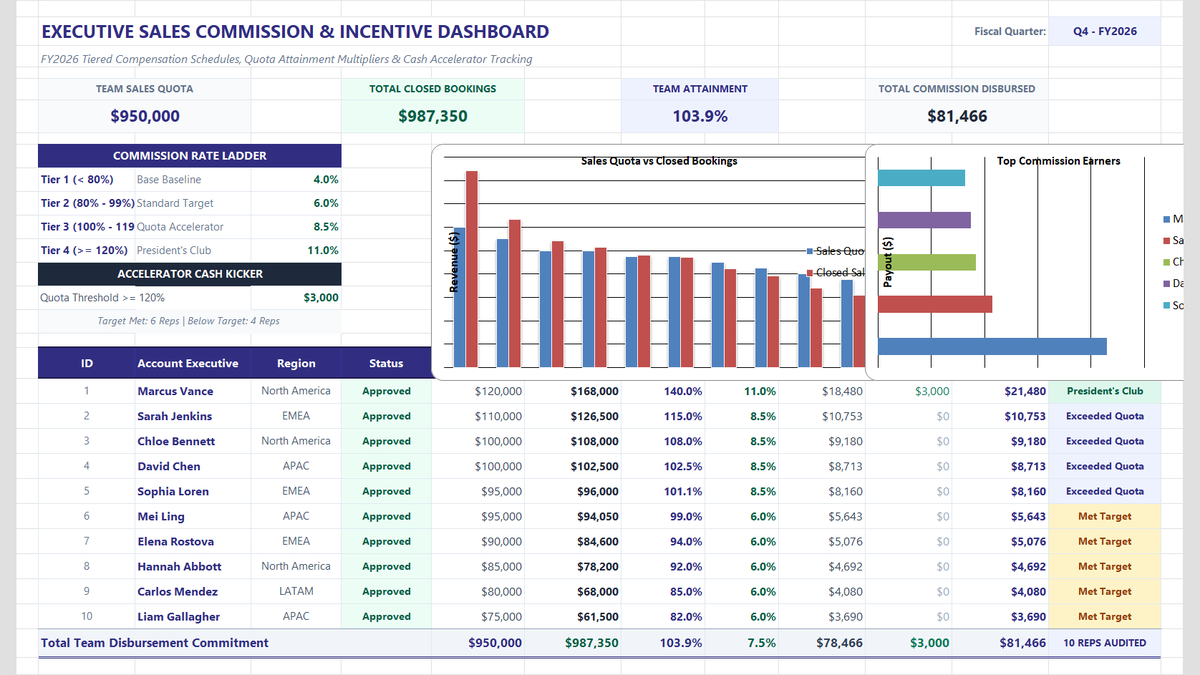
In this exercise, you will build an Executive Sales Commission & Incentive Dashboard in Excel. You will model a 10-person sales team across North America, EMEA, and APAC, assign tiered rates from 4.0% to 11.0%, award cash kickers for overachievers, and summarize total quarterly payroll in minutes.
Commission Ladder & Compensation Data Dictionary
Our sales compensation model is organized into an executive summary block (rows 5 to 6), a four-tier commission rate ladder (rows 8 to 14), and a primary rep payout ledger across columns B through M (rows 17 to 28). Below is the complete data dictionary.
| Column | Field Name | Formula / Type | Default Format | Workplace Meaning & Modeling Rule |
|---|---|---|---|---|
| B | ID | Integer Sequence | Center Align | Unique rep identification number (1 through 10). |
| C | Account Executive | Text | Left Align (Bold) | Full name of the sales representative. |
| D | Region | Text | Left Align | Assigned sales territory (North America, EMEA, APAC, LATAM). |
| F | Sales Quota | Numeric Baseline | Currency ($#,##0) | Assigned quarterly revenue booking target for the rep. |
| G | Closed Sales | Numeric Revenue | Currency ($#,##0) | Actual closed-won GAAP bookings delivered during the quarter. |
| H | Attainment | =Closed Sales / Quota | Percentage (0.0%) | =G18/F18. Quota attainment ratio. |
| I | Tier Rate | Nested IF Logic | Percentage (0.0%) | Tier 1 (<80%)=4%, Tier 2 (80-99%)=6%, Tier 3 (100-119%)=8.5%, Tier 4 (≥120%)=11%. |
| J | Base Comm ($) | =Closed Sales * Tier Rate | Currency ($#,##0) | =G18*I18. Core variable payout earned on closed sales. |
| K | Accelerator Kicker ($) | =IF(H18>=1.2, 3000, 0) | Currency ($#,##0) | One-time $3,000 cash bonus for President's Club members hitting ≥120% quota. |
| L | Total Payout ($) | =Base Comm + Accelerator | Currency ($#,##0) | =J18+K18. Final gross commission amount disbursed to payroll. |
| M | Performance | Status Lookup Logic | Color-Coded Badge | President's Club, Exceeded Quota, Met Target, or Below Quota. |
Building Your Tiered Commission Calculator Step by Step
Follow these three focused steps to construct your sales commission calculator. We will calculate tiered multipliers and cash kickers, build automated color-coded status badges, and review team totals.
3.1Step 1: Calculating Tier Rates & Quota Accelerators
In competitive sales organizations, commission rates increase as reps surpass higher quota hurdles. This motivates reps to keep selling even after hitting their baseline target.
In Row 18, Marcus Vance was assigned a $120,000 quota (cell F18) and closed an impressive $168,000 in bookings (cell G18). His attainment in cell H18 is =G18/F18, returning 140.0%.
To calculate his commission rate, click cell I18 and enter the nested tier formula:
=IF(H18>=1.2, 0.11, IF(H18>=1.0, 0.085, IF(H18>=0.8, 0.06, 0.04)))
Because Marcus reached 140%, Excel assigns the top 11.0% tier rate. His base commission in cell J18 is =G18*I18 ($18,480).
Furthermore, reps who achieve ≥120% earn a $3,000 President's Club cash kicker. In cell K18, enter: =IF(H18>=1.2, 3000, 0). Combining both produces a total payout of $21,480 in cell L18.
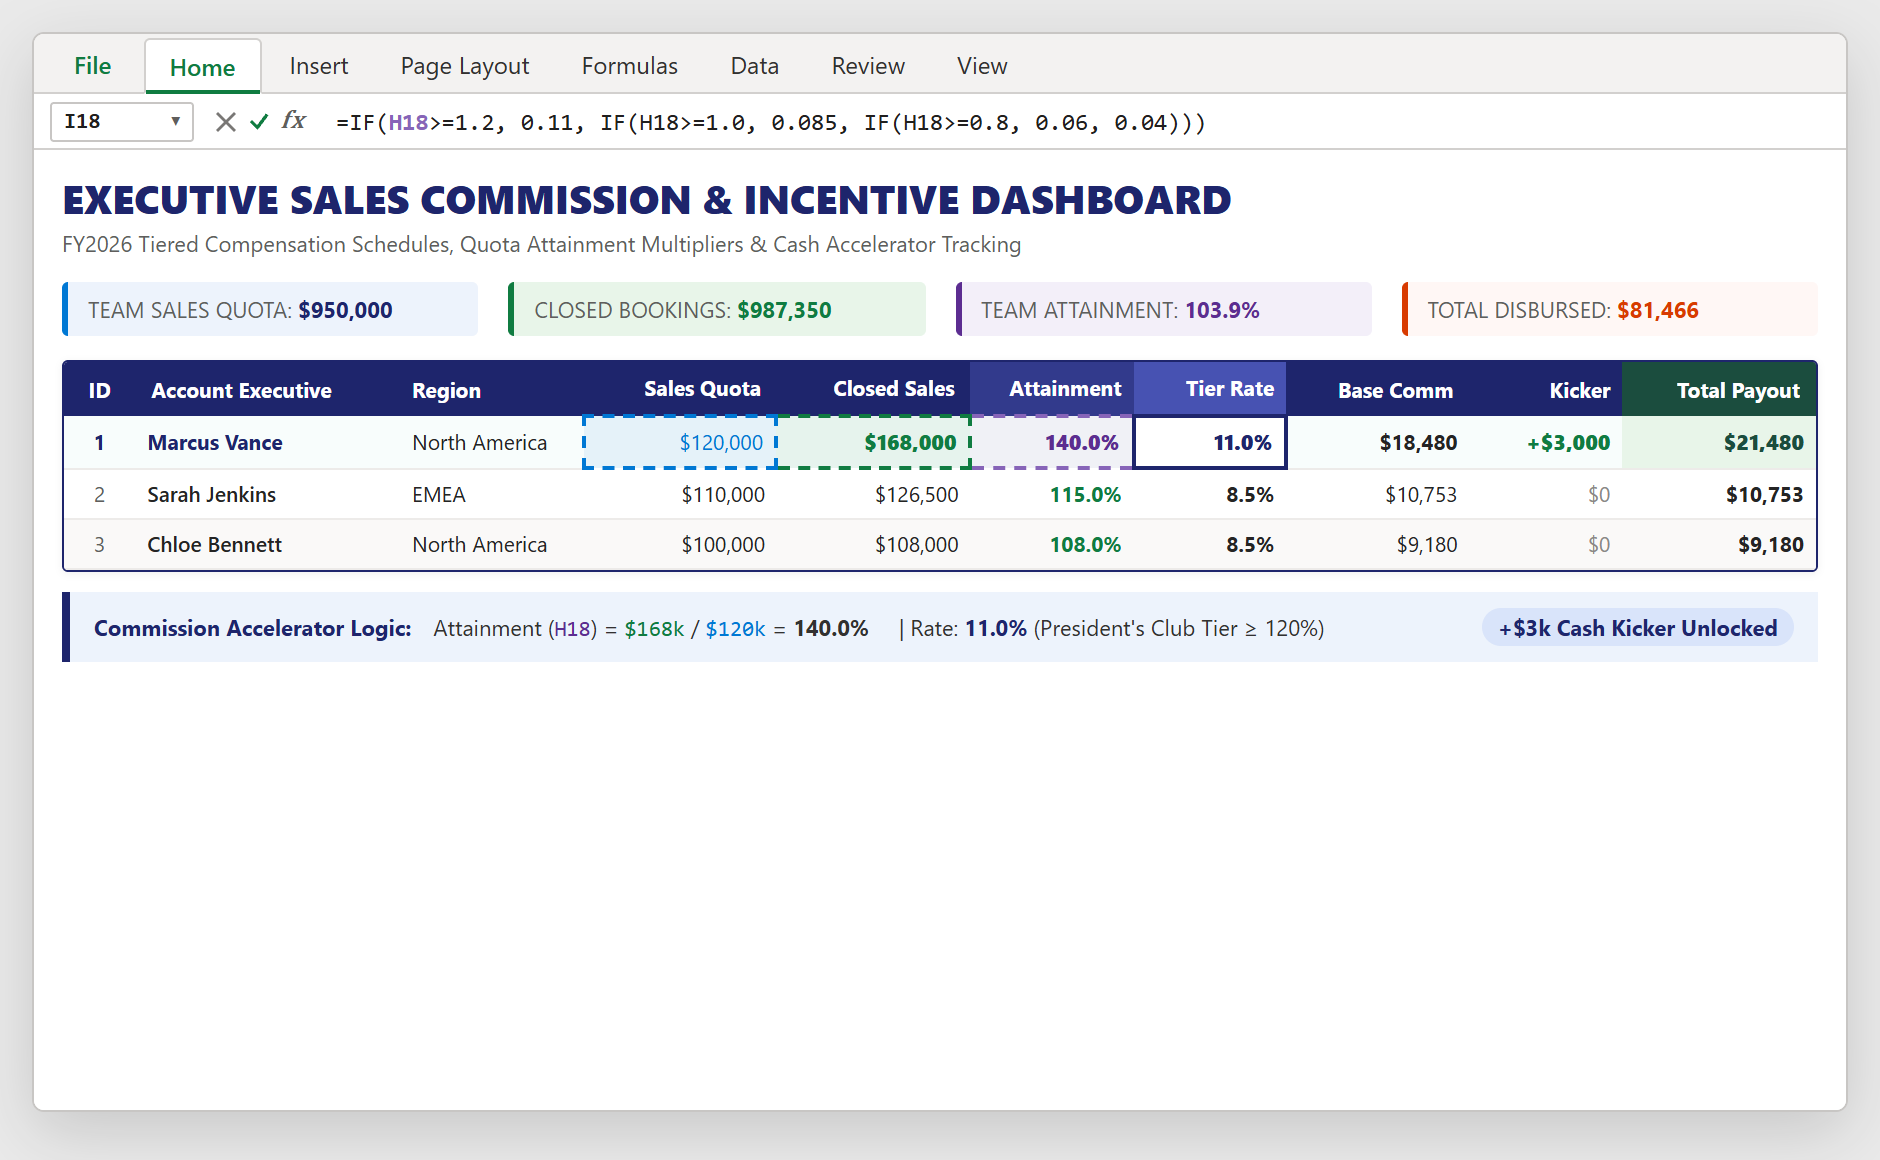
Figure 1: Formulating tiered commission percentages and cash accelerator bonuses in cell I18.
3.2Step 2: Coloring Performance Badges with Rules Manager
Sales leaders need to see team performance at a glance during quarterly reviews. In column M, we assign readable text tags: "President's Club", "Exceeded Quota", "Met Target", and "Below Quota".
To make these categories stand out, highlight cells M18 through M27. On the Home tab, click Conditional Formatting, then click Manage Rules.
Create three distinct text rules:
1. Cell Value equal to "President's Club" -> Soft green fill (#E8F5E9) with dark green text (#1B5E20).
2. Cell Value equal to "Exceeded Quota" -> Soft blue fill (#E8EAF6) with dark navy text (#1A237E).
3. Cell Value equal to "Met Target" -> Soft amber fill (#FFF8E1) with warm brown text (#F57F17).
Click Apply, then OK. The status column now instantly highlights top performers in soothing, modern pastel tones.
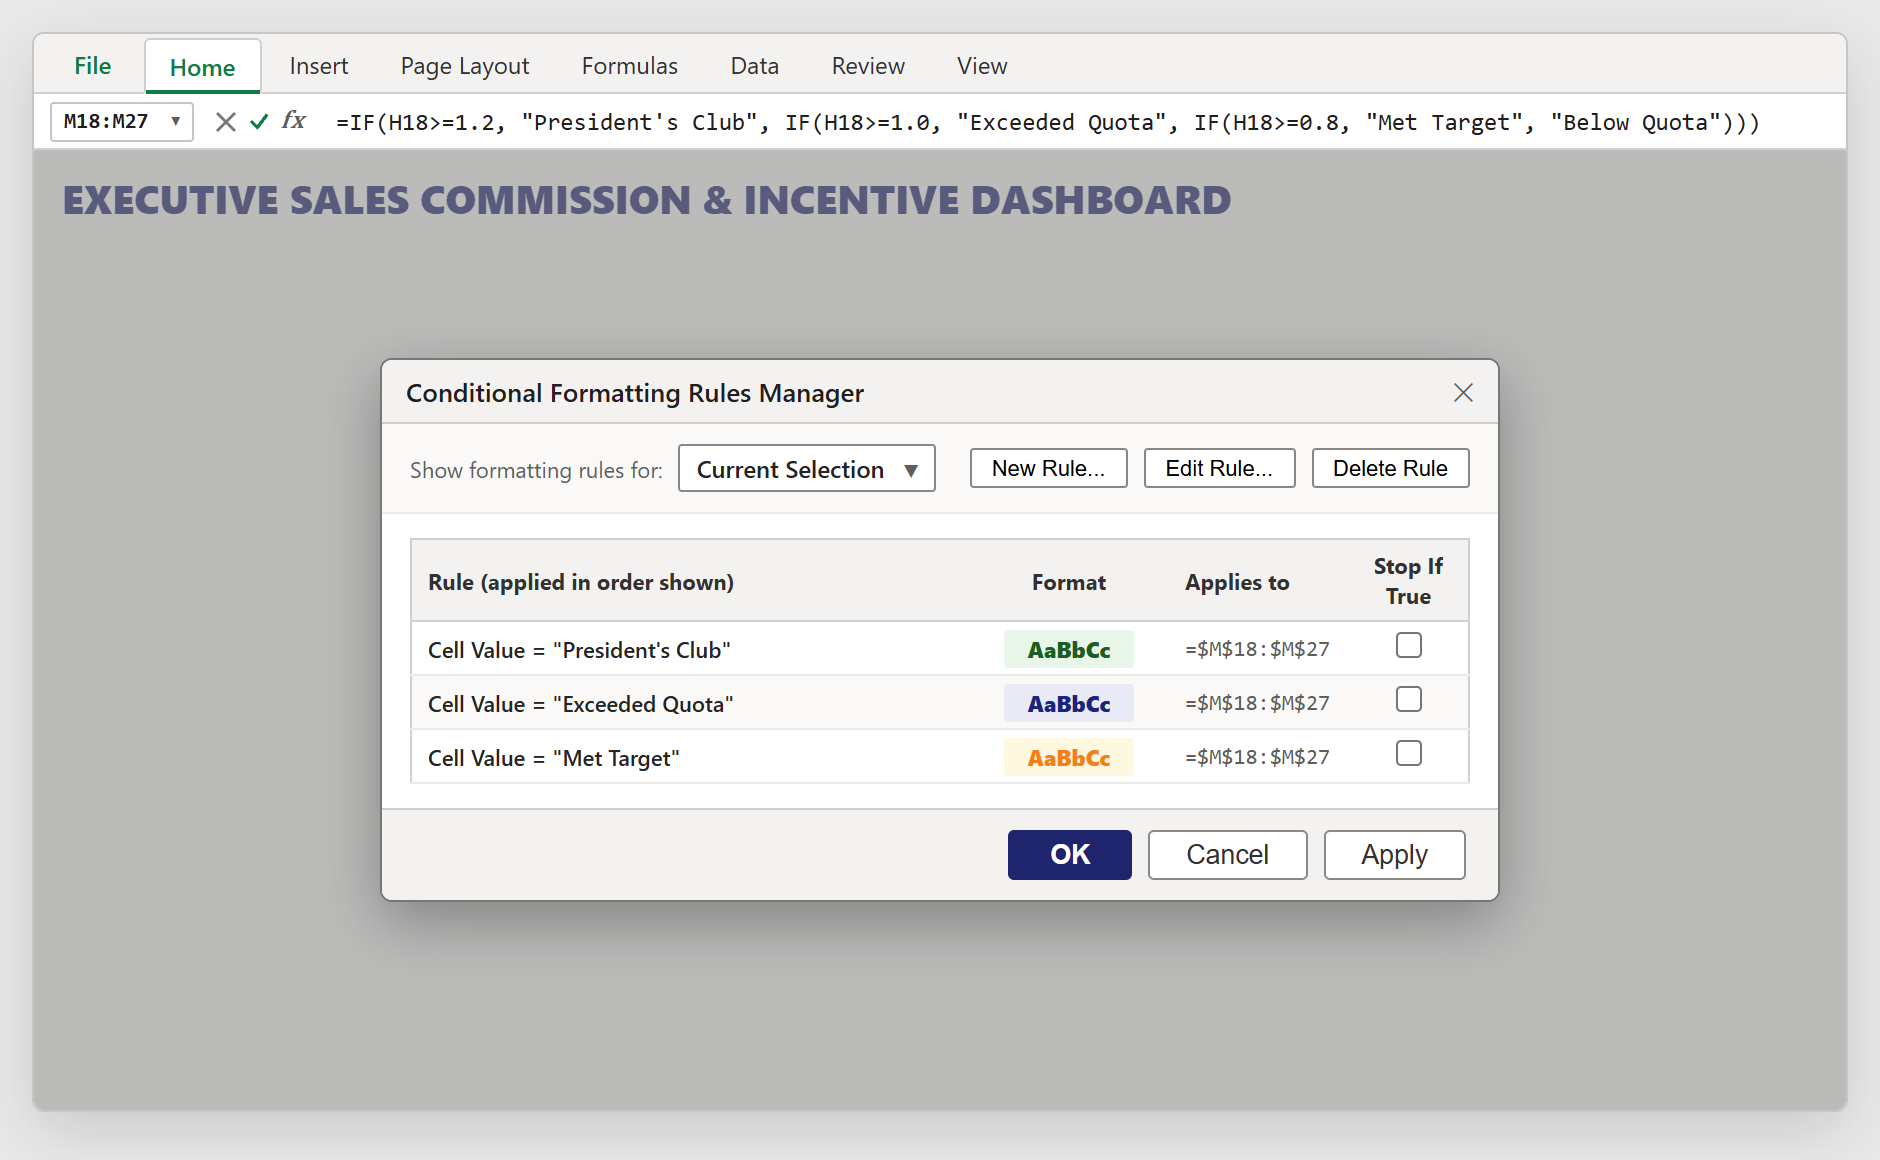
Figure 2: Configuring automated performance tier highlight rules in Excel Rules Manager.
3.3Step 3: Auditing the Executive Compensation Dashboard
At the bottom of the table, Row 28 aggregates total team commitment across all 10 representatives.
Team sales quota was $950,000, while the team delivered $987,350 in closed bookings (103.9% team attainment). Total base commissions amount to $78,466, plus $3,000 in accelerator kickers, resulting in an exact total disbursement commitment of $81,466.
In the top KPI summary cards, leadership can verify that 6 out of 10 reps met or exceeded target, while average commission rate averaged a sustainable 7.5% across the entire company pipeline.
The accompanying dual charts illustrate sales vs quota attainment by rep alongside a ranking of top commission earners.
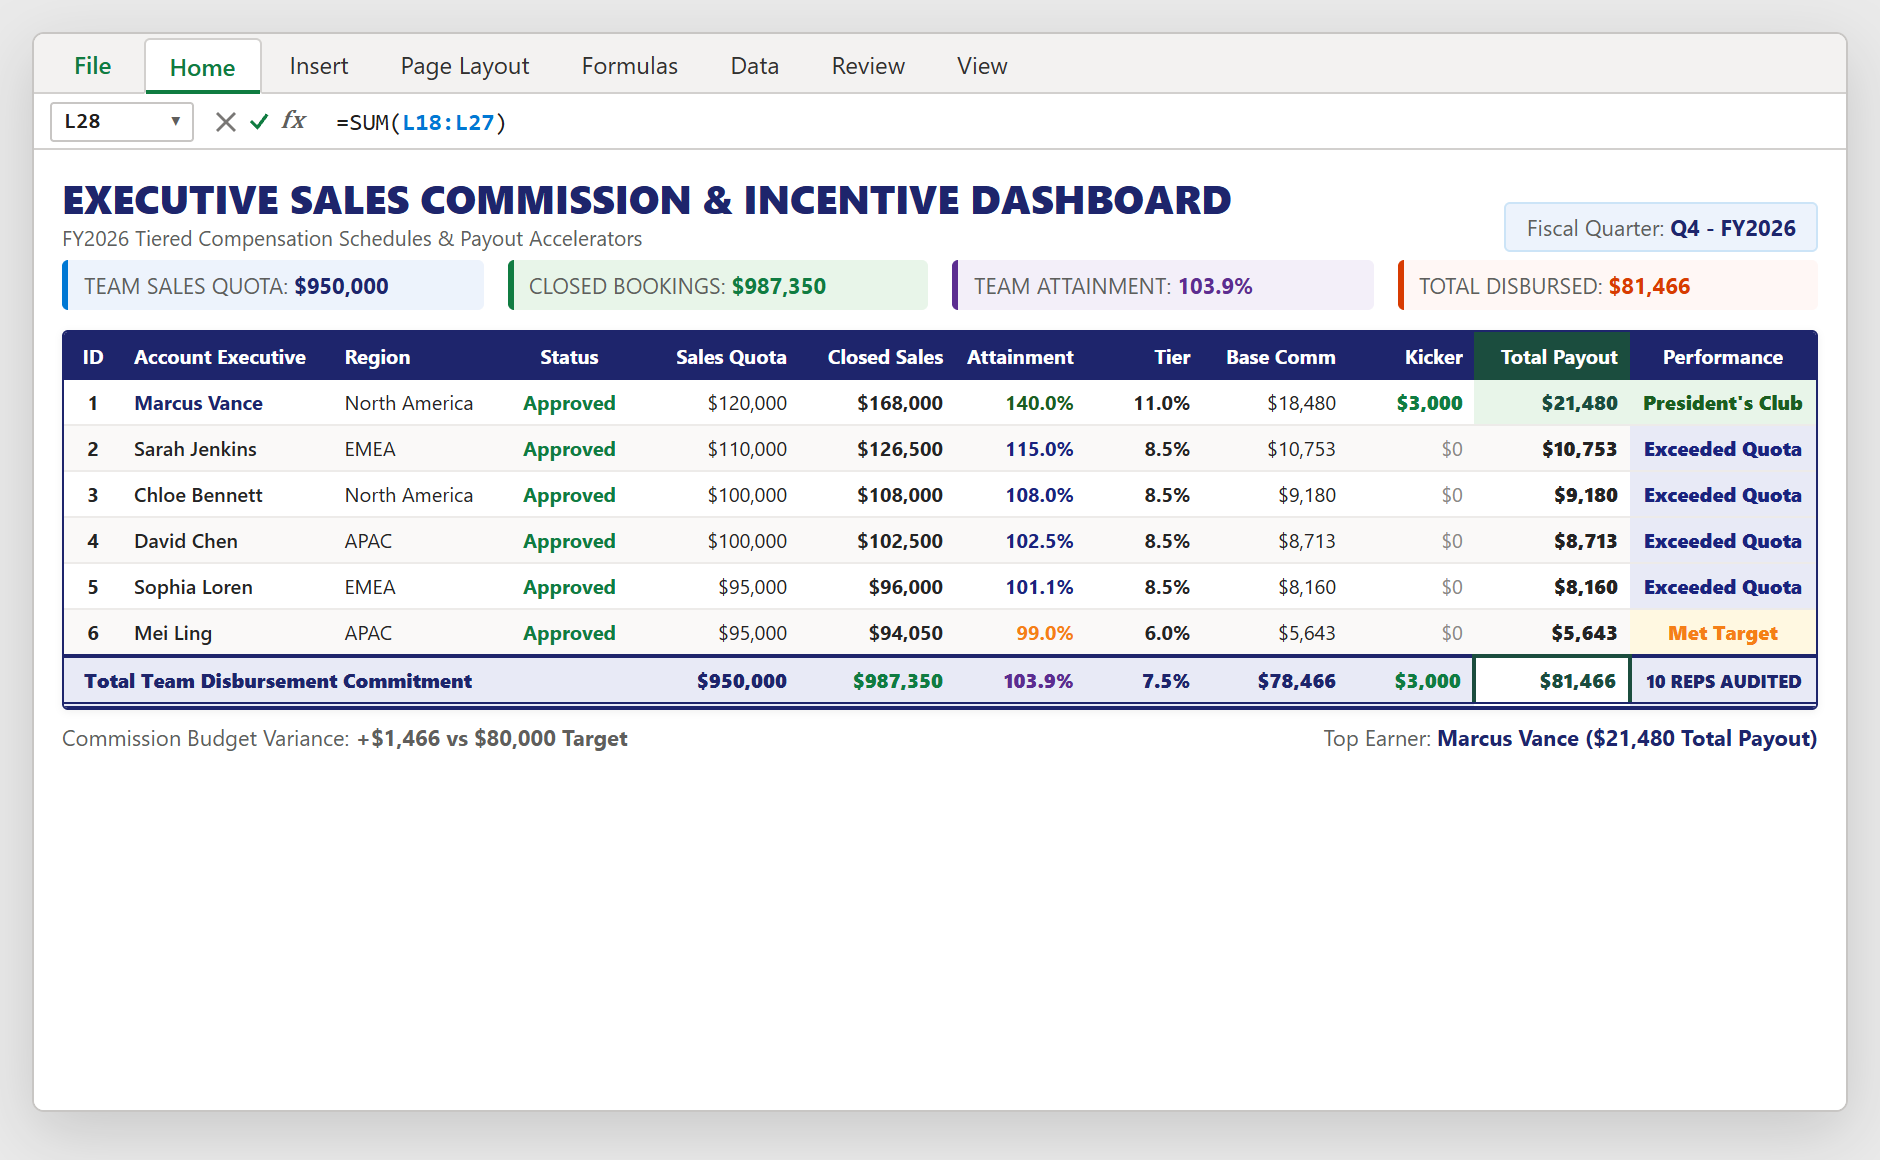
Figure 3: Complete executive sales commission and incentive dashboard matching our workbook solution.
Sales Ops Best Practices: Dispute Prevention & Payout Approvals
To ensure smooth commission sign-offs at the end of each fiscal quarter, keep these three operational practices in mind:
1. The One-Week Review Window: Publish draft commission summaries to sales reps five business days before payroll closes. This gives reps time to verify deal crediting and submit documentation for split deals without delaying payday.
2. Explicit Clawback Policies: Ensure rep employment agreements state clearly what happens if a customer cancels or refunds an annual contract within 90 days of closing.
3. Lock Formula Cells: Before sharing the sheet with regional managers for approval, lock columns H through L using Excel Sheet Protection so rates and multipliers cannot be altered accidentally.

Spreadsheet educator and web developer passionate about hands-on interactive spreadsheet practice.
Related Practical Exercises
Explore more hands-on spreadsheet models with downloadable practice workbooks.
 Sales
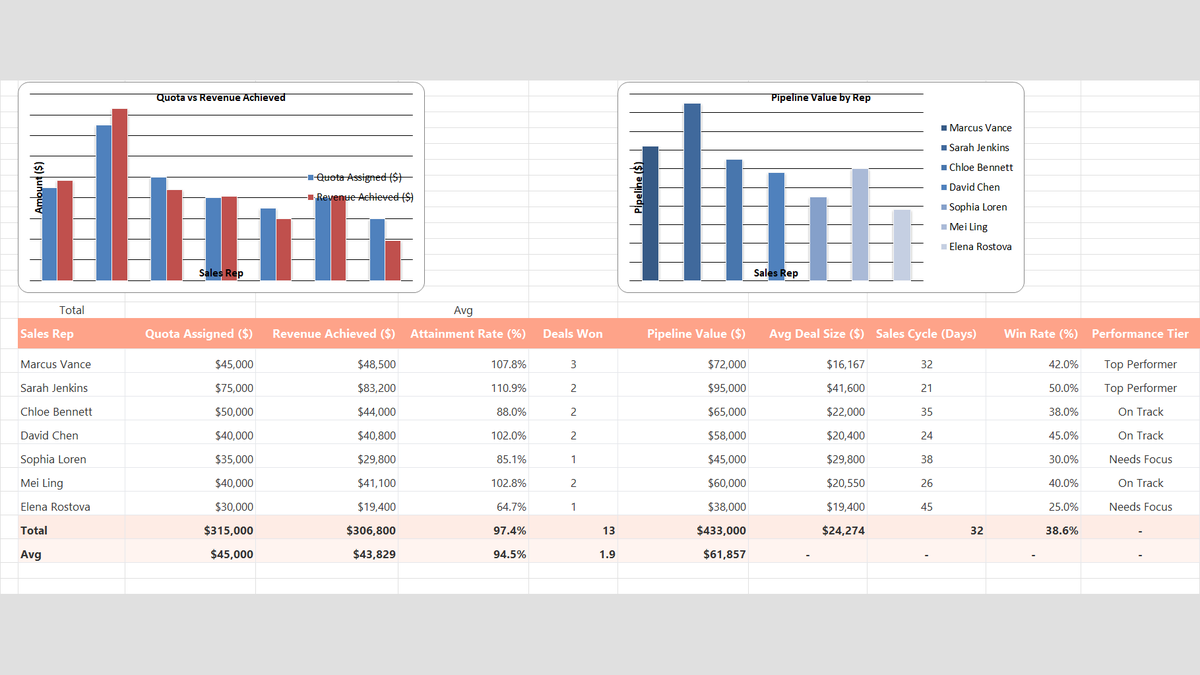
Sales Rep Performance Tracker Excel Template
Build a practical sales rep performance tracker in Microsoft Excel to measure individual quota attainment, average deal size, win rates, and team pipeline velocity.
 Sales
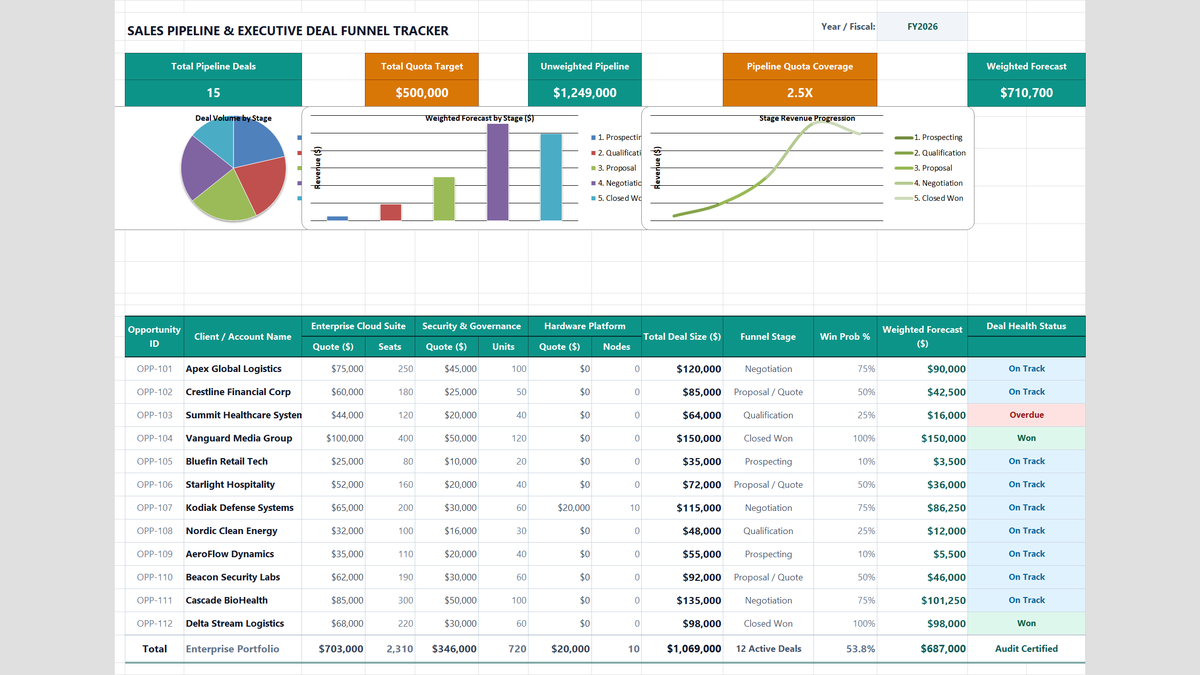
Sales Pipeline Tracker Excel Template
Learn how to construct an enterprise B2B sales pipeline tracker in Microsoft Excel featuring multi-product cross-sell quotes, weighted expected value forecasting, quota coverage ratios, and funnel conversion rollups.
 Finance
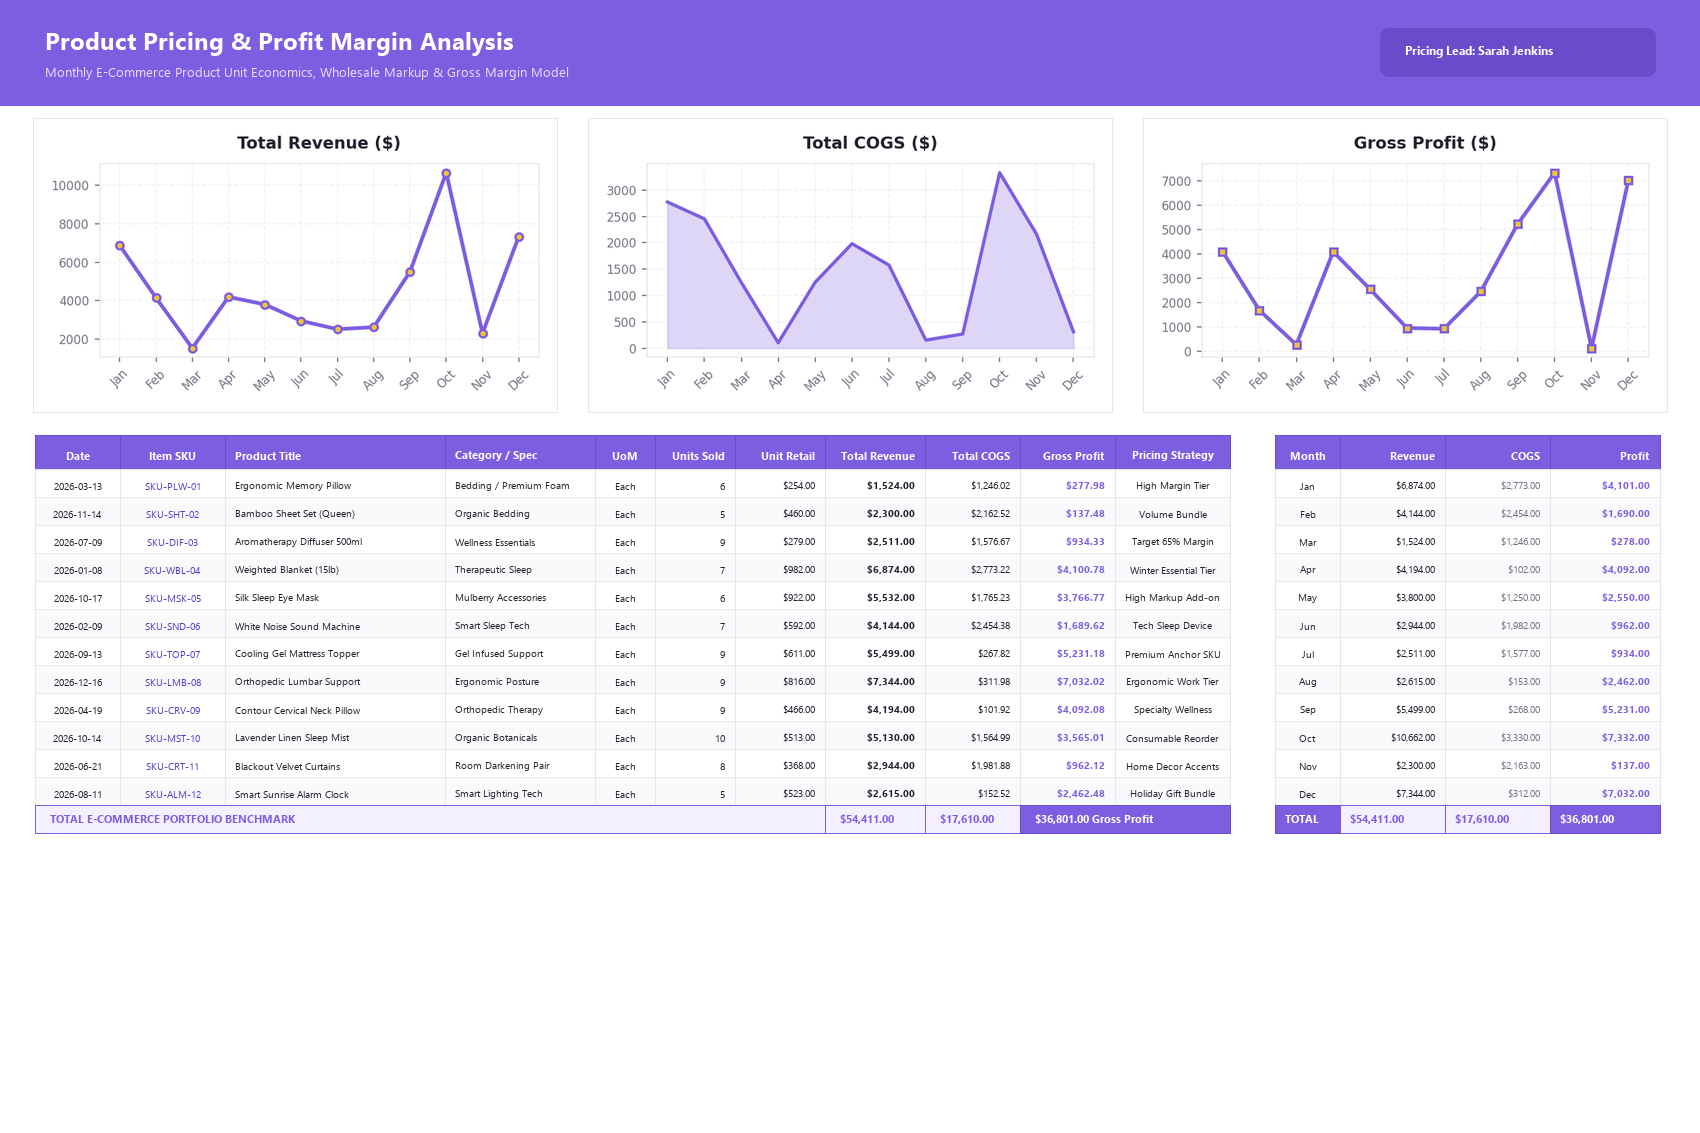
Product Pricing Calculator Excel Template
Build a practical product pricing and profit margin calculator in Microsoft Excel to track unit revenue, cost of goods sold, and monthly SKU profitability.
 Productivity
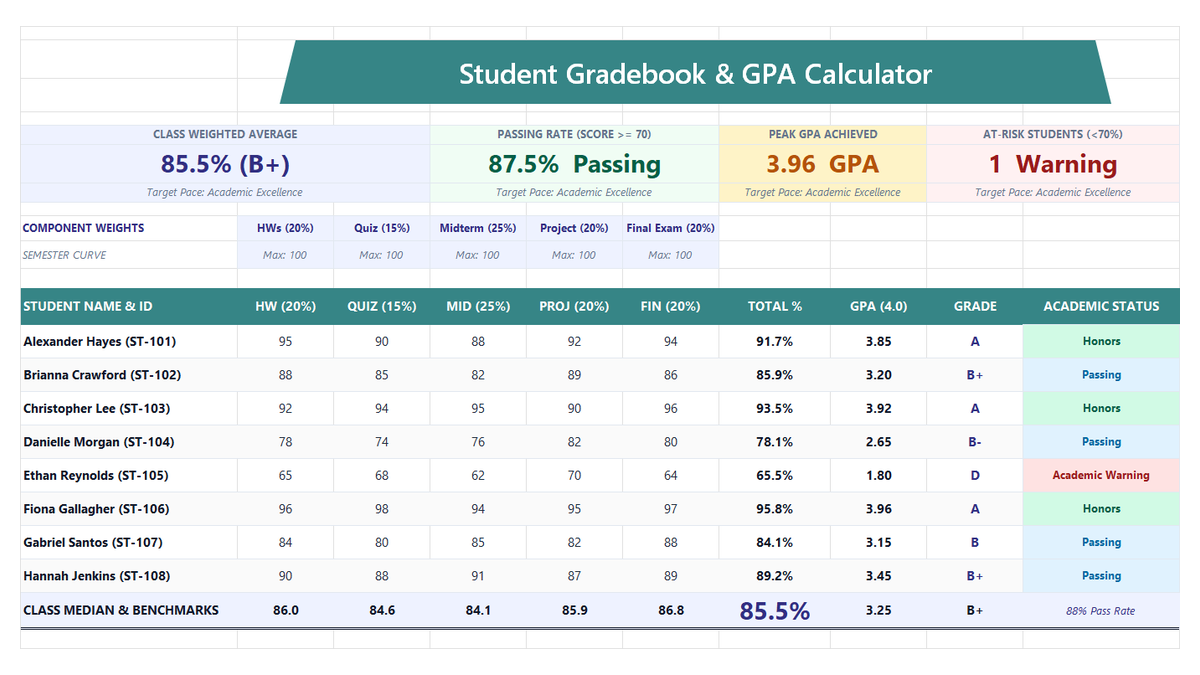
Student Gradebook GPA Calculator Excel Template
Build a practical student gradebook and semester GPA calculator in Microsoft Excel to compute weighted course grades, letter conversions, and class performance benchmarks.
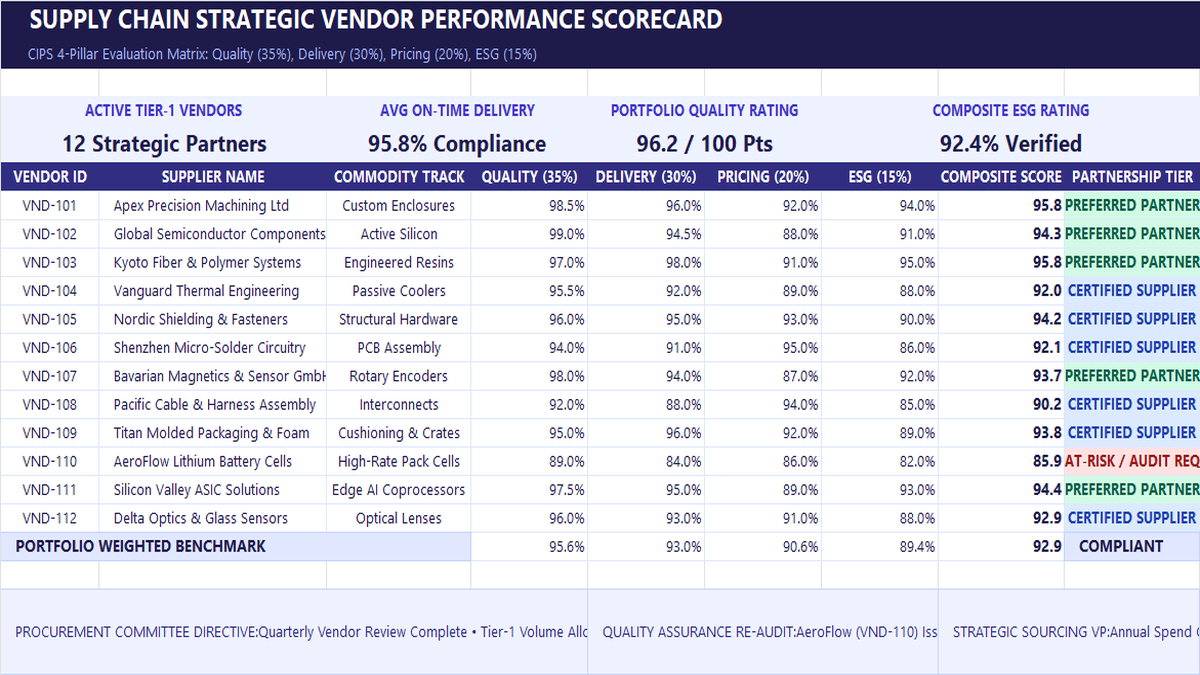 Operations
Vendor Performance Scorecard Excel Template
Learn strategic vendor evaluation in Microsoft Excel. Build a CIPS-compliant 4-pillar scorecard weighting Quality (35%), Delivery (30%), Pricing (20%), and ESG (15%). Automate weighted composite scores with SUMPRODUCT, calculate portfolio OTIF delivery, and establish tier-based purchase order allocations.
Discussion
Ask questions, share formula tips, or discuss alternative approaches with fellow spreadsheet builders.
Loading discussion...