Why Percentage Complete Does Not Tell the Whole Story
When project leads report that a software milestone is "75% complete", executives usually breathe a sigh of relief. But what if the team has already spent 110% of the entire project budget to get there? Without comparing budget spent against actual work delivered, traditional progress updates give teams a false sense of security.
Earned Value Management (EVM) solves this problem by uniting scope, schedule, and cost into one clear measurement system. Instead of simply asking "how much money did we spend?", EVM asks: "how much real progress did those dollars actually buy?"
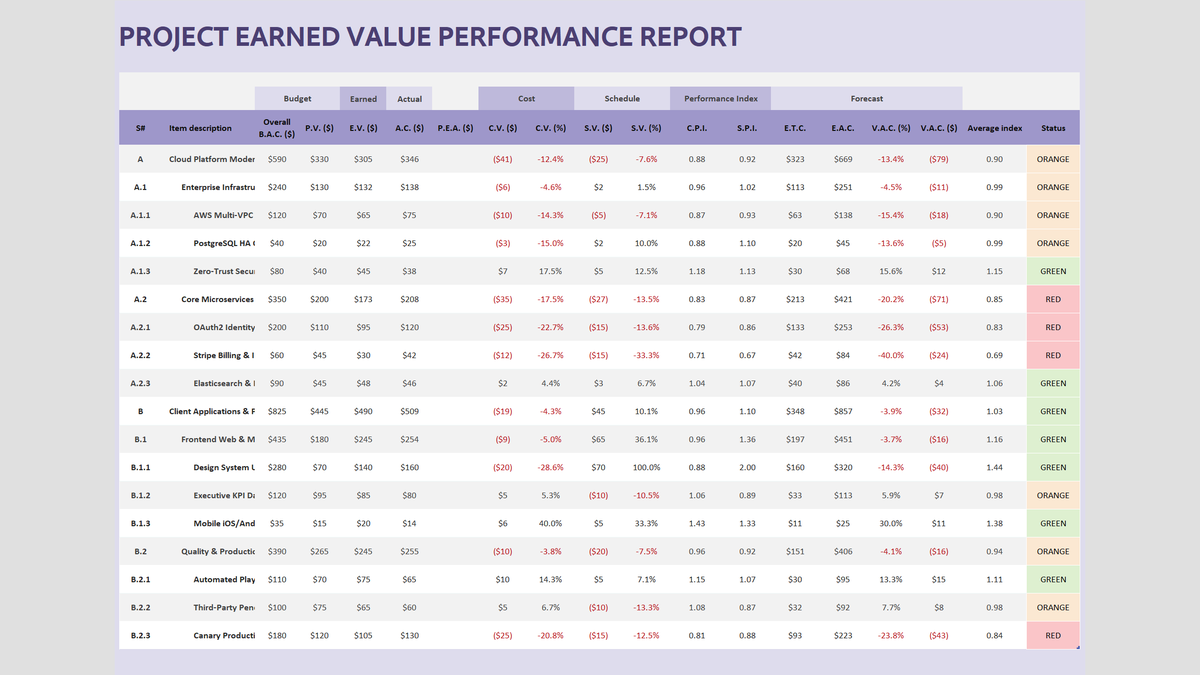
In this exercise, you will build an executive Earned Value Performance Report in Excel. You will calculate cost variances, schedule performance indices, and final projected costs so your project steering committee can fix budget leaks weeks before delivery deadlines.
Earned Value Metrics & Table Data Dictionary
Our project tracker organizes tasks under a clean Work Breakdown Structure (WBS). Baseline inputs occupy columns E through H, variance formulas span columns J through M, performance indices reside in N and O, and final forecasts sit in columns P through U. Below is the complete data dictionary.
| Column | Metric Name | Formula / Type | Default Format | Workplace Meaning & Rule |
|---|---|---|---|---|
| C | WBS Code (S#) | Text Code | Center Align | Hierarchical task identifier (e.g. A.1.1, A.1.2). |
| D | Item Description | Text | Left Align | Deliverable name or engineering work package. |
| E | Overall BAC ($) | Numeric Baseline | Currency ($#,##0) | Budget at Completion. Total authorized budget for the task. |
| F | Planned Value (PV) | Numeric Baseline | Currency ($#,##0) | Value of work scheduled to be completed by today date. |
| G | Earned Value (EV) | Numeric Progress | Currency ($#,##0) | Budgeted value of the work actually finished so far. |
| H | Actual Cost (AC) | Numeric Expense | Currency ($#,##0) | Total real money spent completing the work to date. |
| J | Cost Variance (CV) | =EV - AC | Currency ($#,##0) | Positive means under budget; negative in parentheses means over budget. |
| L | Schedule Variance (SV) | =EV - PV | Currency ($#,##0) | Positive means ahead of schedule; negative means behind schedule. |
| N | Cost Performance Index (CPI) | =IFERROR(EV/AC, 0) | 0.00 Decimal | Cost efficiency. Values above 1.0 mean good; below 1.0 mean budget burn. |
| O | Schedule Performance Index (SPI) | =IFERROR(EV/PV, 0) | 0.00 Decimal | Time efficiency. Values above 1.0 mean ahead of time; below 1.0 mean delays. |
| Q | Estimate at Completion (EAC) | =IFERROR(BAC/CPI, 0) | Currency ($#,##0) | Expected final total project cost based on current spending rate. |
| U | Project Health Status | Lookup Status | Color Badge | GREEN (Index >= 1.0), ORANGE (0.90 to 0.99), or RED (< 0.90). |
Building Your Project EVM Tracker Step by Step
Follow these three focused steps to build your project performance report. We will calculate core variances, set up visual color alerts for struggling tasks, and forecast final project costs.
3.1Step 1: Calculating Cost & Schedule Variances
Every EVM calculation begins by comparing Earned Value against your two reference baselines: Actual Cost and Planned Value.
In task A.1.1 (AWS Multi-VPC Architecture), our team completed $65k of earned value (cell G7). However, the engineering invoices totaled $75k in actual costs (cell H7), while the project plan expected $70k by this date (cell F7).
To calculate Cost Variance, click cell J7 and enter: =[@[E.V. ($)]]-[@[A.C. ($)]] (or =G7-H7). Excel calculates ($10) in red, indicating that the task is currently $10k over budget.
Next, calculate Schedule Variance in cell L7: =[@[E.V. ($)]]-[@[P.V. ($)]] (or =G7-F7). Excel calculates ($5), showing that deliverable progress is $5k behind our schedule baseline.
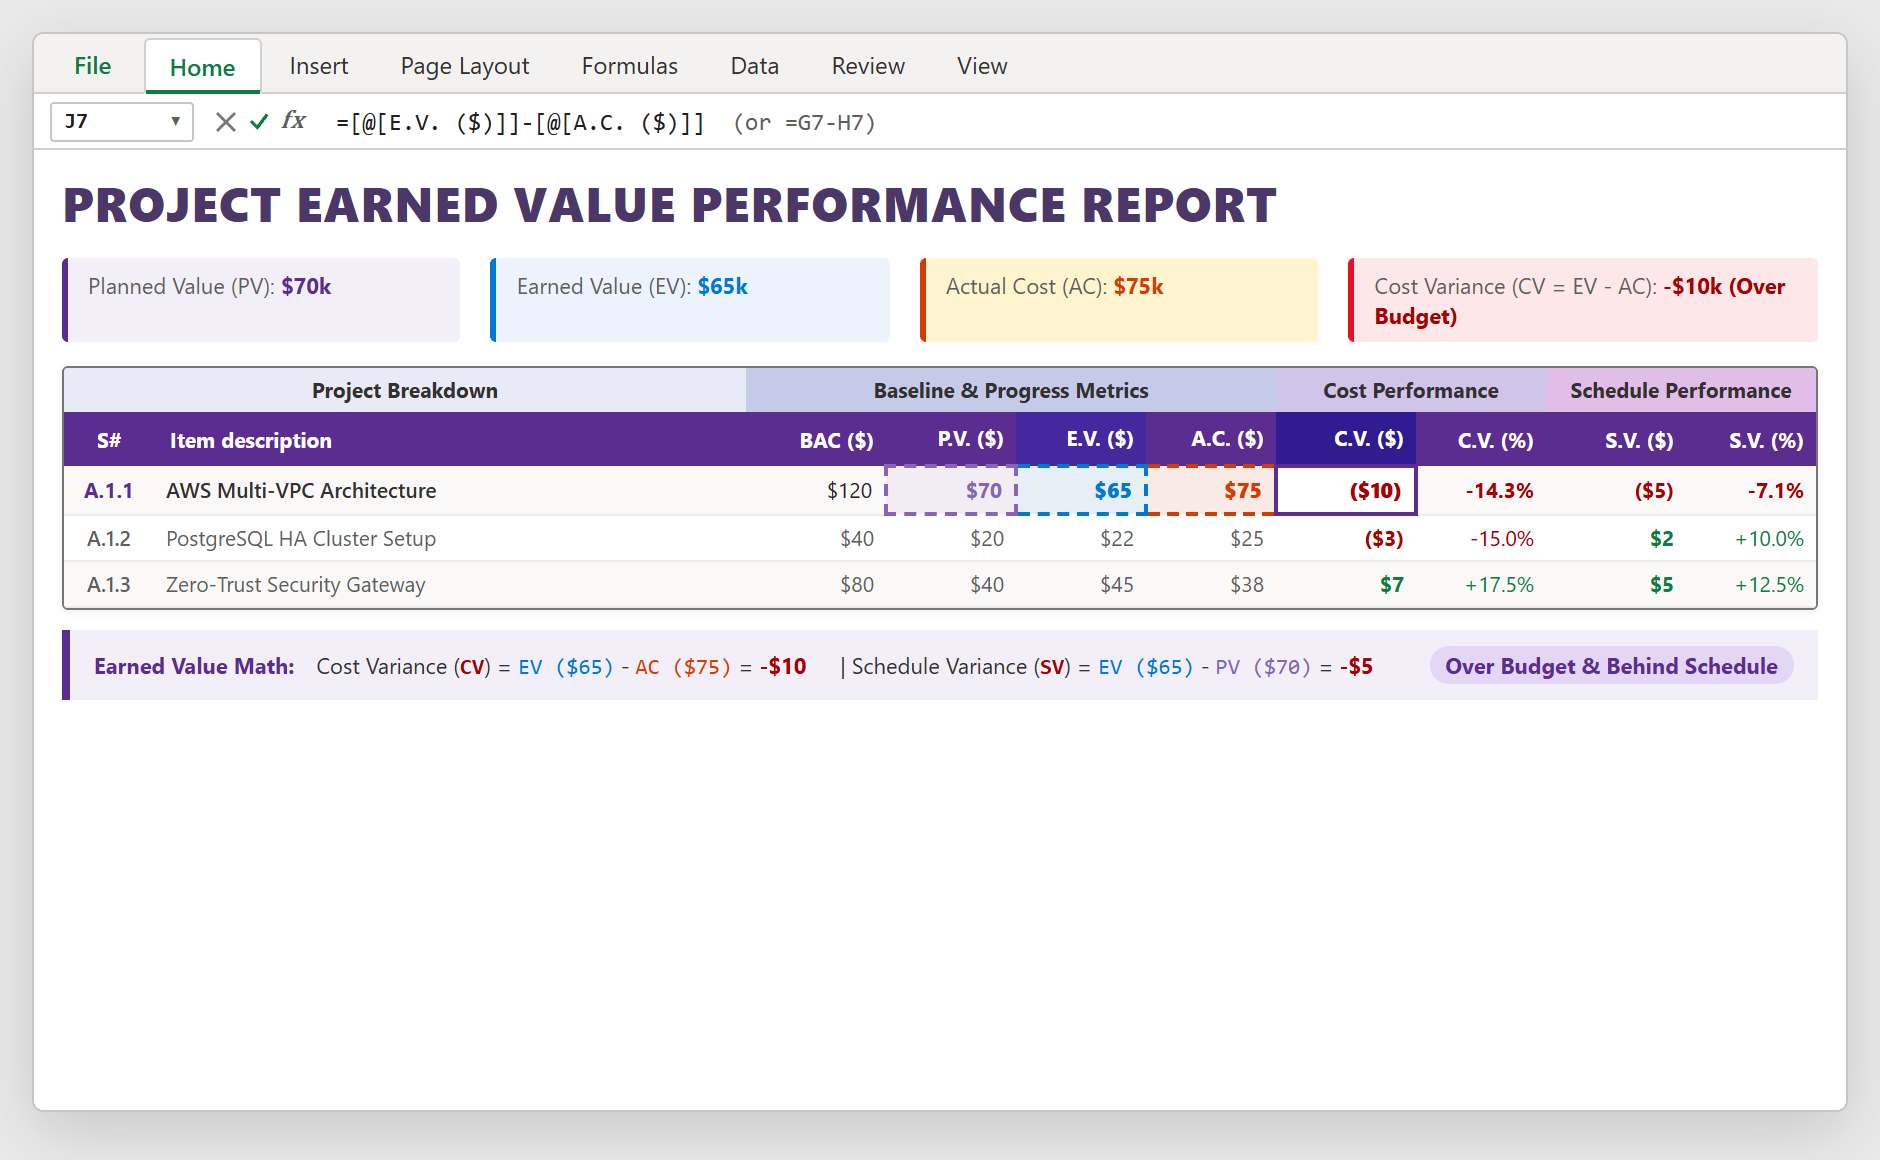
Figure 1: Calculating Cost Variance (CV = EV - AC) and Schedule Variance (SV = EV - PV) in Excel.
3.2Step 2: Highlighting Under-performing Tasks with Rules
Dollars tell you how much you are off, but ratios tell you how efficiently your team is working. The Cost Performance Index (CPI = EV / AC) and Schedule Performance Index (SPI = EV / PV) normalize performance onto a standard scale where 1.0 represents perfection.
In column N, cell N7 calculates: =IFERROR([@[E.V. ($)]]/[@[A.C. ($)]], 0), returning 0.87. This means that for every dollar spent on cloud architecture, the project only realized 87 cents of progress.
To instantly flag struggling deliverables during weekly status meetings, highlight columns N and O (cells N7:O23). Go to the Home tab, click Conditional Formatting, and select New Rule.
Choose "Format only cells that contain", set the condition to "less than", and type 1.0. Choose a soft red fill with dark red text and click OK. Now, any task falling behind schedule or burning through funds glows red automatically.
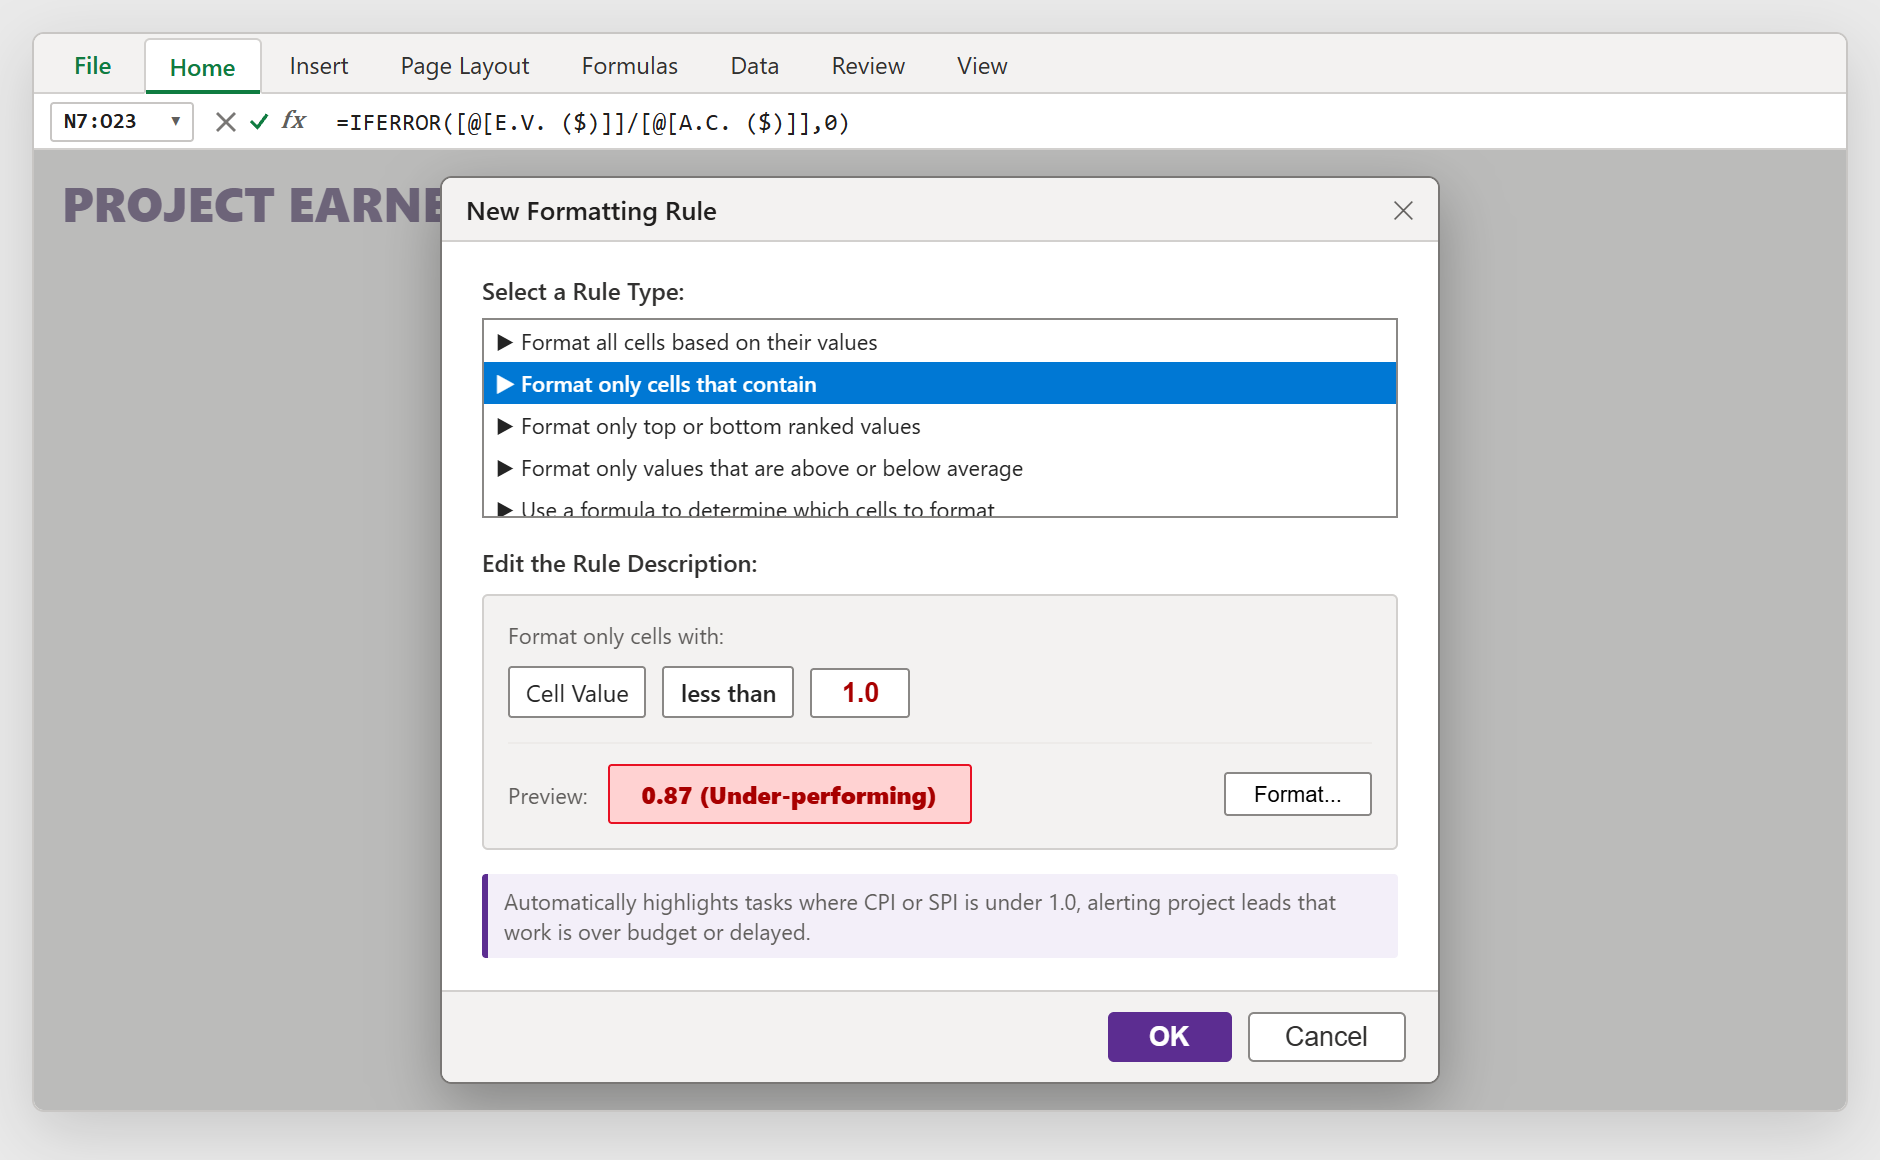
Figure 2: Configuring automatic conditional formatting alerts for CPI and SPI values below 1.0.
3.3Step 3: Forecasting Final Costs with EAC
The true power of EVM is forward-looking forecasting. If your team continues working at its current efficiency rate, how much will the deliverable cost when finished?
The Estimate at Completion (EAC) formula divides original budget by current efficiency: =BAC / CPI.
In cell Q7, enter: =IFERROR([@[Overall B.A.C. ($)]]/[@[C.P.I.]], 0). While the original budget was $120k, Excel projects a final cost of $138k ($18k overrun).
Looking across the entire Cloud Platform modernization initiative (Phase A), total budget is $590k, but the portfolio EAC reaches $669k. This objective calculation gives engineering managers concrete data to request budget adjustments or trim scope before funds run dry.
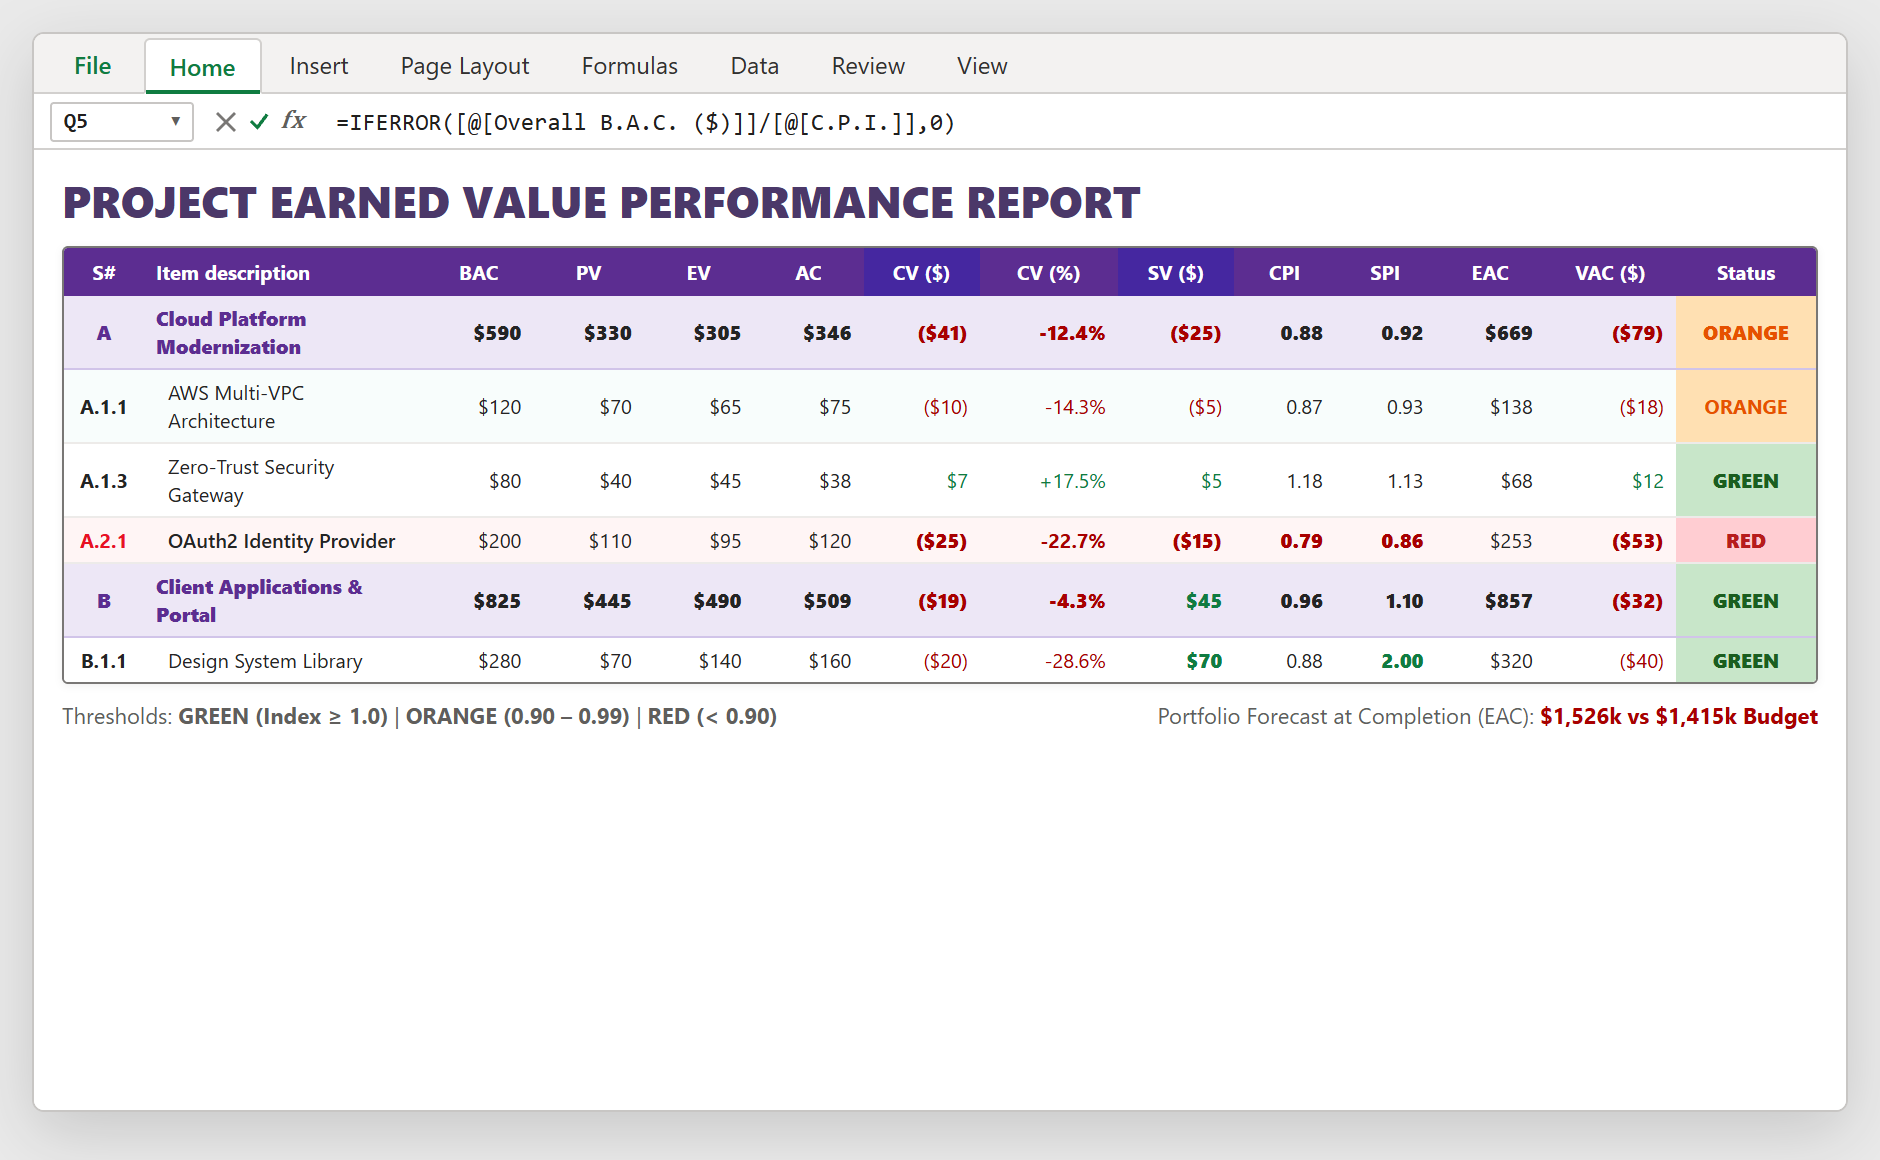
Figure 3: Full executive EVM performance report showing task progress, completion forecasts, and health badges.
Practical Recovery Steps for Delayed or Over-Budget Projects
When an EVM report highlights a red deliverable, project managers should take immediate corrective action:
1. Fast-Tracking vs Crashing: If SPI is below 0.90, explore whether upcoming dependencies can run in parallel (fast-tracking). Adding more staff (crashing) can accelerate delivery but almost always drives CPI lower.
2. Scope Descoping: On deliverables where EAC exceeds budget limits, meet with product stakeholders to trim non-essential user stories rather than compromising architecture quality.
3. Re-baselining Criteria: Only reset your baseline (BAC) if approved client change orders officially increase the funded project scope.

Spreadsheet educator and web developer passionate about hands-on interactive spreadsheet practice.
Related Practical Exercises
Explore more hands-on spreadsheet models with downloadable practice workbooks.
 Project Management
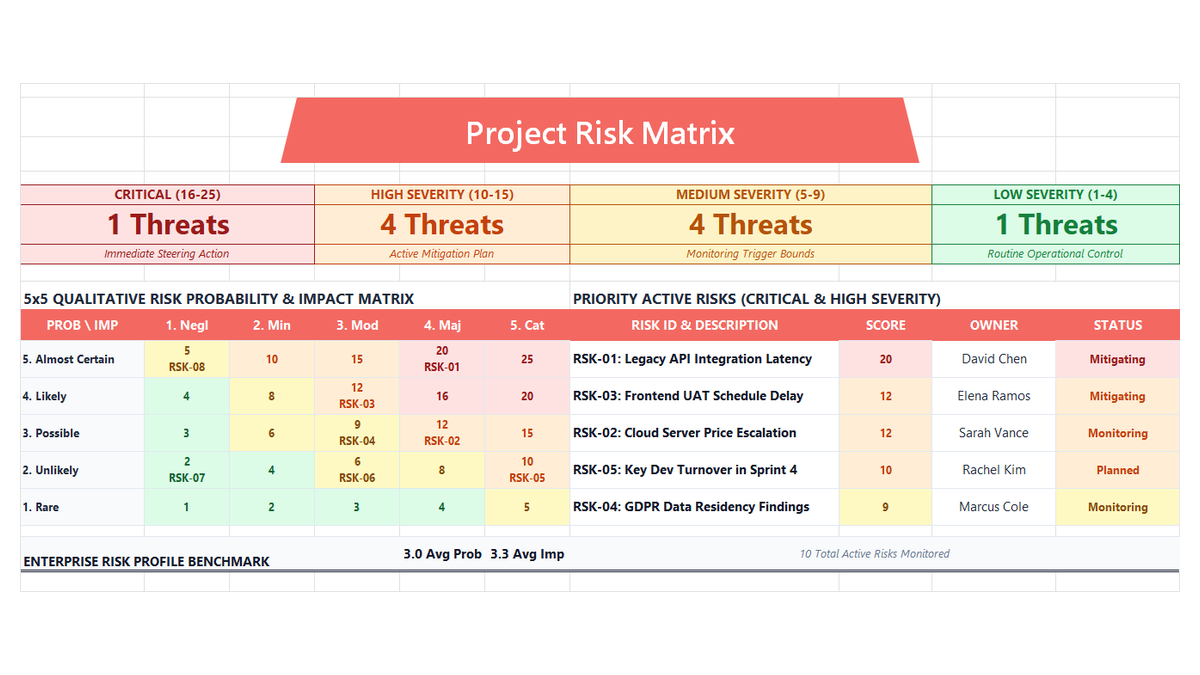
Project Risk Register Excel Template
Learn enterprise risk governance in Microsoft Excel. Build an ISO 31000 and PMBOK-compliant 5x5 qualitative risk heatmap, automate probability and impact scoring, engineer multi-tier severity formulas, and enforce accountability with data validation.
 Project Management
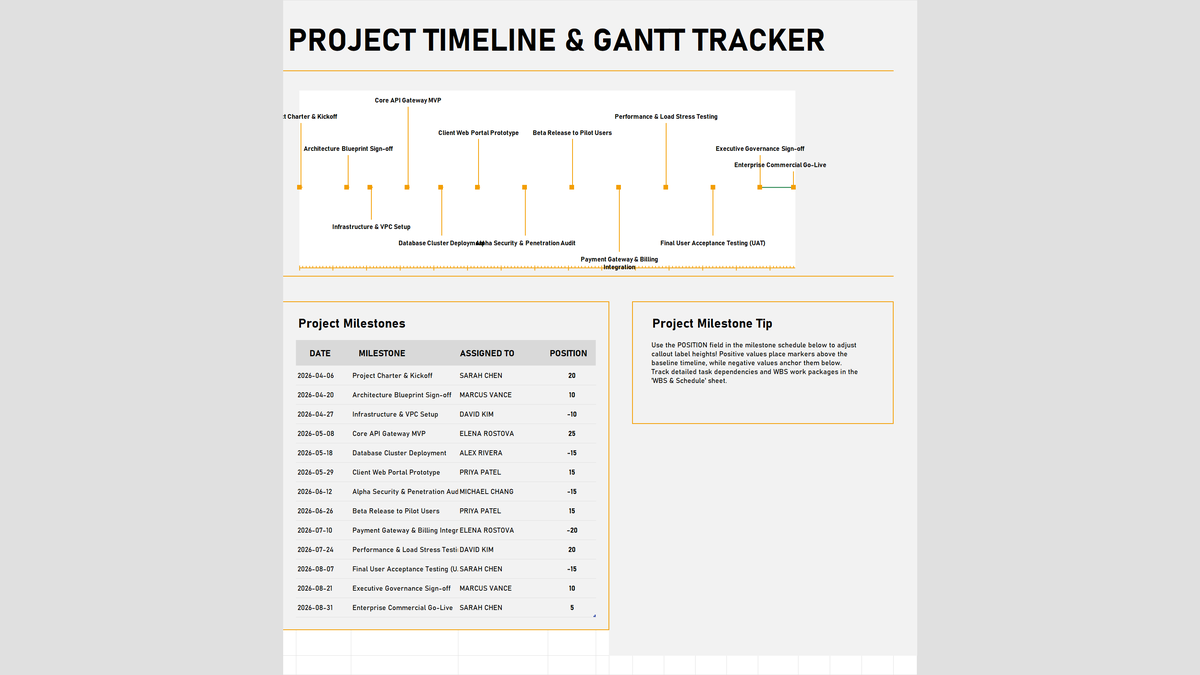
Project Timeline & Gantt Tracker Excel Template
Visualize project milestones, key delivery dates, and executive roadmaps in Microsoft Excel. Build an interactive timeline and milestone tracker featuring dynamic calendar year formulas with =DATE(YEAR(TODAY())), standard ISO date formatting, alternating label position controls, and roadmap chart visuals.
 Operations
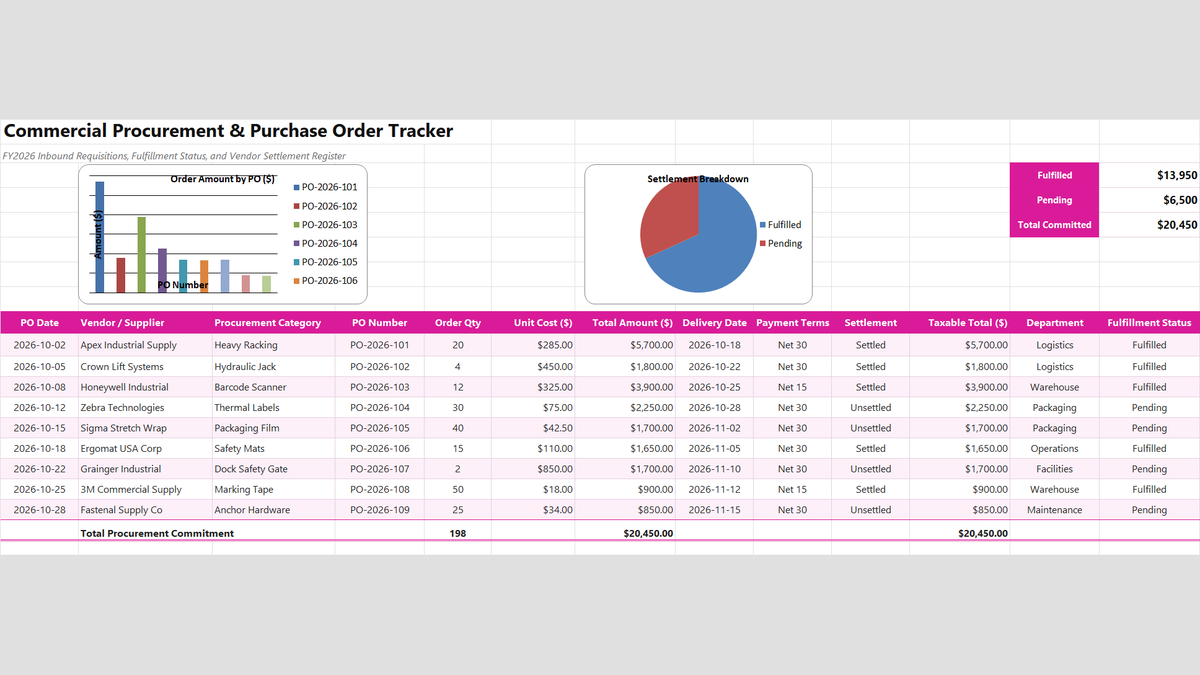
Purchase Order Generator & Tracker Excel Template
Learn how to engineer a commercial procurement and purchase order tracker in Microsoft Excel featuring line item commitment multiplication, vendor fulfillment status monitoring, and accounts payable settlement reconciliations.
 Human Resources
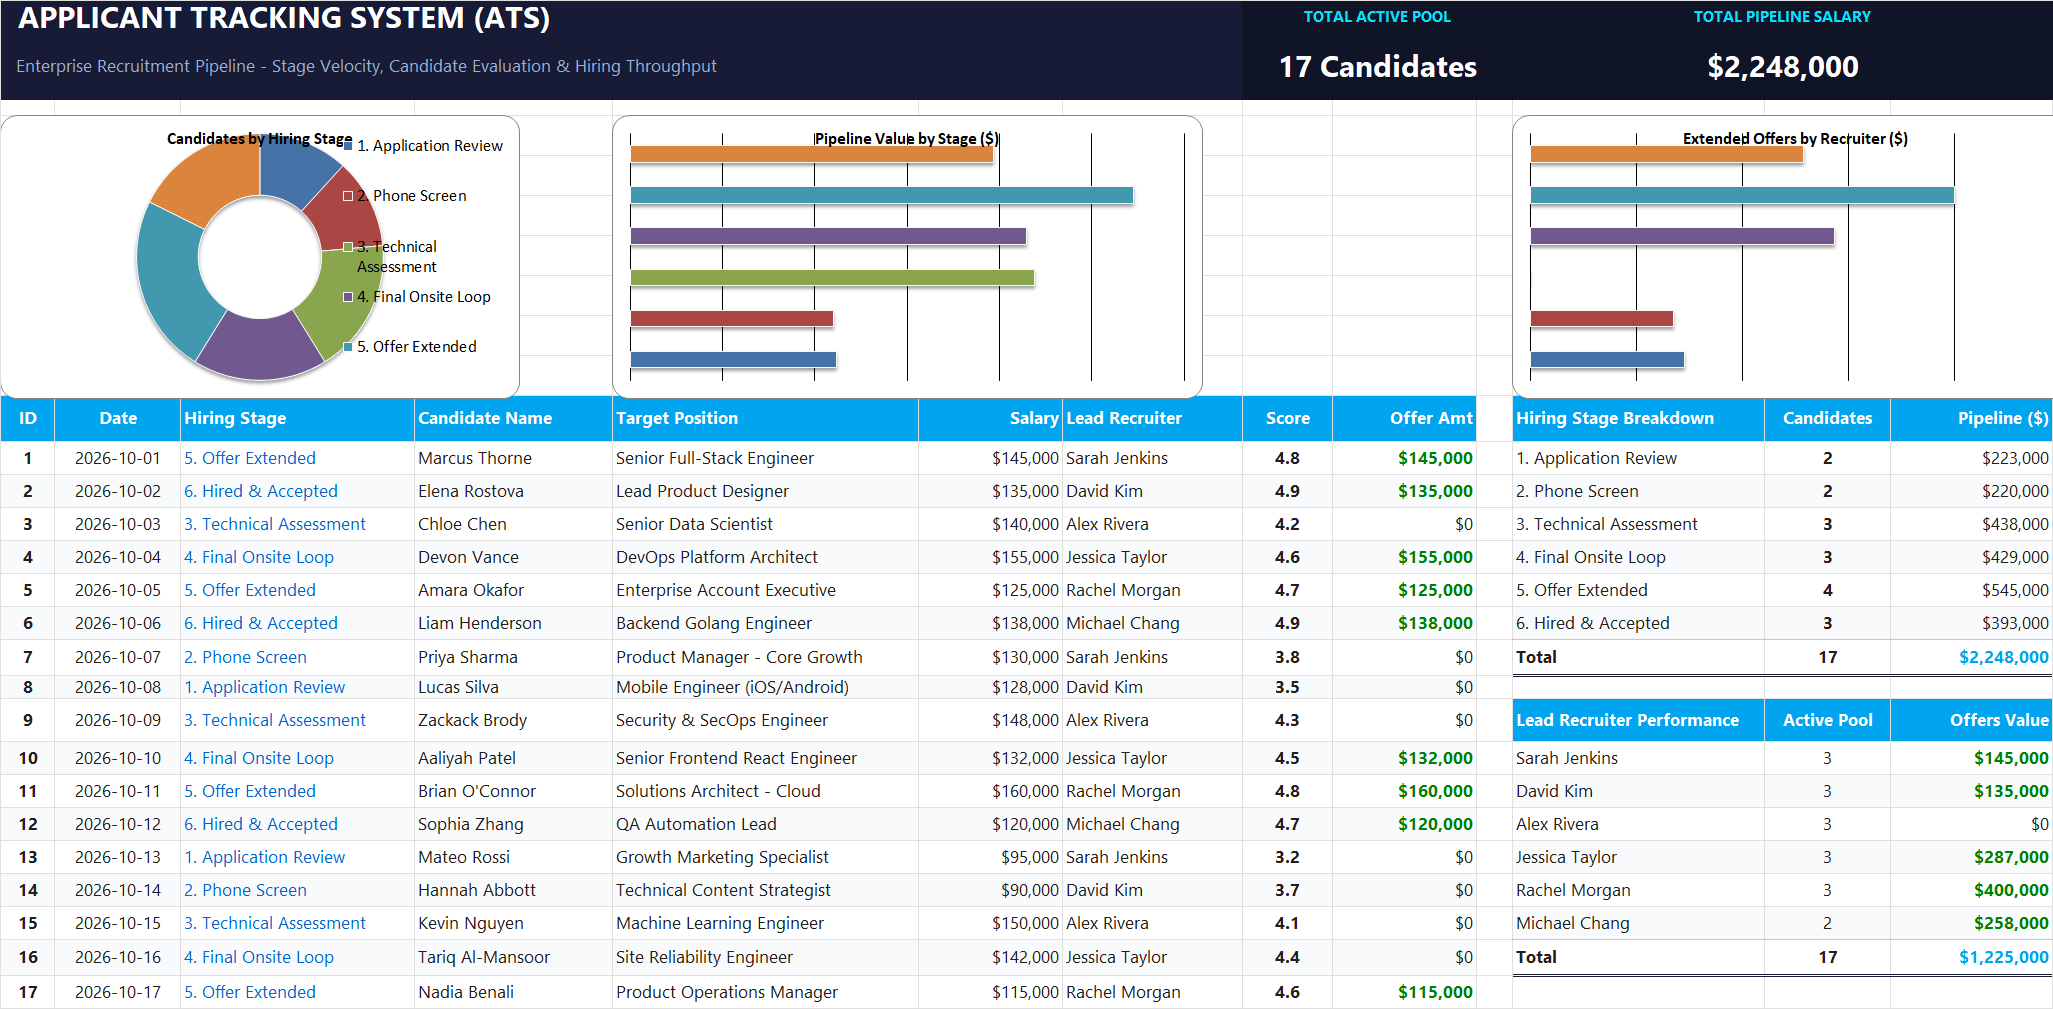
Applicant Tracking System (ATS) Excel Template
Tired of messy hiring spreadsheets? Learn how to build a clean Applicant Tracking System in Excel that automatically approves offers, counts applicants per stage, and updates executive salary summaries in real time.
 Sales
Sales Commission Calculator Excel Template
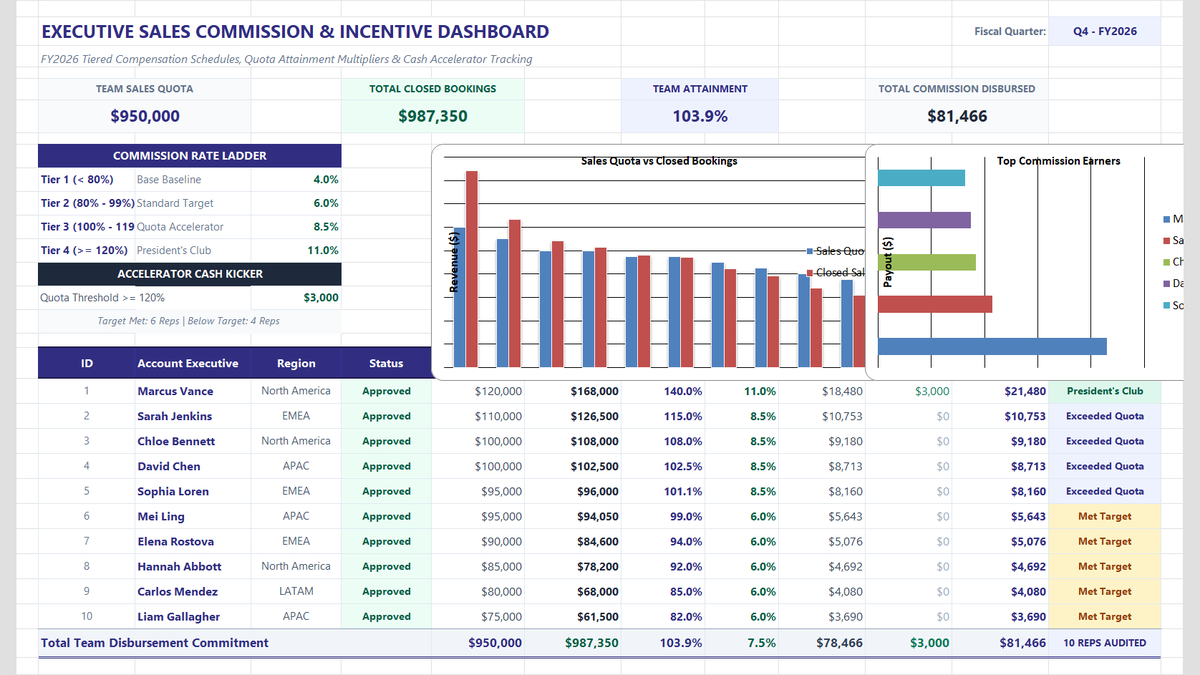
Calculate sales team commissions, quota attainment tiers, and performance accelerators in Microsoft Excel. Build an executive commission dashboard featuring tiered percentage multipliers, cash kickers for overachievers, automated performance status badges, and team payroll rollups.
Discussion
Ask questions, share formula tips, or discuss alternative approaches with fellow spreadsheet builders.
Loading discussion...