Keeping complex software or construction projects on schedule without a central tracker is nearly impossible. When tasks fall behind, cost overruns quickly follow.
A clear project planner keeps your team accountable by comparing planned task durations against actual progress in real time. In this practical guide, we build a Project Planner & Budget Schedule in Microsoft Excel. You will learn how to configure interactive period highlights, format completion milestones, and maintain a visual Gantt schedule.
Project Schedule Structure and Columns
A professional project planner structures execution into sequential delivery phases: discovery, architecture, core development, security audits, and deployment.
In our workbook, row 2 contains the interactive period highlight controller. Columns B through G record the core task details, planned durations, and progress percentages. Columns H onward map tasks across delivery periods 1 through 20.
Review the schema below before populating your project milestones:
| Col | Field Name | Type | Format | Operational Role |
|---|---|---|---|---|
| B | Activity | Text | General | WBS deliverable name (Scoping & Charter, Database Setup, API Build). |
| C | Plan Start | Integer | #,##0 | Scheduled baseline start period (e.g., Period 1, Period 6). |
| D | Plan Duration | Integer | #,##0 | Estimated work periods required to complete the milestone. |
| E | Actual Start | Integer | #,##0 | Realized start period when engineering work actually began. |
| F | Actual Duration | Integer | #,##0 | Recorded duration periods consumed to date. |
| G | Percent Complete | Percentage | 0% | Current milestone progress ratio (0% to 100%). |
| H+ | Periods (1-20) | Visual Gantt | General | Dynamic timeline cells shaded via conditional formatting. |
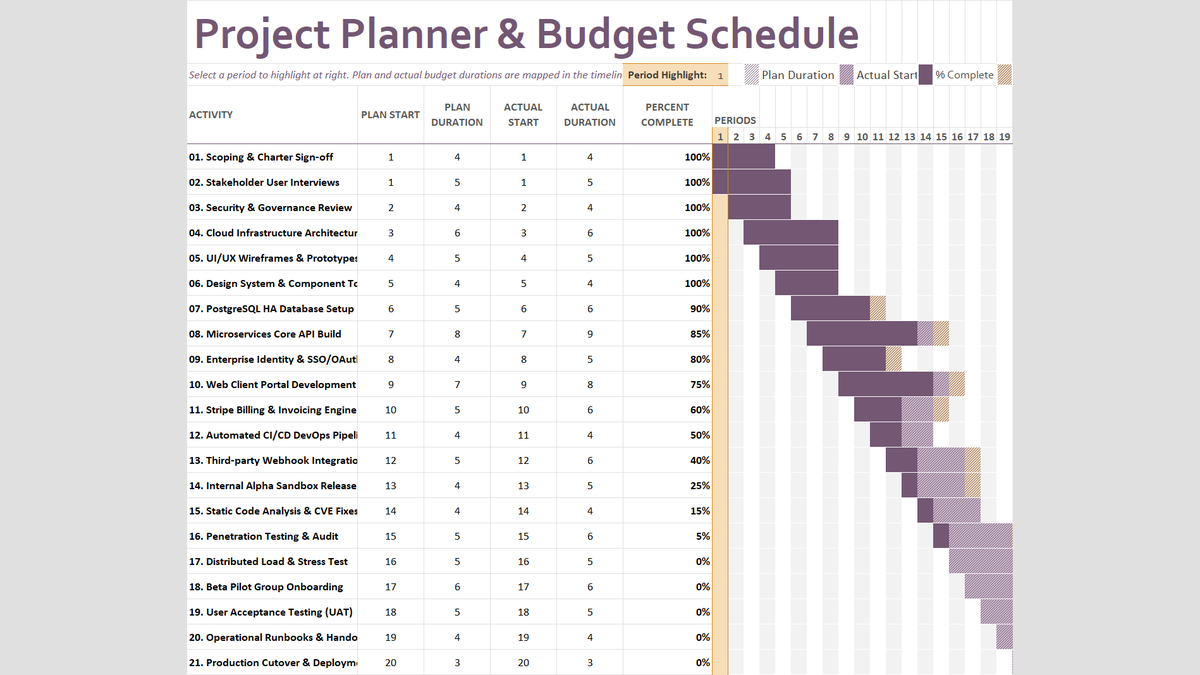
Workbook Blueprint: The Project Planner & Budget Schedule model showing task activities, duration tracking, and the visual timeline grid.
With our schedule columns organized, let us configure interactive dropdown controls and visual progress formatting.
Setting Up Period Controls, Completion Rules, and Milestone Timelines
Setting up this model involves three concrete steps: restricting period selection with Data Validation, highlighting completed deliverables with Conditional Formatting, and auditing the live schedule.
Follow each step below:
1Step 1: Set Up Period Highlight Dropdown via Data Validation
In cell H2, you can select which project period to highlight across the entire timeline grid.
Select cell H2, open the Data ribbon tab, and click Data Validation.
Under Allow, choose List. In the Source box, enter: 1, 2, 3, 4, 5, 6, 7, 8, 9, 10, 11, 12, 13, 14, 15, 16, 17, 18, 19, 20.
Ensure In-cell dropdown is checked and click OK. Project managers can now pick any active milestone period from a clean dropdown menu.
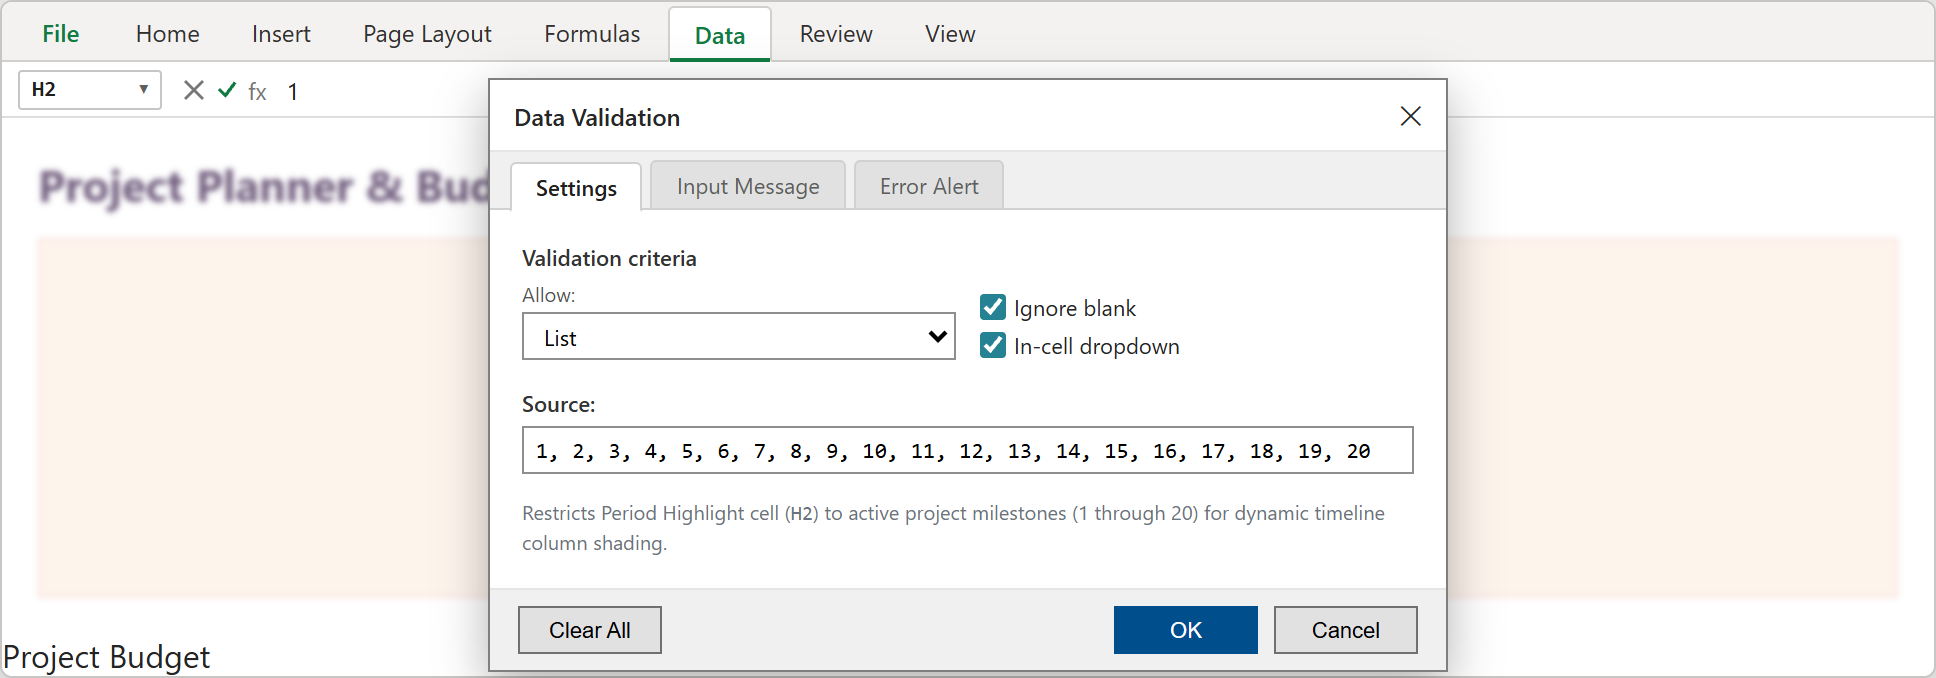
Step 1: Excel Data Validation dialog box configuring a list dropdown (periods 1 to 20) for cell H2.
2Step 2: Add Conditional Formatting for 100% Completed Tasks
Deliverables that are fully finished should visually stand out so stakeholders can immediately see what is signed off.
Select the completion column range G5:G26, go to Home > Conditional Formatting > New Rule, and choose Format only cells that contain.
Set the rule to Cell Value equal to 1.0. Under Format, select light green fill with dark green text (#1E7E34).
Click OK. Finished tasks like Charter Sign-off and UI/UX Wireframes will instantly display in green once they reach 100% completion.
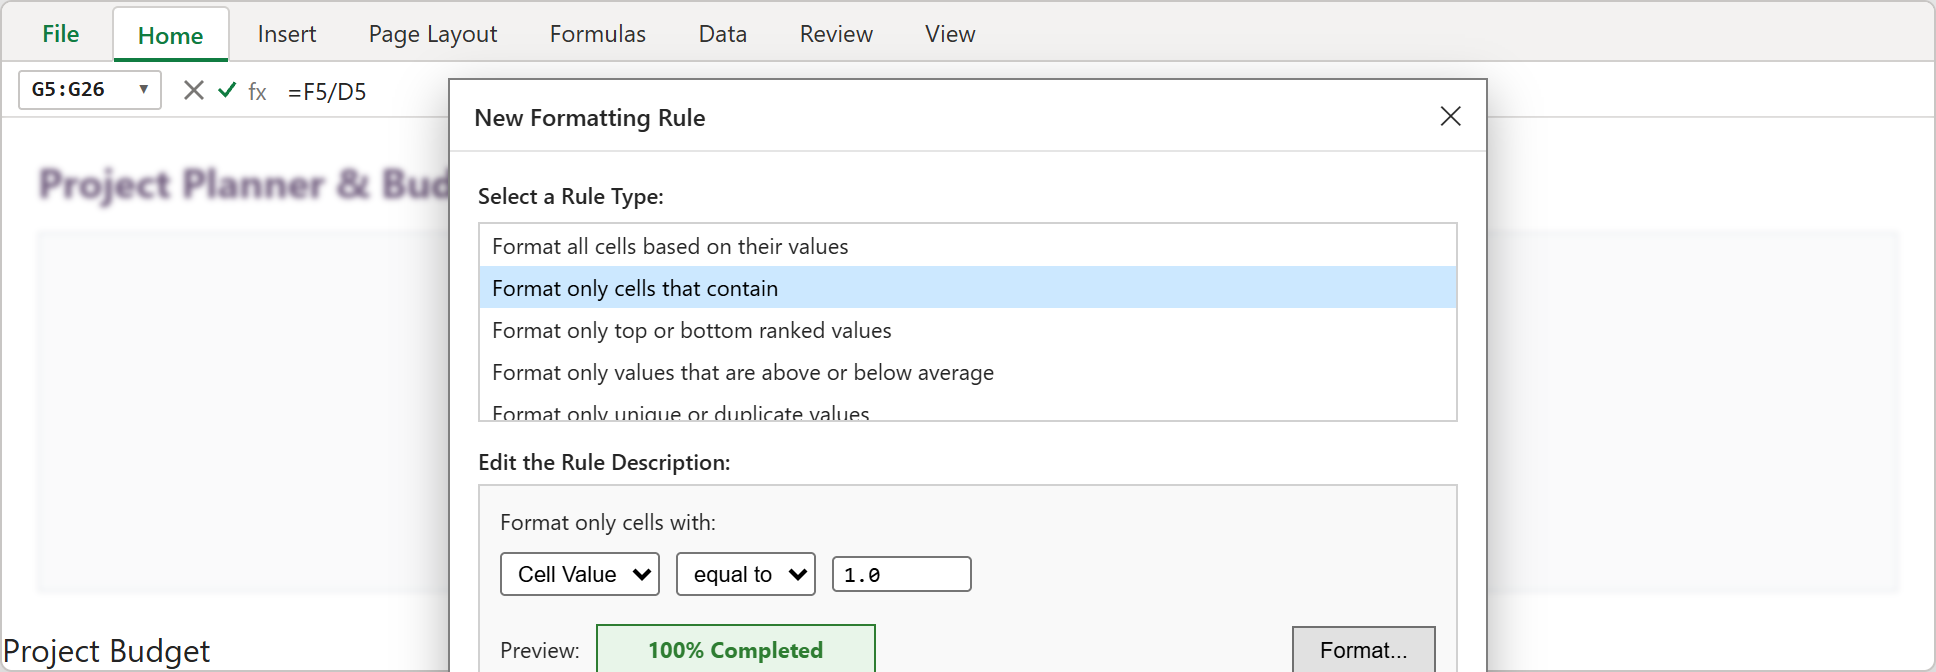
Step 2: Excel Conditional Formatting dialog highlighting completed deliverables in green.
3Step 3: Executive Milestone Timeline and Gantt Schedule
Now examine the completed project schedule workstation.
Planned durations appear in purple bars, while actual start times and current period columns highlight live progress. In-progress milestones like the PostgreSQL HA Setup (90% complete) and Core API Build (85% complete) show slight extensions (e.g. 9 actual periods vs 8 planned), signaling where sprint resources need to be focused.
The active period highlight column (Period 1) stands out in soft amber, giving stakeholders an immediate snapshot of current sprint delivery.
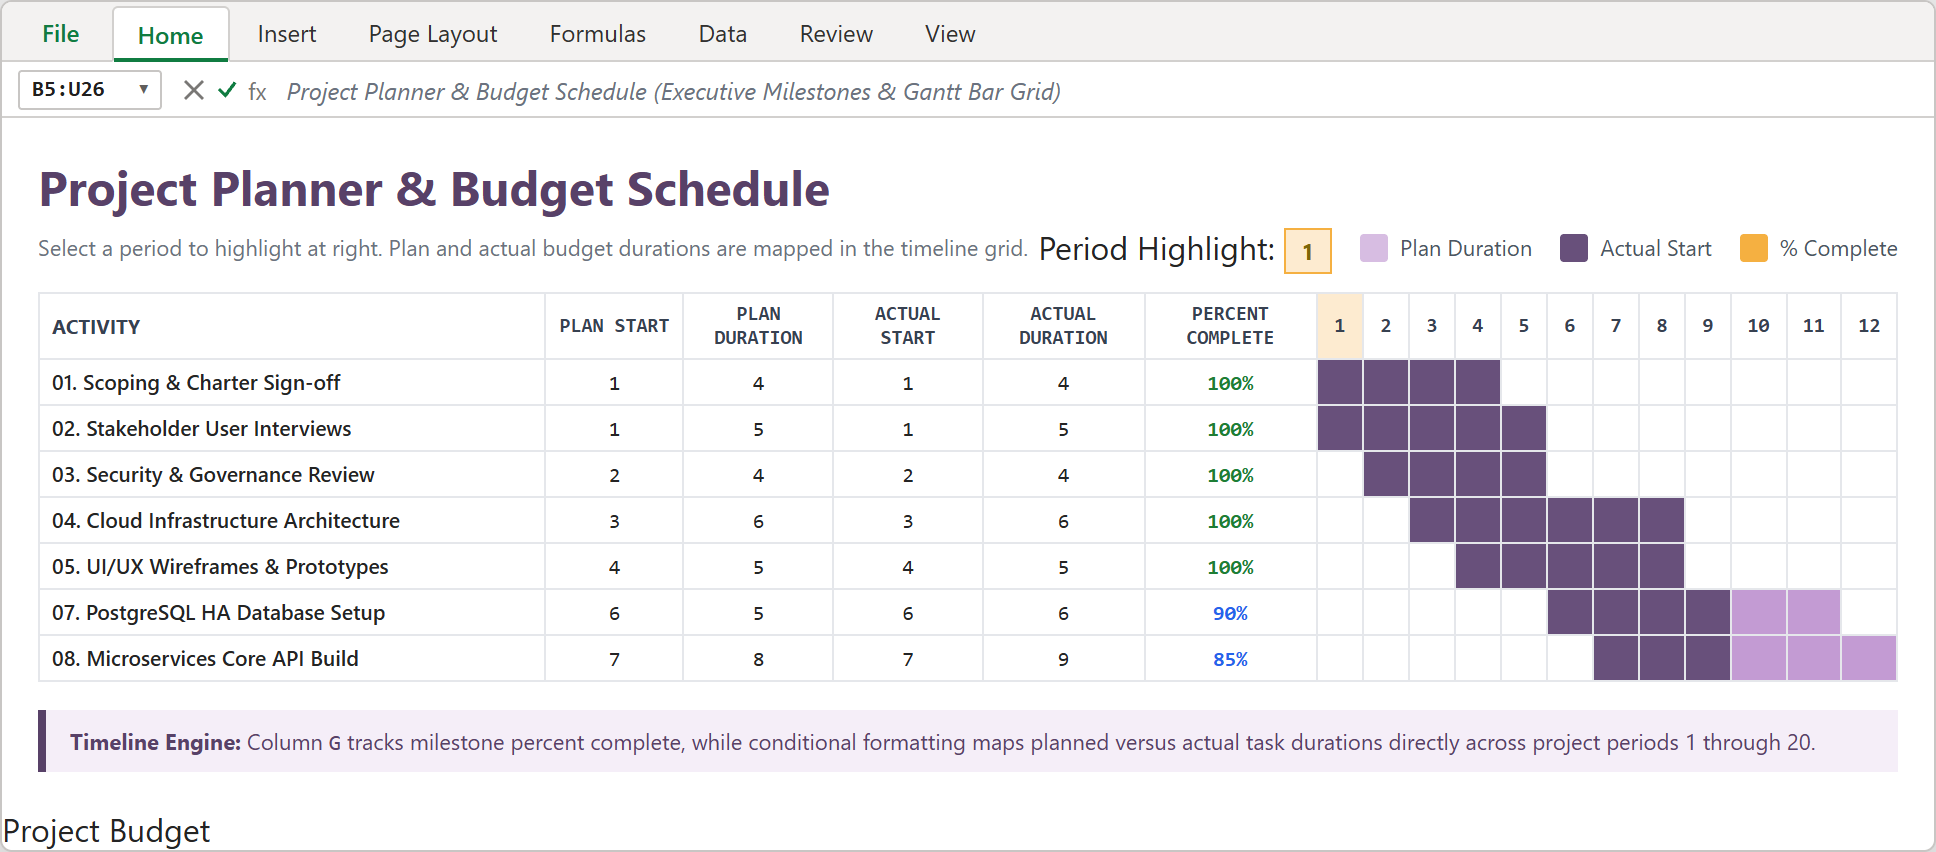
Step 3: Completed project planner view showing milestone activities, completion badges, and the multi-period Gantt bar schedule.
Scope Control and Milestone Governance Rules
To prevent project schedule slippage and budget creep, apply these three core habits:
1. Audit Variance Weekly: Whenever actual duration exceeds planned duration by more than 1 period, flag the task in your weekly standup.
2. Freeze Baseline Durations: Never overwrite column D (Plan Duration) after project kickoff. Track timeline adjustments exclusively in column F (Actual Duration) to preserve baseline integrity.
3. Enforce Sign-off Criteria: Only mark column G as 100% when the client or product lead has provided formal acceptance, not merely when code is pushed.
Conclusion and Next Steps
You have built a reliable Project Planner & Budget Schedule in Microsoft Excel. With structured milestone tracking, interactive period highlights, and clear completion indicators, you have full control over project execution.
Download the template below to plug in your own project deliverables, or practice adjusting task timelines directly inside our interactive spreadsheet playground.

Spreadsheet educator and web developer passionate about hands-on interactive spreadsheet practice.
Related Practical Exercises
Explore more hands-on spreadsheet models with downloadable practice workbooks.
 Project Management
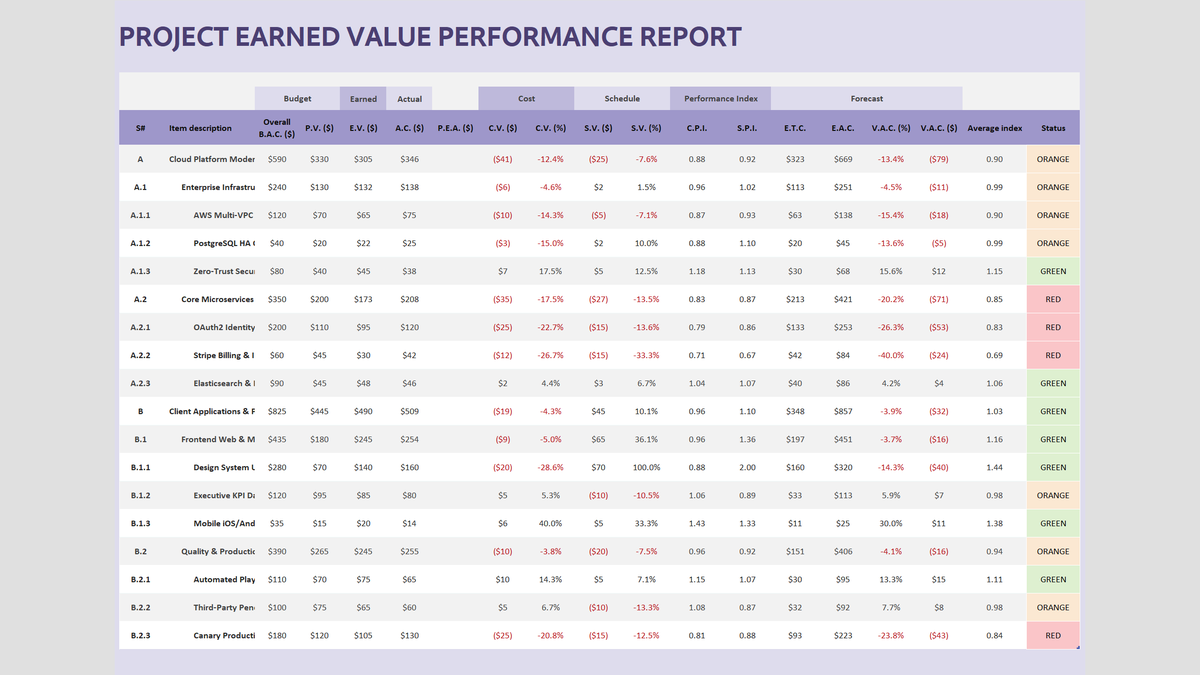
Project Earned Value Performance Report Excel Template
Track capital project budgets and delivery deadlines using Earned Value Management (EVM) in Microsoft Excel. Calculate Cost Variance (CV), Schedule Variance (SV), Cost Performance Index (CPI), and Estimate at Completion (EAC) with automated red-amber-green status badges.
 Project Management
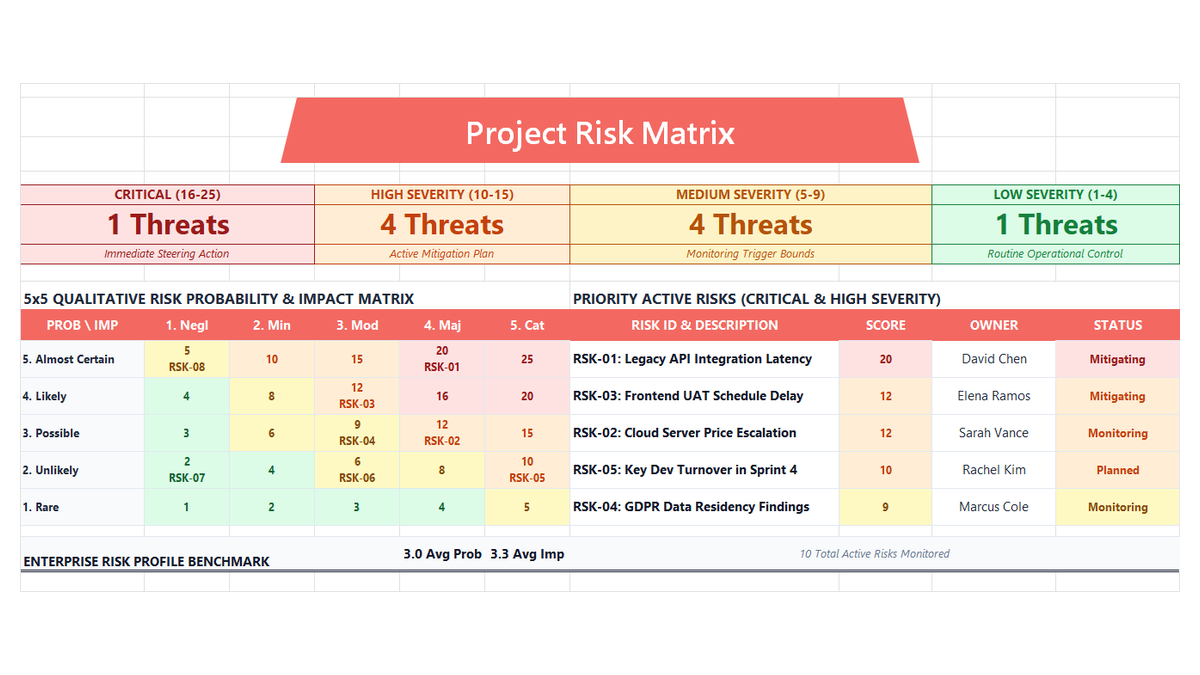
Project Risk Register Excel Template
Learn enterprise risk governance in Microsoft Excel. Build an ISO 31000 and PMBOK-compliant 5x5 qualitative risk heatmap, automate probability and impact scoring, engineer multi-tier severity formulas, and enforce accountability with data validation.
 Project Management
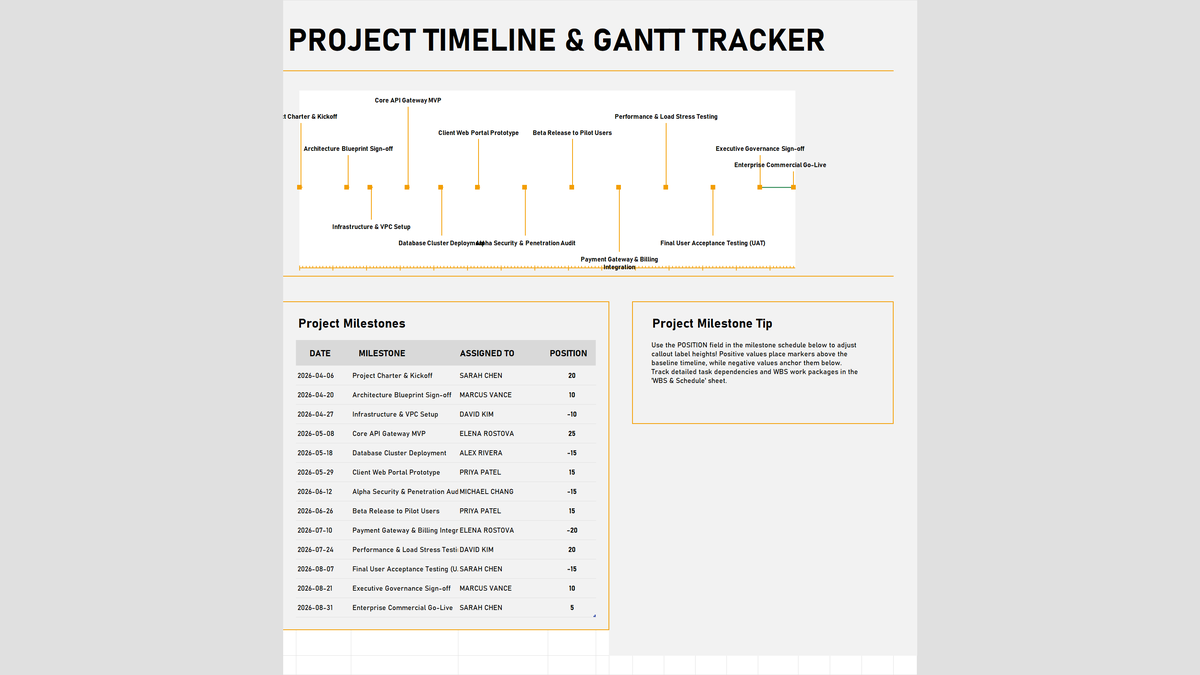
Project Timeline & Gantt Tracker Excel Template
Visualize project milestones, key delivery dates, and executive roadmaps in Microsoft Excel. Build an interactive timeline and milestone tracker featuring dynamic calendar year formulas with =DATE(YEAR(TODAY())), standard ISO date formatting, alternating label position controls, and roadmap chart visuals.
 Operations
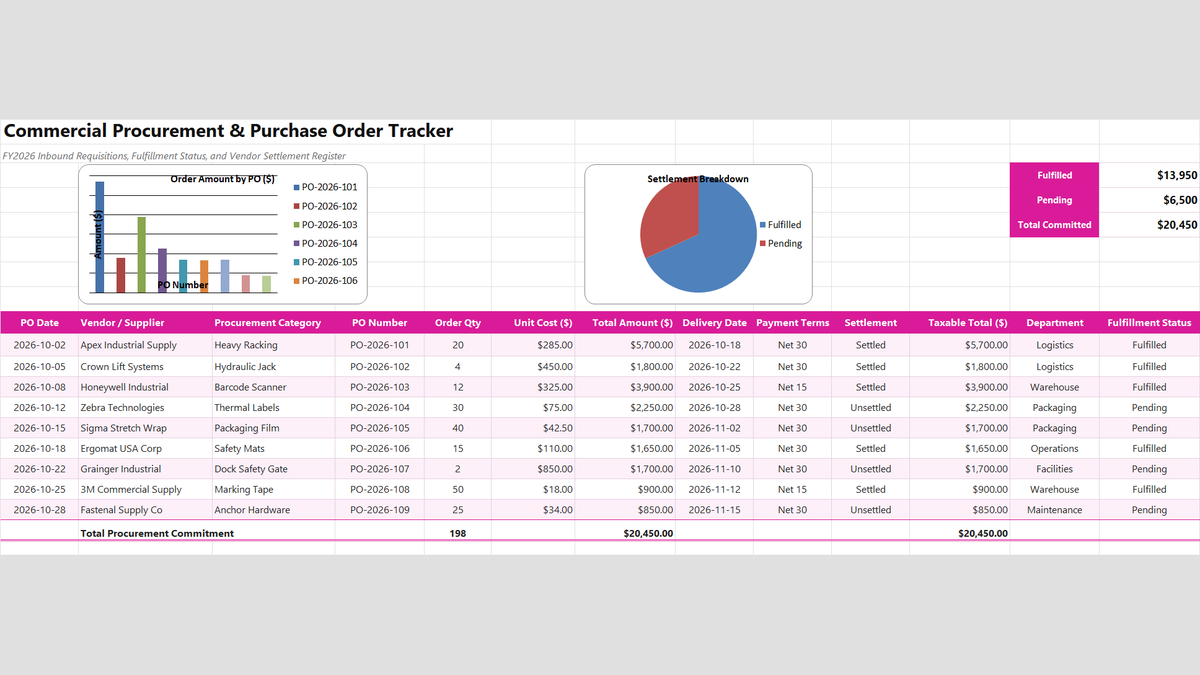
Purchase Order Generator & Tracker Excel Template
Learn how to engineer a commercial procurement and purchase order tracker in Microsoft Excel featuring line item commitment multiplication, vendor fulfillment status monitoring, and accounts payable settlement reconciliations.
 Human Resources
Applicant Tracking System (ATS) Excel Template
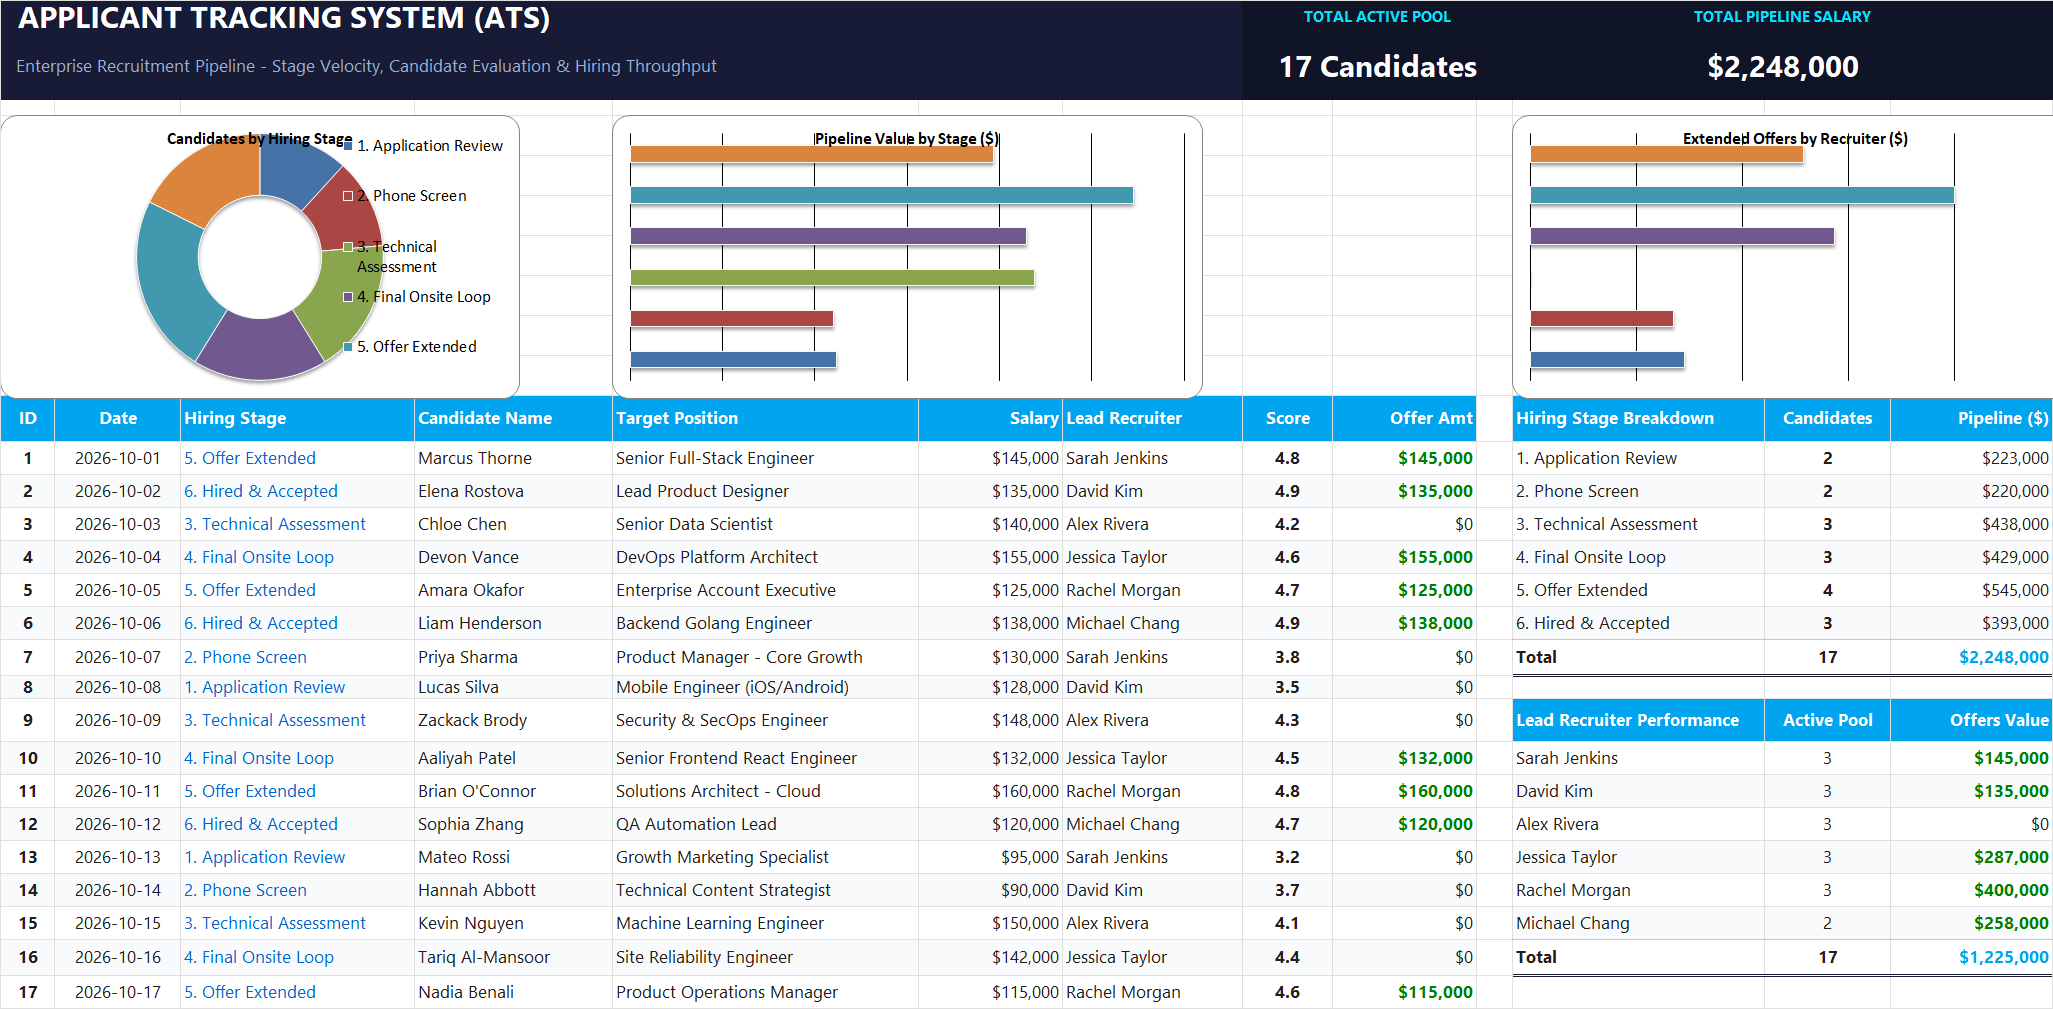
Tired of messy hiring spreadsheets? Learn how to build a clean Applicant Tracking System in Excel that automatically approves offers, counts applicants per stage, and updates executive salary summaries in real time.
Discussion
Ask questions, share formula tips, or discuss alternative approaches with fellow spreadsheet builders.
Loading discussion...