A profit and loss statement (P&L) is the single most important report in business finance. Without one, you can easily confuse cash flowing into your bank account with actual profitability.
A structured P&L clarifies your true performance step by step: from top-line revenue, down to gross profit, operating income (EBIT), and bottom-line net profit. In this practical tutorial, we build a 12-month Profit and Loss Statement in Microsoft Excel. You will learn how to structure revenue and expense lines, calculate accurate profit margins, highlight potential operating losses, and build an executive quarterly rollup.
Profit and Loss Structure and Accounts
A standard income statement follows a strict multi-step layout. Each level of profit isolates a specific part of company operations.
In our workbook, the Workspace tab tracks 12 monthly periods across columns C through N. The Overview tab summarizes quarterly totals (Q1 through Q4) in columns C through F, full-year totals in column G, and revenue shares in column H.
Review the key accounting tiers below:
| Col | Field Name | Type | Format | Operational Role |
|---|---|---|---|---|
| B | Financial Line Item | Text | General | Accounting account name (Subscription SaaS, Cloud Hosting, R&D Expenses). |
| C | Q1 2026 ($) | Formula (Currency) | $#,##0 | Sum of January, February, and March performance: =SUM(Workspace!C13:E13). |
| D | Q2 2026 ($) | Formula (Currency) | $#,##0 | Sum of April, May, and June operating months. |
| E | Q3 2026 ($) | Formula (Currency) | $#,##0 | Sum of July, August, and September operating months. |
| F | Q4 2026 ($) | Formula (Currency) | $#,##0 | Sum of October, November, and December operating months. |
| G | FY2026 Total ($) | Formula (Currency) | $#,##0 | Full-year consolidated operating total linked from Workspace column O. |
| H | % of Revenue | Formula (Ratio) | 0.0% | Cost ratio relative to Annual Net Revenue: =G10/$G$9. |
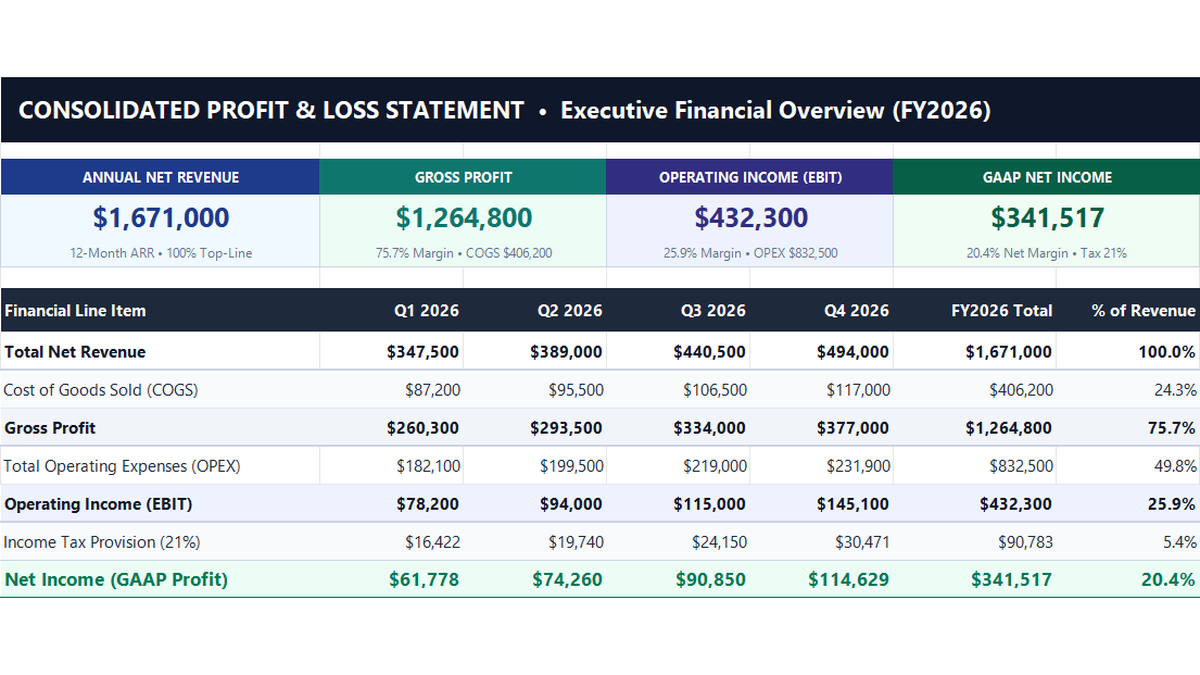
Workbook Blueprint: The Profit and Loss Statement architecture displaying executive scorecards, quarterly performance, and profit tiers.
Now that the accounts and columns are defined, let us write the profit formulas and configure automated loss formatting.
Calculating Margins, Setting Up Loss Alerts, and Executive Rollups
Building an accurate P&L requires calculating gross profit, highlighting negative operating months, and rolling up quarterly figures for leadership reviews.
Follow each step below:
1Step 1: Calculate Gross Profit with Subtraction Formula
Gross profit measures how much money remains after paying the direct costs required to deliver your product or service.
In cell C19 of the Workspace sheet, calculate January gross profit: =C13-C18.
Here, cell C13 is Total Net Revenue ($112,000) and cell C18 is Total Cost of Goods Sold ($28,200). Cell C19 evaluates to $83,800, producing a healthy 74.8% gross margin.
Copy this formula across columns D through N to compute gross margins for all 12 months.
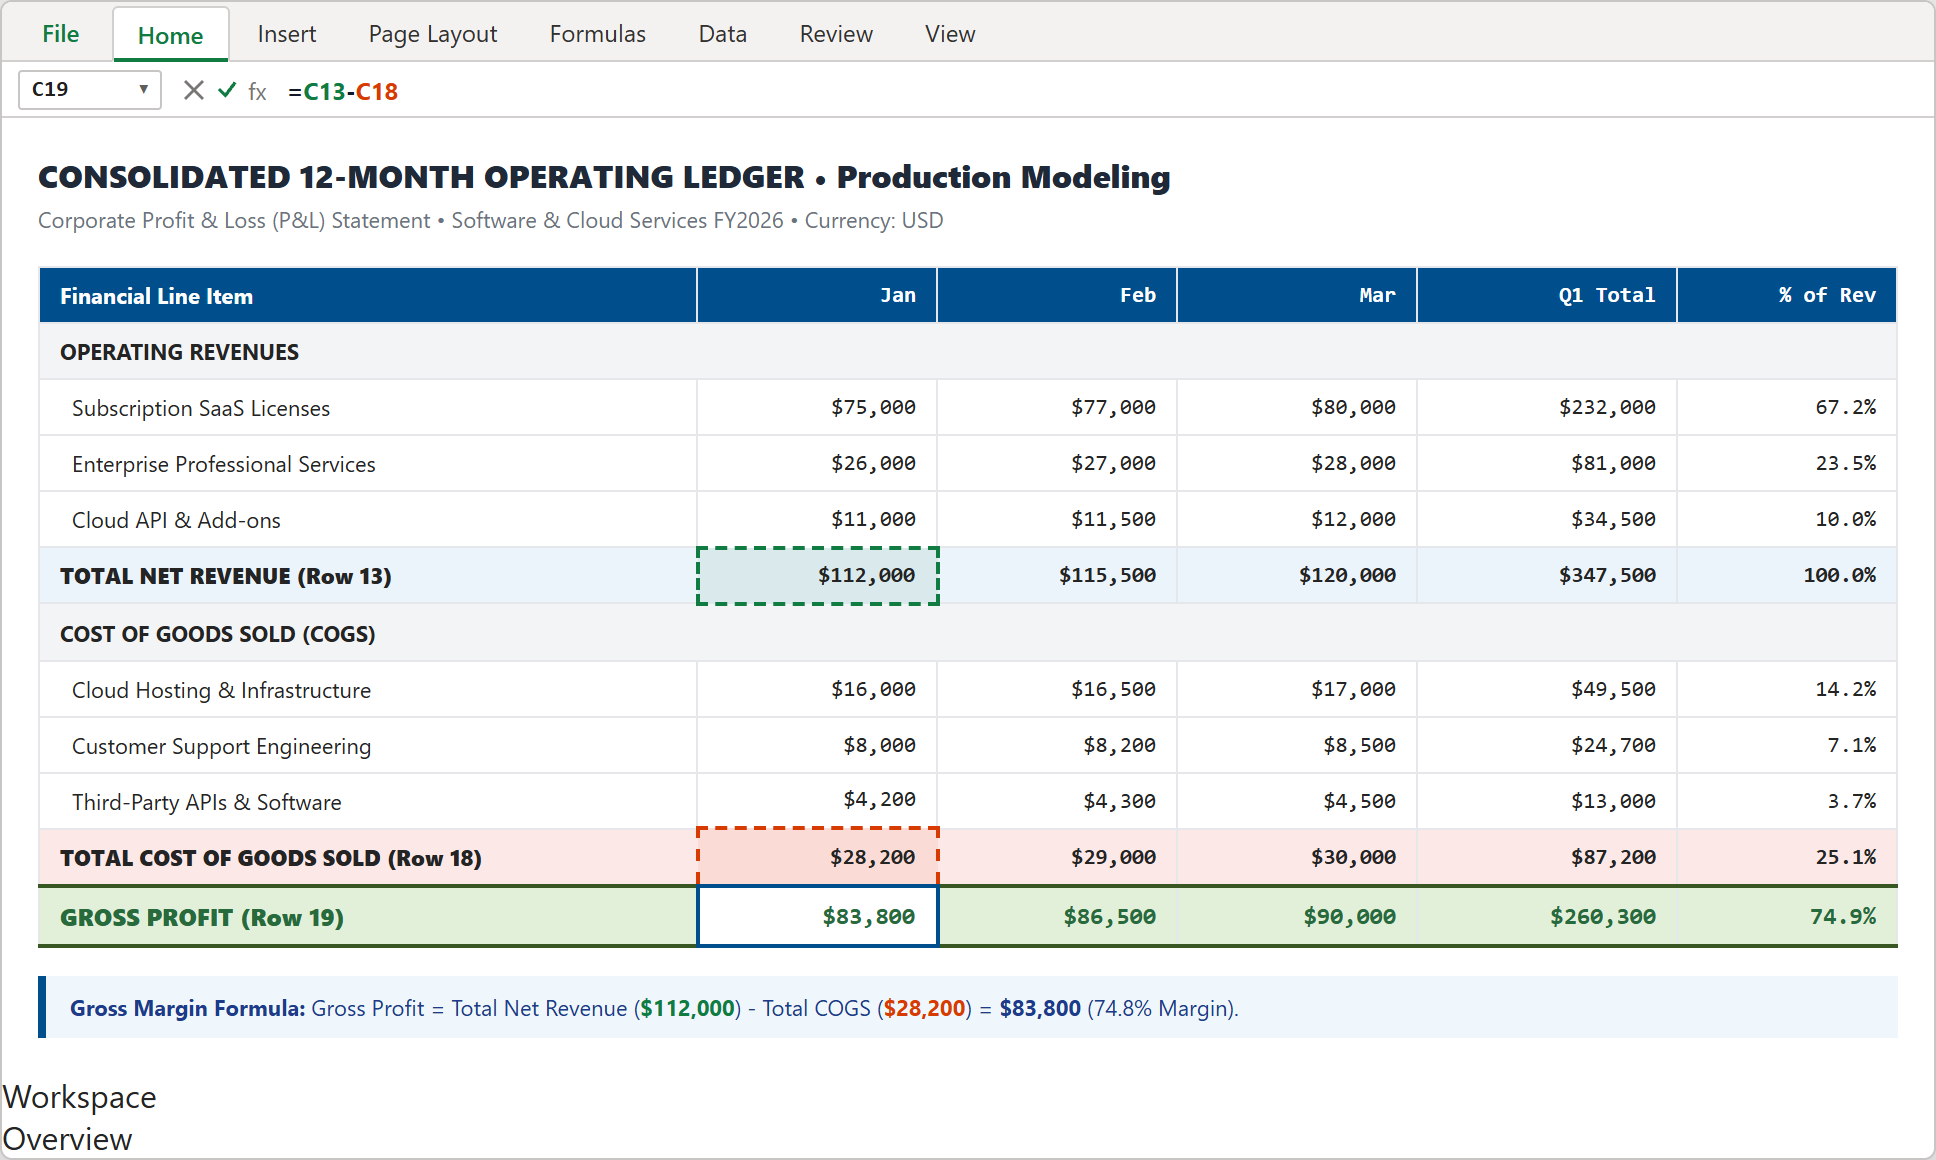
Step 1: Formula bar showing =C13-C18 subtracting COGS from net revenue to calculate monthly gross profit.
2Step 2: Add Conditional Formatting Alert for Operating Losses
Operating income (EBIT) in row 26 shows core business earnings after deducting sales, engineering, and administrative expenses. If this number turns negative in any month, management needs to know right away.
Select monthly EBIT cells C26:N26, go to Home > Conditional Formatting > New Rule, and choose Format only cells that contain.
Set the condition to Cell Value < 0. Under Format, select light red fill (#FFC7CE) with dark red text (#9C0006).
Click OK. Any month where operating expenses exceed gross profit will now be highlighted instantly in soft red.
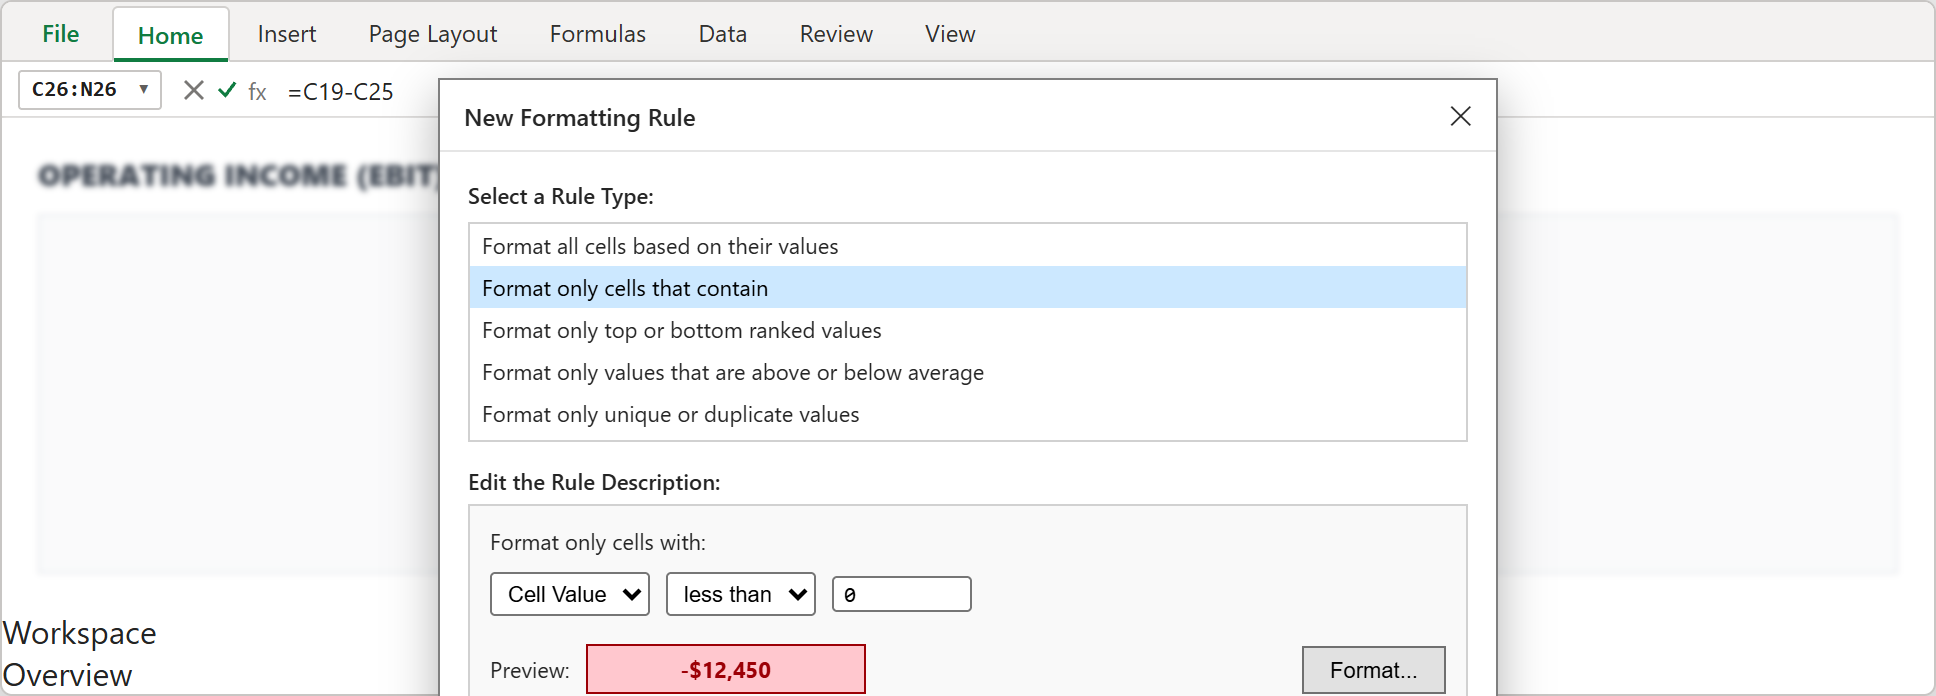
Step 2: Excel Conditional Formatting dialog highlighting any monthly operating income below $0 in red.
3Step 3: Executive P&L Rollup and Margin Scorecard
Switch to the Overview sheet to inspect the executive presentation view.
Top KPI cards highlight the full-year health of the company: Annual Net Revenue ($1,671,000), Gross Profit ($1,264,800 at 75.7% margin), Operating Income ($432,300 at 25.9% EBIT margin), and GAAP Net Income ($341,517 at 20.4% net margin) after a 21% income tax provision.
The quarterly summary table clearly displays steady quarterly expansion, rising from $347,500 in Q1 to $489,500 in Q4.
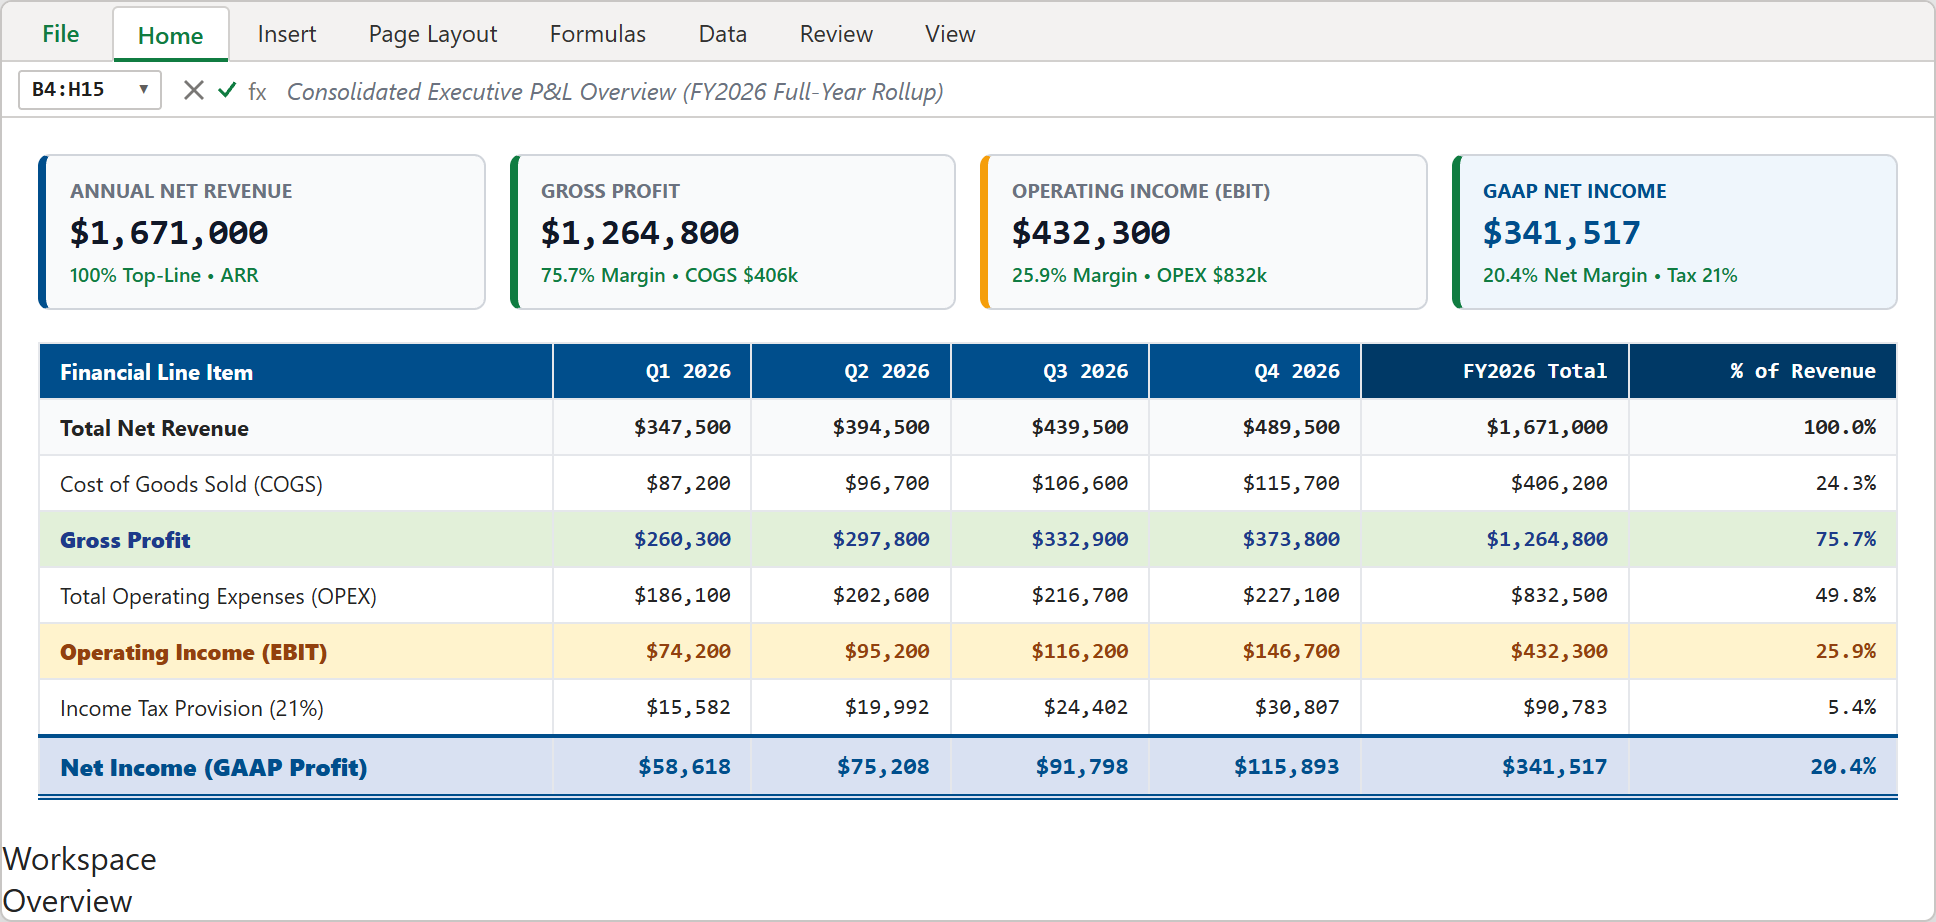
Step 3: Executive summary view displaying KPI scorecard cards and the full-year quarterly P&L rollup table.
Financial Modeling Guidelines and Margin Rules
To ensure your financial statements remain trustworthy for investors, banks, and leadership teams, maintain these three core habits:
1. Keep Direct Costs in COGS: Only record direct hosting, payment processing fees, and support contractor wages in COGS. Keep core software engineering and marketing inside OPEX.
2. Monitor EBITDA vs Net Income: Depreciation and taxes can disguise underlying cash flow. Track both operating earnings (EBIT) and bottom-line GAAP profit.
3. Lock Formula Cells: Lock rows 13, 18, 19, 25, 26, and 28 so team members only input raw expense numbers without accidentally overwriting summary formulas.
Conclusion and Next Steps
You have built a professional Profit and Loss Statement in Microsoft Excel. With clean revenue categorization, automated margin math, visual deficit warnings, and quarterly executive rollups, your company financials are organized and ready for reporting.
Download the template below to plug in your own revenue figures, or practice adjusting formulas directly inside our interactive spreadsheet playground.

Spreadsheet educator and web developer passionate about hands-on interactive spreadsheet practice.
Related Practical Exercises
Explore more hands-on spreadsheet models with downloadable practice workbooks.
 Project Management
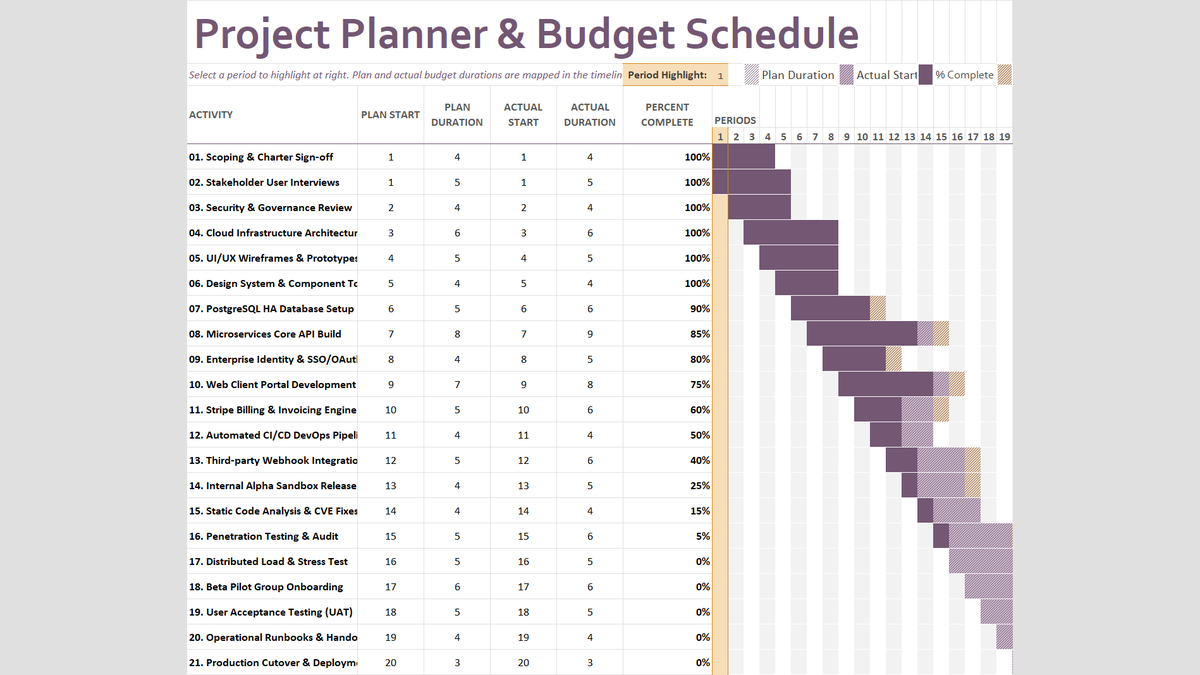
Project Budget Estimator Excel Template
Build a practical project planner and budget schedule in Microsoft Excel to track planned versus actual durations, percent complete milestones, and dynamic timeline periods.
 Project Management
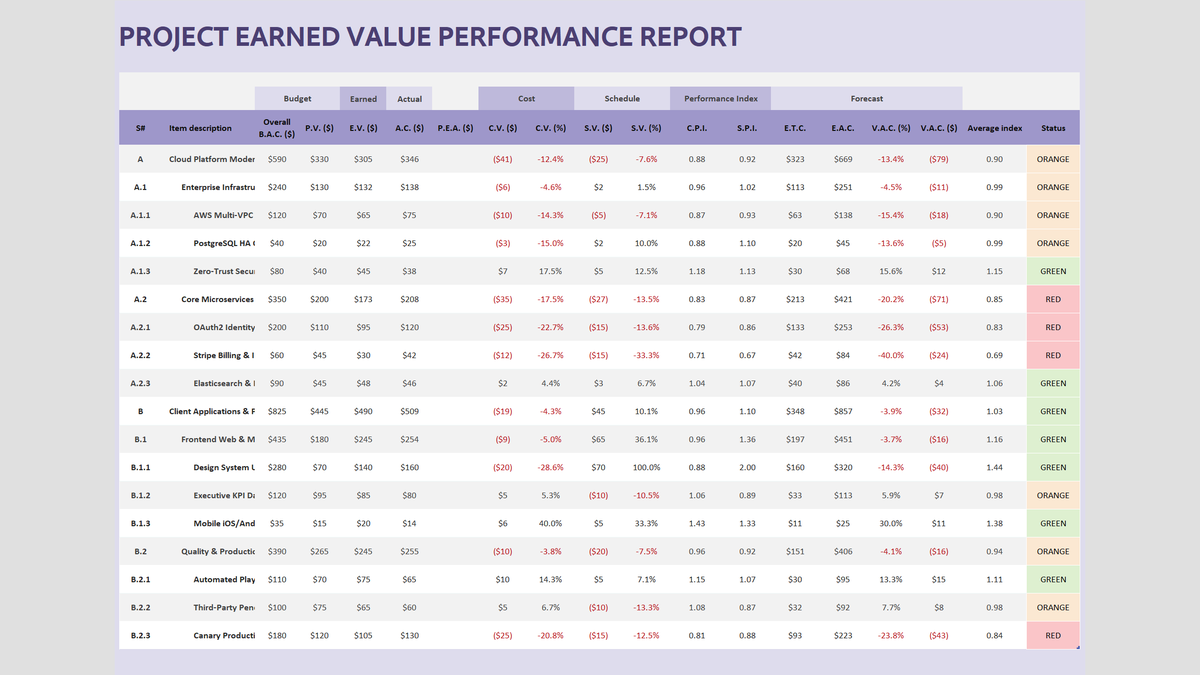
Project Earned Value Performance Report Excel Template
Track capital project budgets and delivery deadlines using Earned Value Management (EVM) in Microsoft Excel. Calculate Cost Variance (CV), Schedule Variance (SV), Cost Performance Index (CPI), and Estimate at Completion (EAC) with automated red-amber-green status badges.
 Project Management
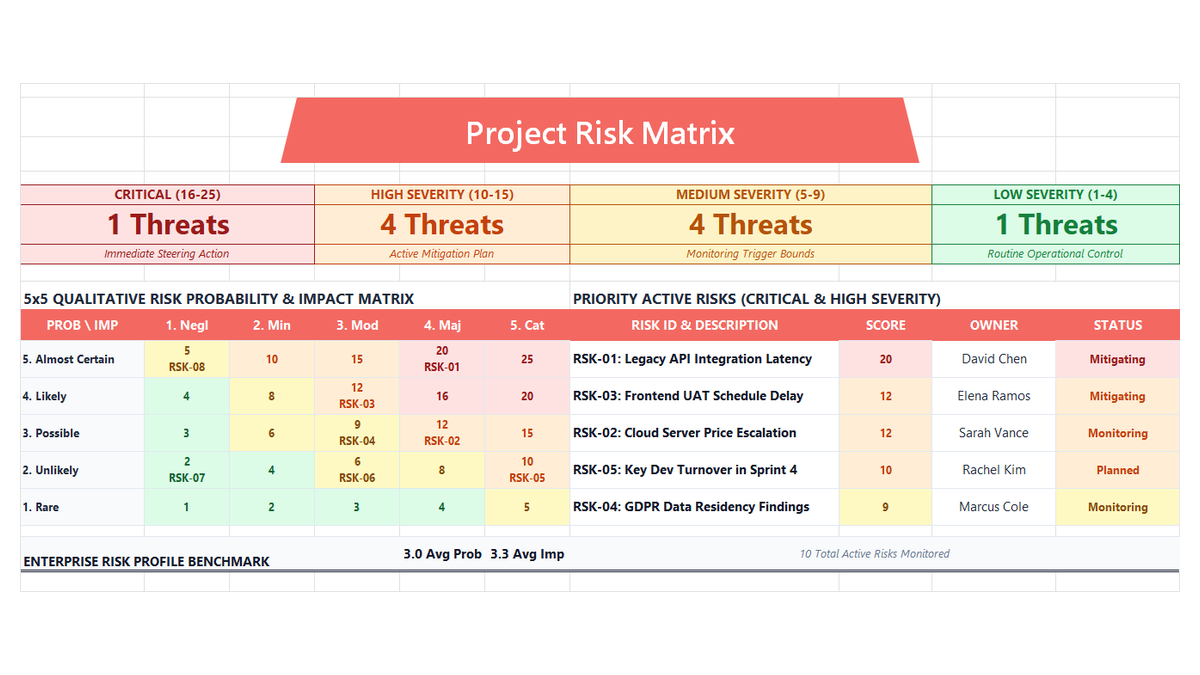
Project Risk Register Excel Template
Learn enterprise risk governance in Microsoft Excel. Build an ISO 31000 and PMBOK-compliant 5x5 qualitative risk heatmap, automate probability and impact scoring, engineer multi-tier severity formulas, and enforce accountability with data validation.
 Project Management
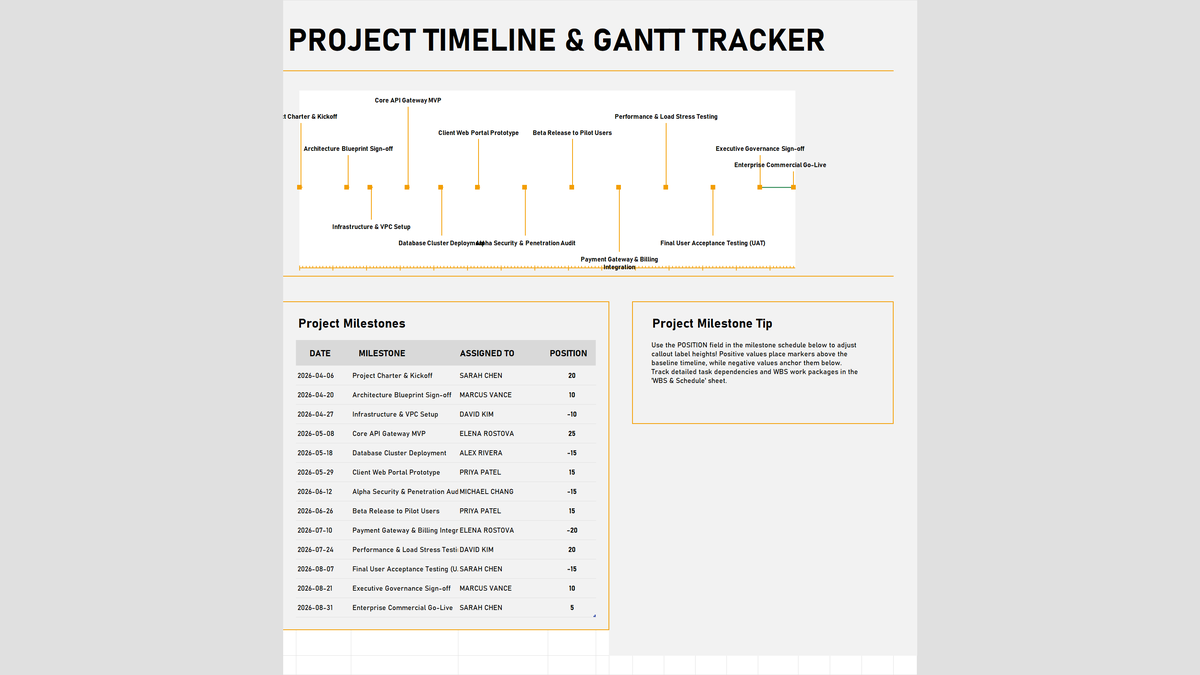
Project Timeline & Gantt Tracker Excel Template
Visualize project milestones, key delivery dates, and executive roadmaps in Microsoft Excel. Build an interactive timeline and milestone tracker featuring dynamic calendar year formulas with =DATE(YEAR(TODAY())), standard ISO date formatting, alternating label position controls, and roadmap chart visuals.
 Operations
Purchase Order Generator & Tracker Excel Template
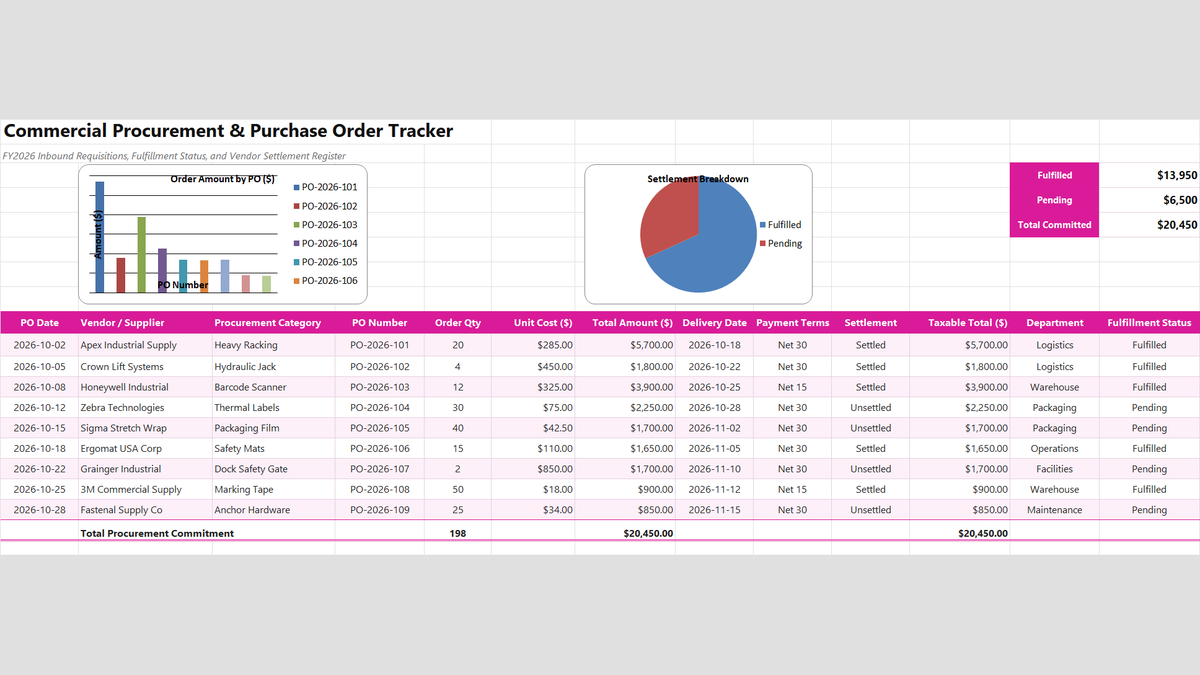
Learn how to engineer a commercial procurement and purchase order tracker in Microsoft Excel featuring line item commitment multiplication, vendor fulfillment status monitoring, and accounts payable settlement reconciliations.
Discussion
Ask questions, share formula tips, or discuss alternative approaches with fellow spreadsheet builders.
Loading discussion...