Setting product prices by guessing is one of the fastest ways an e-commerce business loses money. Many sellers look at competitor prices, apply a random markup, and forget that shipping, returns, and inventory costs eat into their actual cash.
A solid pricing model shows you exactly how much money each item makes after direct product costs. In this tutorial, we build a Product Pricing & Profit Margin Calculator in Microsoft Excel. You will learn how to calculate unit revenue, subtract landed product costs, evaluate individual SKU profitability, and build an executive monthly margin dashboard.
E-Commerce SKU Architecture and Cost Schema
A reliable pricing sheet organizes your catalog into clear columns: transaction dates, item SKUs, descriptions, unit sales, selling prices, landed costs, and gross margins.
In our workbook, rows 19 through 30 track 12 distinct catalog products (such as ergonomic memory pillows, bamboo sheets, and weighted blankets). Columns D through L track the core unit economics, while columns P through S summarize monthly performance.
Review the operational ledger schema below:
| Col | Field Name | Type | Format | Operational Role |
|---|---|---|---|---|
| D | Date | Date | YYYY-MM-DD | Transaction sales date for inventory audit. |
| E | Item SKU | Text | General | Unique stock keeping unit code (SKU-PLW-01, SKU-WBL-04). |
| F | Product Title | Text | General | Commercial e-commerce listing name. |
| G | Category / Spec | Text | General | Product classification tier (Bedding / Premium Foam, Sleep Tech). |
| H | Units Sold | Integer | #,##0 | Total volume quantity sold across the billing period. |
| I | Unit Retail Price ($) | Currency | $#,##0.00 | Customer selling price per individual unit. |
| J | Total Revenue ($) | Formula (Currency) | $#,##0.00 | Total gross sales value: =H19*I19. |
| K | Total COGS ($) | Currency | $#,##0.00 | Direct landed manufacturing and inbound freight costs. |
| L | Gross Profit ($) | Formula (Currency) | $#,##0.00 | Net contribution dollars: =J19-K19. |
| M | Pricing Strategy | Text | General | Commercial tier policy (High Margin Tier, Volume Bundle). |
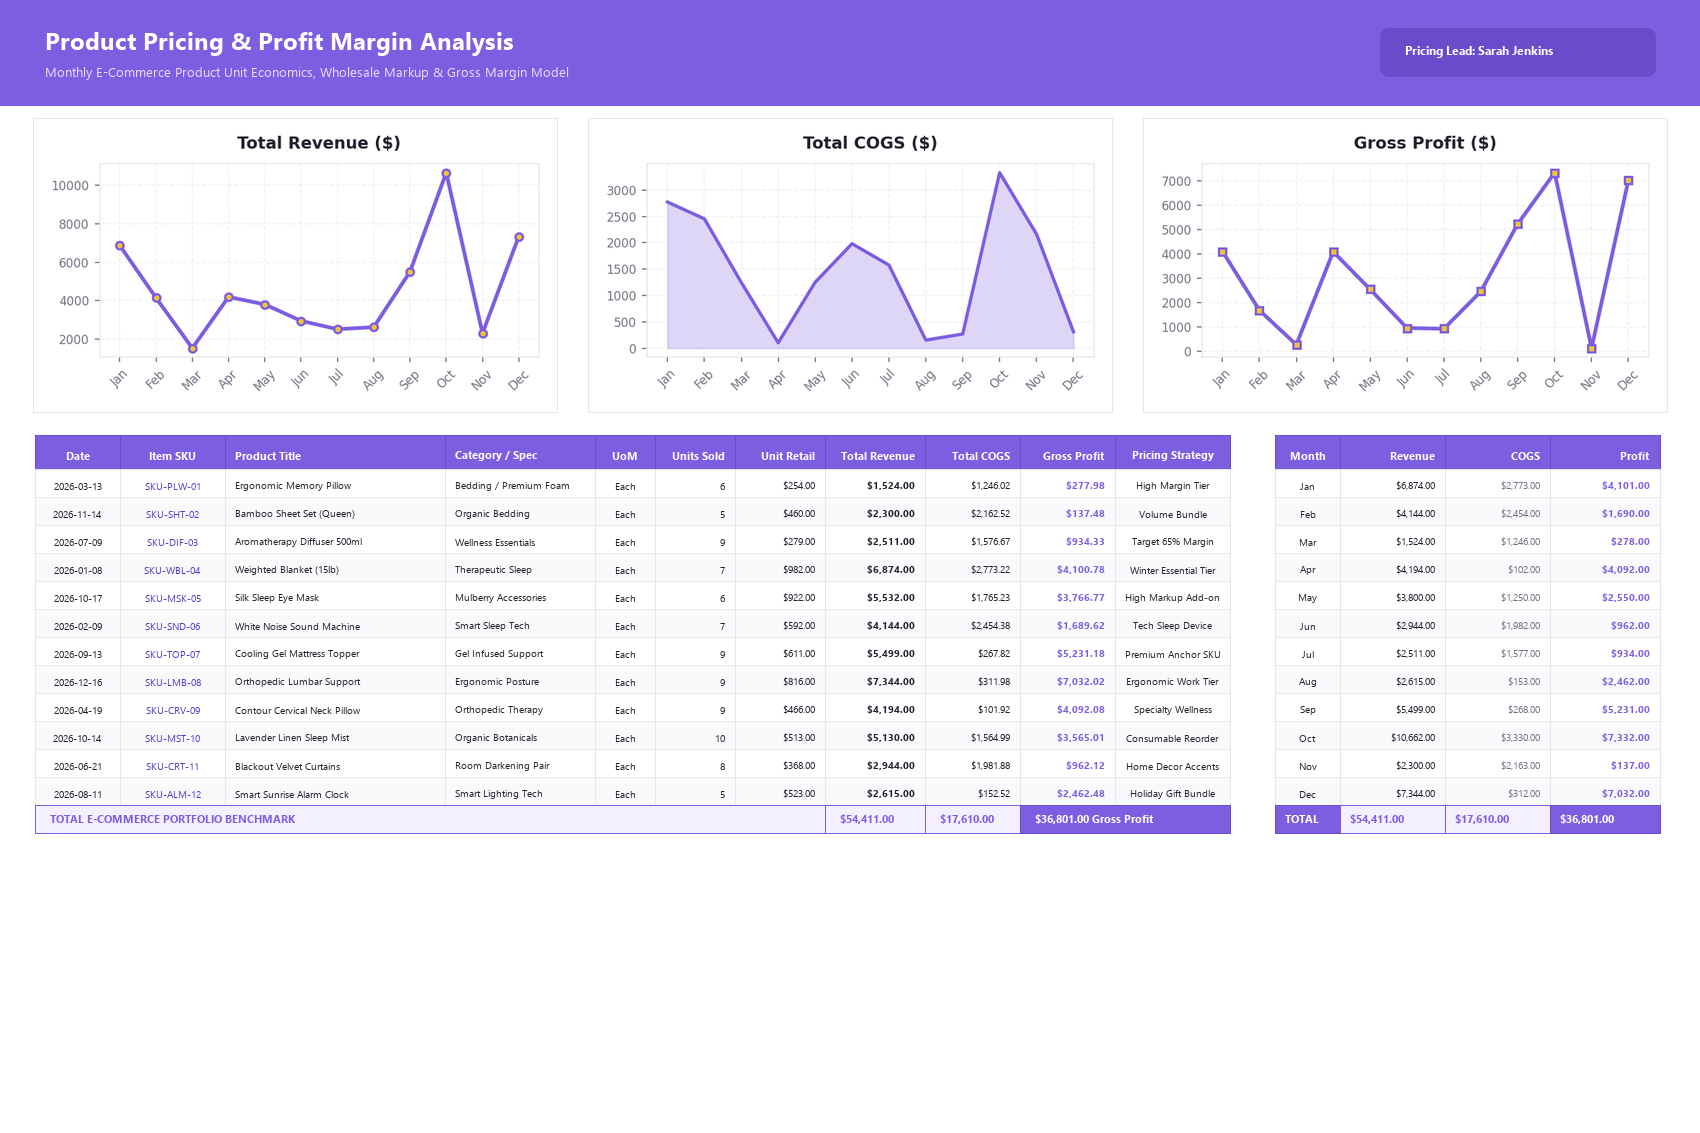
Workbook Blueprint: The Product Pricing & Profit Margin Analysis model showing executive trend charts, SKU pricing ledger, and monthly rollups.
Now that the catalog structure is established, let us write the unit revenue and profit formulas.
Setting Up Revenue Formulas, Profit Margins, and Monthly Summaries
Setting up your pricing spreadsheet involves three straightforward steps: multiplying units sold by unit retail price, calculating gross profit contribution, and reviewing the executive dashboard.
Follow each step below:
1Step 1: Calculate Total Revenue from Units and Retail Price
Total product revenue represents gross customer billings before deducting any product expenses.
In cell J19, enter the multiplication formula: =H19*I19.
Here, cell H19 represents Units Sold (6) and cell I19 is the Unit Retail Price ($254.00). Cell J19 calculates $1,524.00 in total sales for Ergonomic Memory Pillows.
Copy this formula down through row 30 to compute total revenue for all 12 items in your inventory catalog.
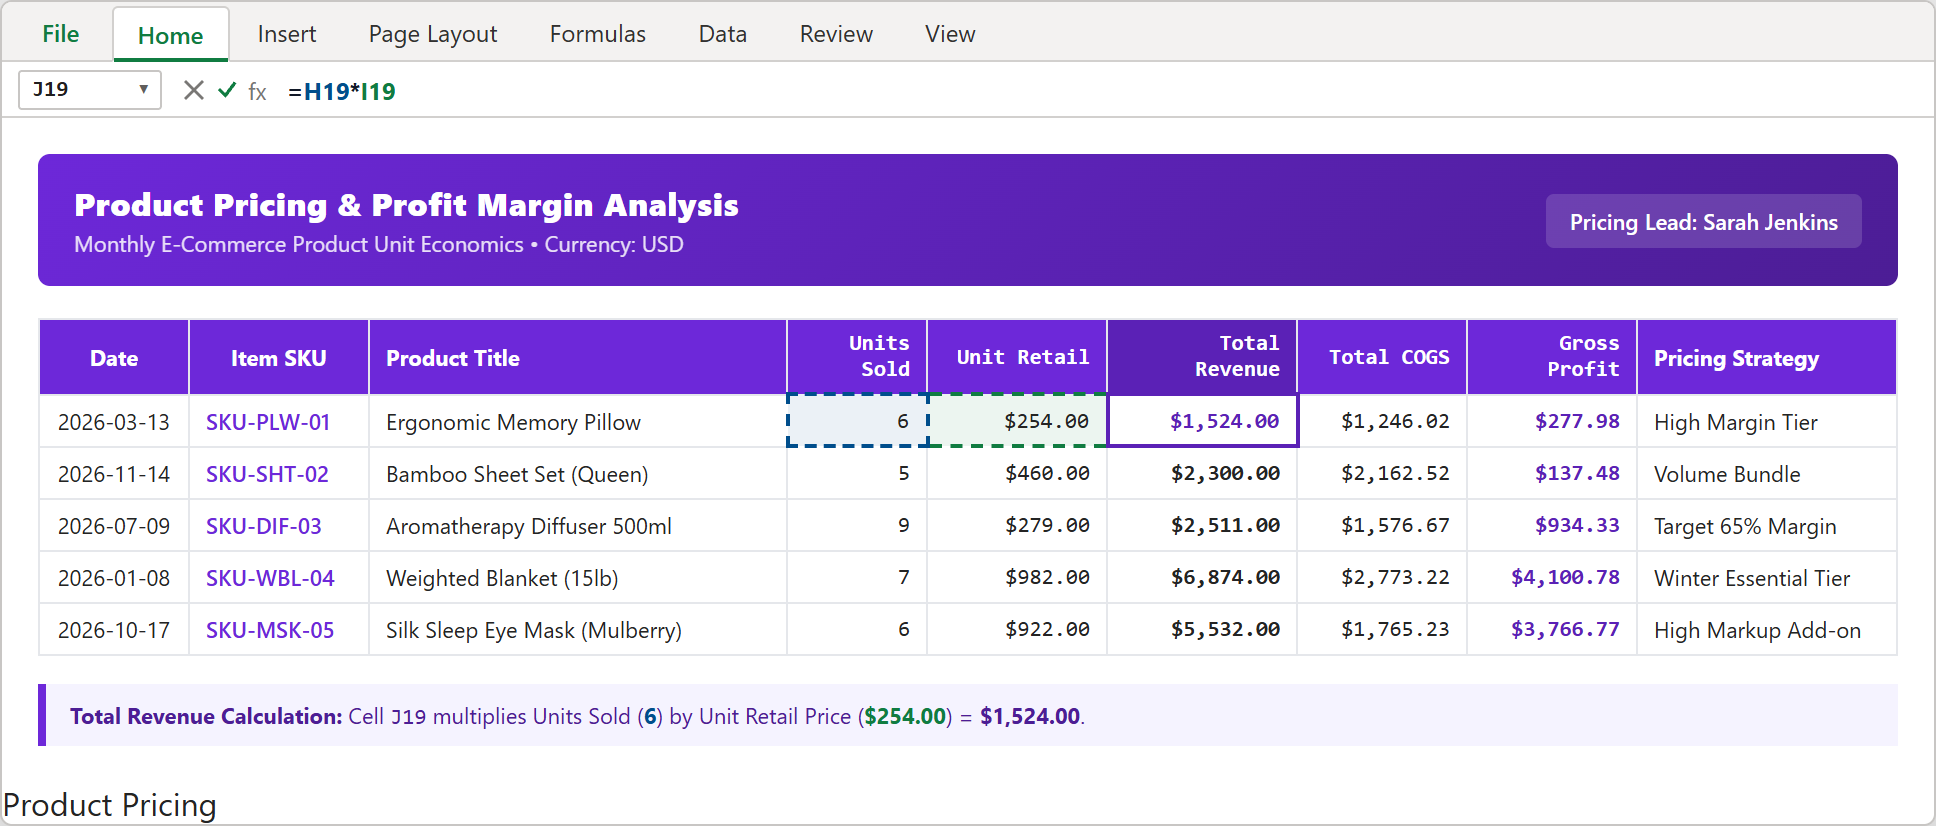
Step 1: Formula bar showing =H19*I19 multiplying Units Sold by Unit Retail Price to calculate gross revenue in cell J19.
2Step 2: Calculate Gross Profit After Deducting COGS
Gross profit tells you how many dollars each product leaves in your business after paying supplier and manufacturing costs.
In cell L19, enter the profit subtraction formula: =J19-K19.
Cell J19 is Total Revenue ($1,524.00) and cell K19 is Total COGS ($1,246.02). Cell L19 outputs a gross profit of $277.98.
Notice that higher-priced items like the Weighted Blanket (cell L22) generate $4,100.78 in gross profit, providing strong cash contributions to cover fixed warehouse overhead.
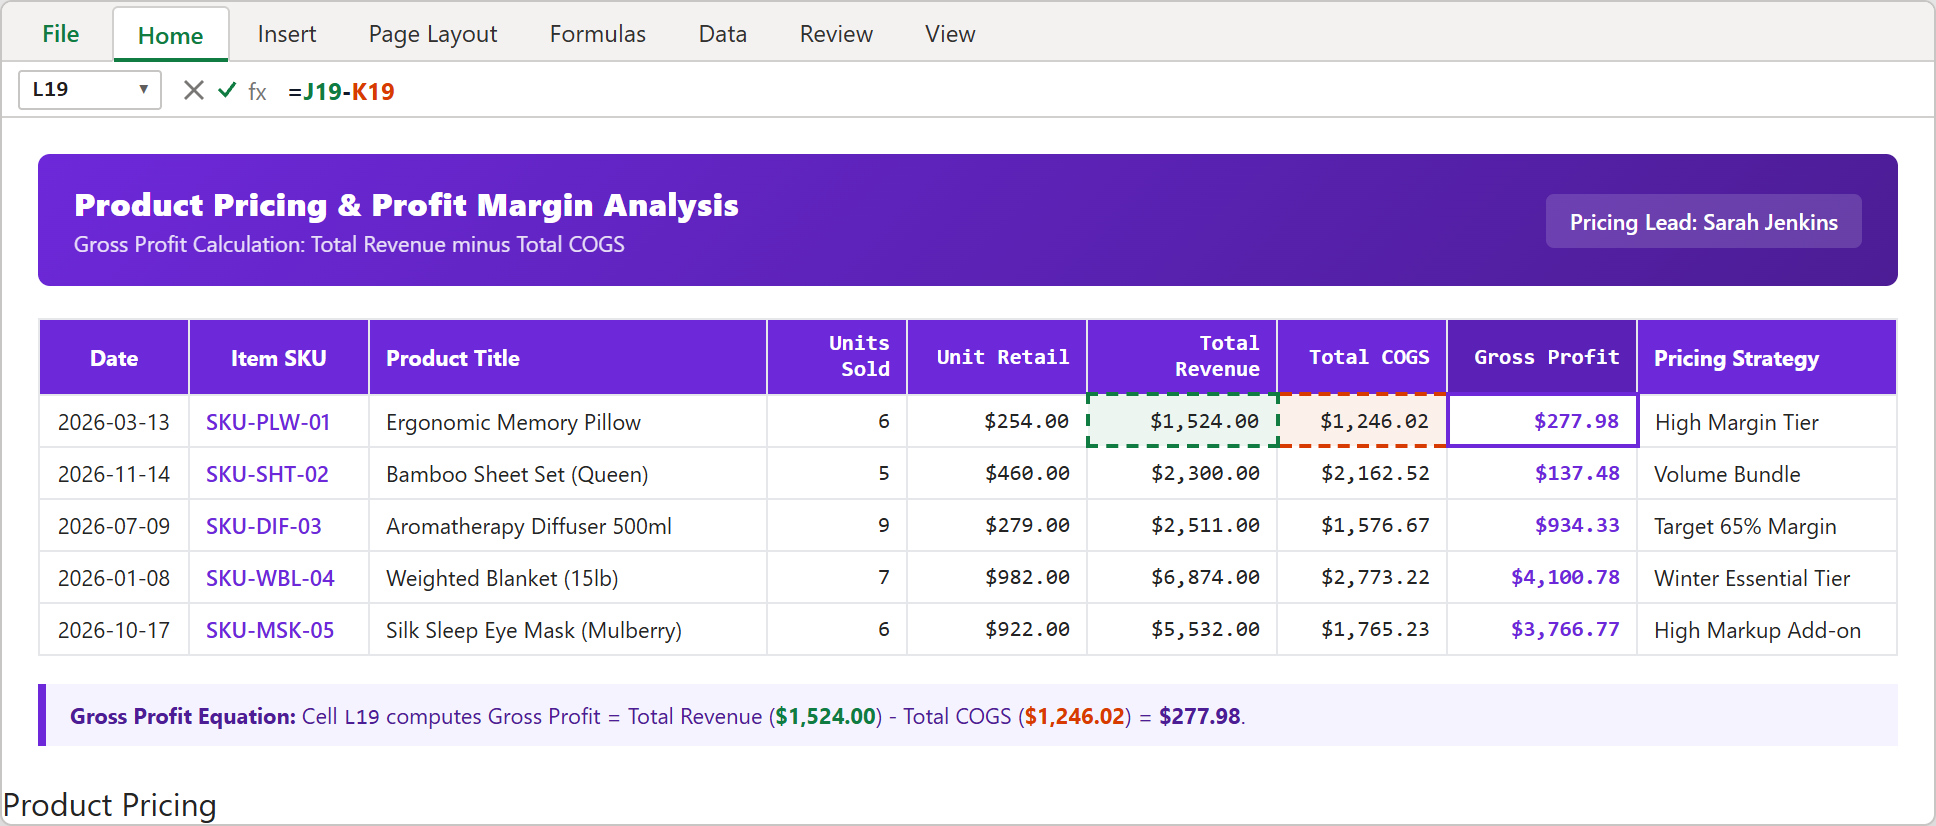
Step 2: Formula bar showing =J19-K19 subtracting Total COGS from Total Revenue to determine gross profit.
3Step 3: Executive Margin Dashboard and Monthly Rollup
Now review the completed executive dashboard view.
Top KPI cards highlight the overall health of your catalog: Total Revenue ($54,411.00) across 87 units sold, Total COGS ($17,610.00) representing 32.4% of sales, and Consolidated Gross Profit ($36,801.00) delivering an impressive 67.6% profit margin.
The monthly rollup table on the right highlights seasonal demand surges, with October delivering peak revenue of $10,662.00 and $7,332.00 in profit.
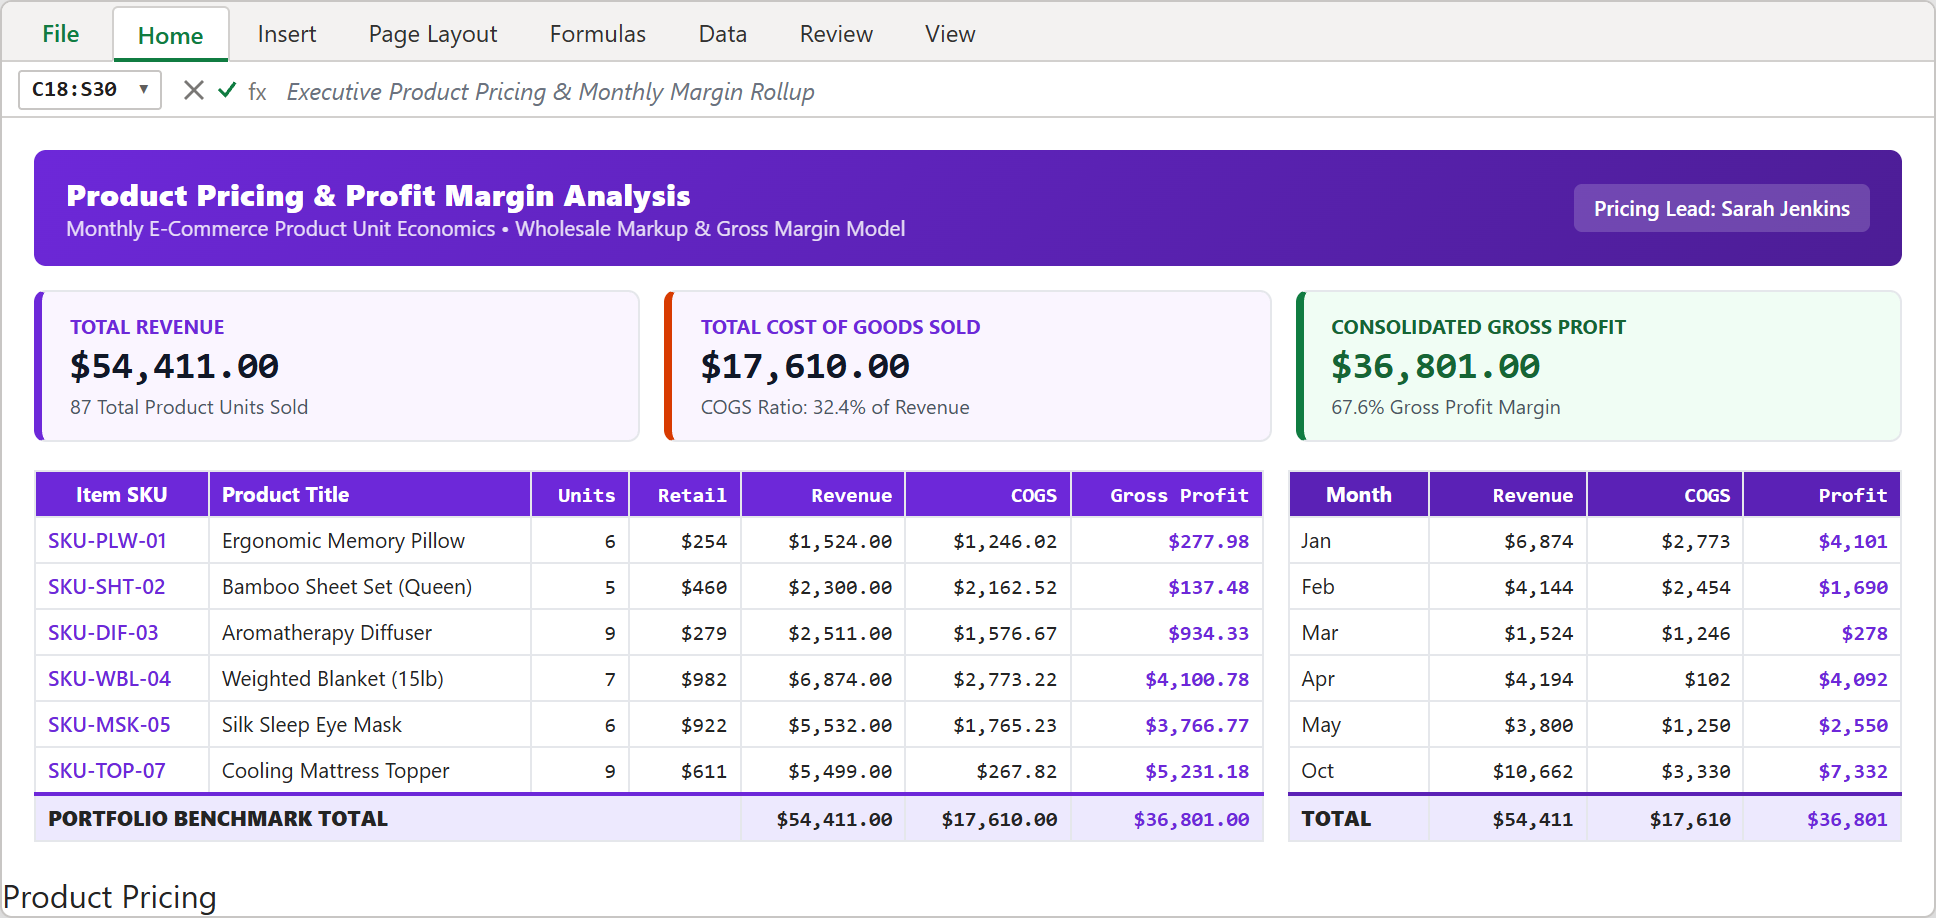
Step 3: Completed pricing workstation displaying top KPI cards, itemized SKU ledger, and monthly revenue and profit rollups.
Retail Pricing Strategies and Margin Safeguards
To maintain healthy retail margins and protect your bottom line, follow these three pricing rules:
1. Do Not Confuse Markup with Margin: A 50% markup on a $100 cost gives a $150 selling price, which is only a 33.3% gross margin. Always price based on target gross margin: Price = Cost / (1 - Target Margin%).
2. Factor In Landed Shipping: Never use factory FOB cost alone. Add customs tariffs, ocean freight, and pallet warehousing fees into column K before calculating profit.
3. Bundle Low-Margin Inventory: If a product carries a slim margin (like bamboo sheets at under 10%), bundle it with high-margin add-ons (like silk sleep masks at 68% margin) to preserve healthy order values.
Conclusion and Next Steps
You have built an e-commerce Product Pricing & Profit Margin Calculator in Microsoft Excel. With automated revenue formulas, landed cost deductions, and monthly summary cards, you can set prices with complete financial confidence.
Download the template below to plug in your own catalog SKUs, or practice adjusting unit economics directly inside our interactive spreadsheet playground.

Spreadsheet educator and web developer passionate about hands-on interactive spreadsheet practice.
Related Practical Exercises
Explore more hands-on spreadsheet models with downloadable practice workbooks.
 Productivity
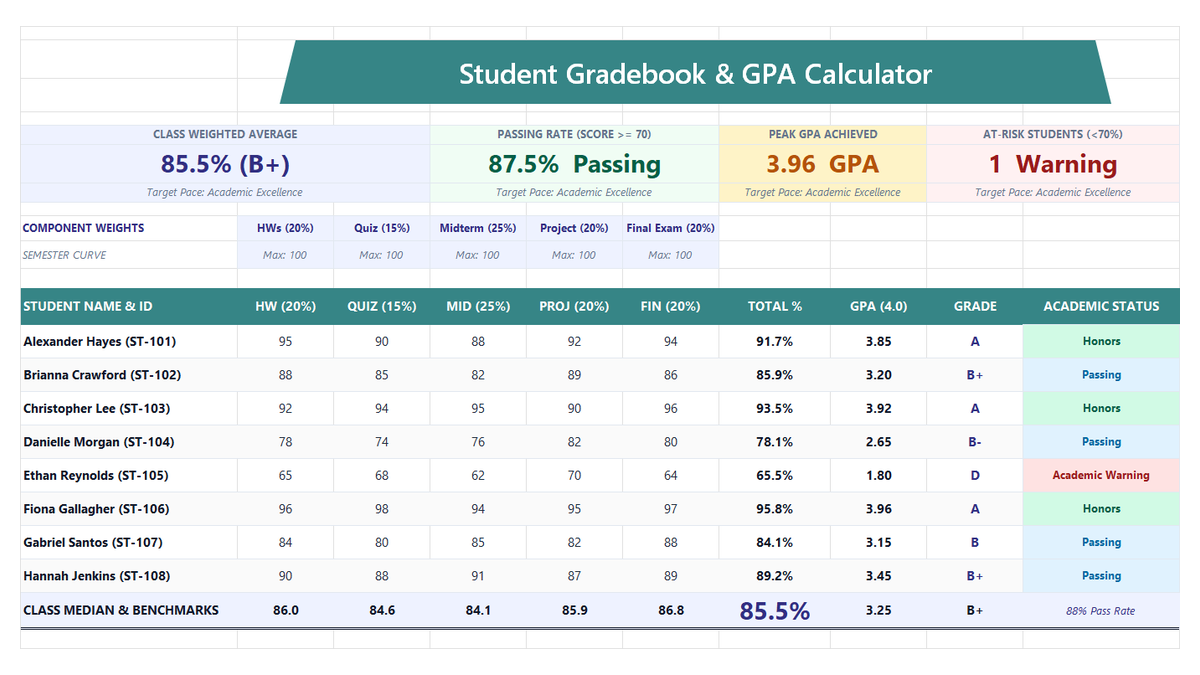
Student Gradebook GPA Calculator Excel Template
Build a practical student gradebook and semester GPA calculator in Microsoft Excel to compute weighted course grades, letter conversions, and class performance benchmarks.
 Operations
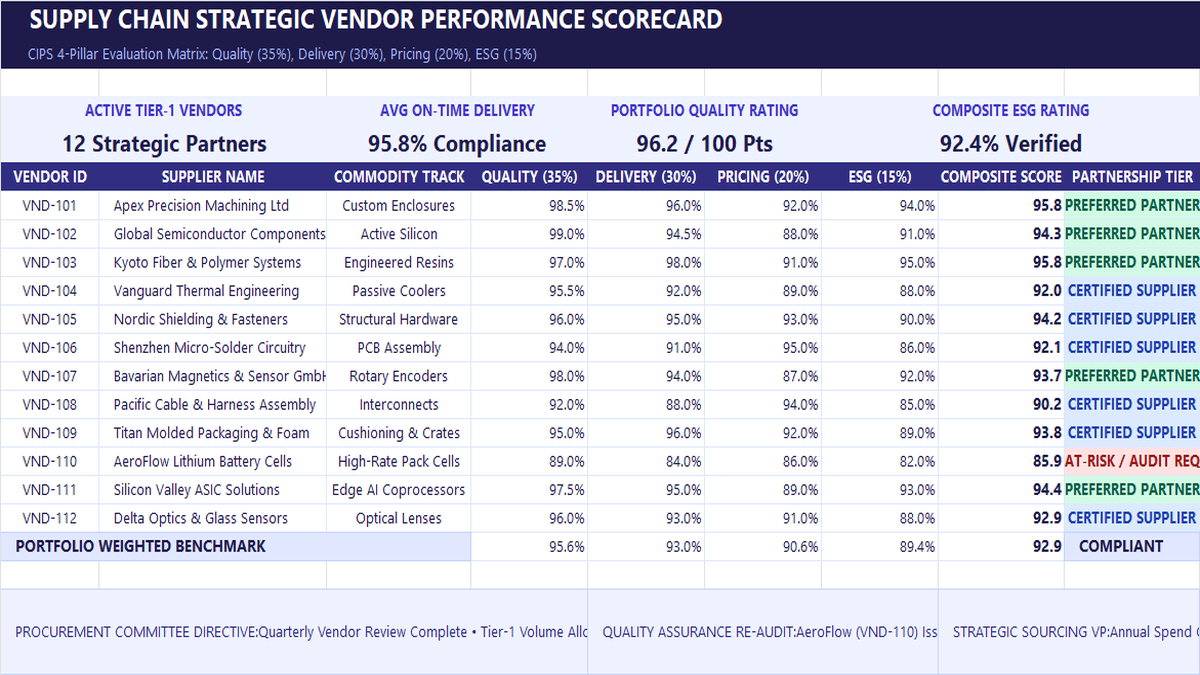
Vendor Performance Scorecard Excel Template
Learn strategic vendor evaluation in Microsoft Excel. Build a CIPS-compliant 4-pillar scorecard weighting Quality (35%), Delivery (30%), Pricing (20%), and ESG (15%). Automate weighted composite scores with SUMPRODUCT, calculate portfolio OTIF delivery, and establish tier-based purchase order allocations.
 Productivity
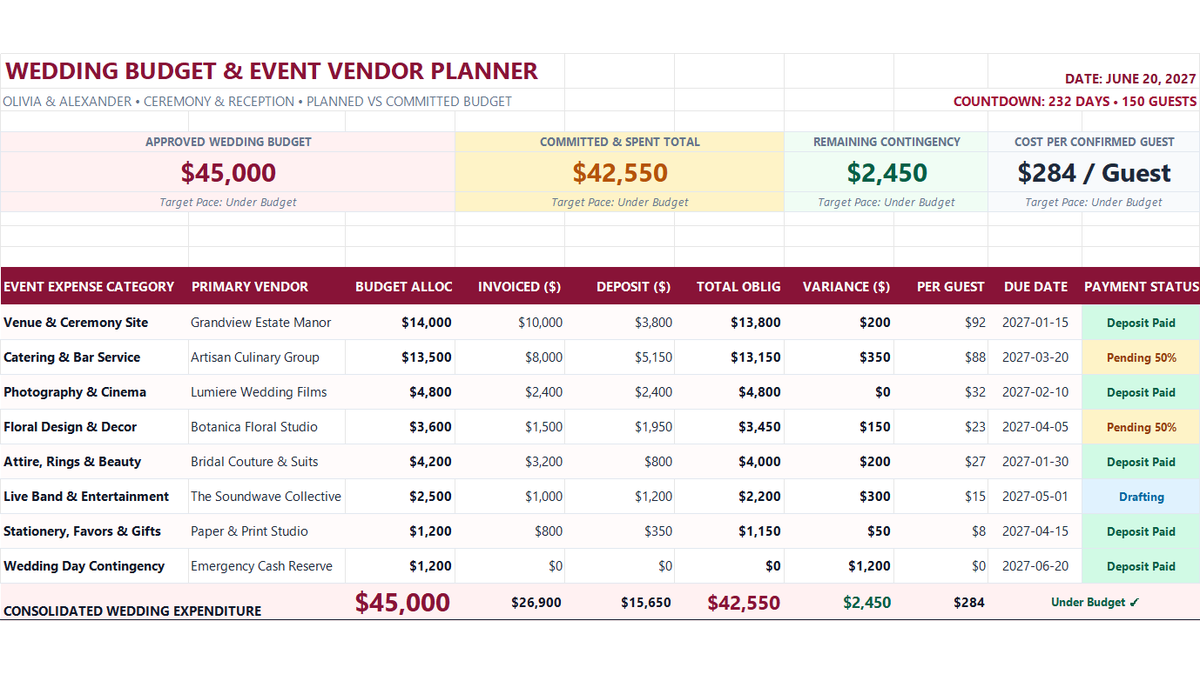
Wedding Budget Tracker Excel Template
Learn how to build a wedding budget expense tracker in Microsoft Excel featuring single-sheet architecture, vendor deposit schedules, cost-per-guest formulas, and contingency reserve scorecards.
 Sales
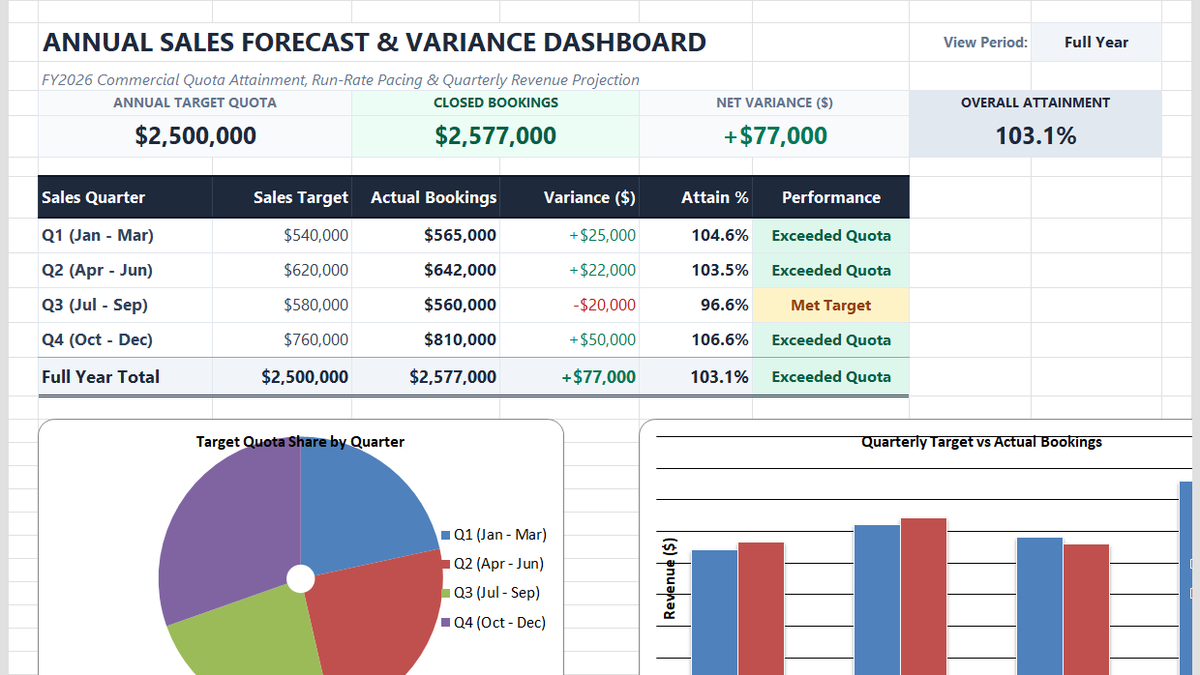
Annual Sales Forecasting Model Excel Template
Learn commercial revenue forecasting in Microsoft Excel. Build an annual sales forecasting dashboard featuring quarterly variance calculations, dynamic quota attainment metrics, clustered column comparison charts, and executive pacing scorecards.
 Finance
Budget vs Actual Variance Analysis Excel Template
Learn how to build a corporate OPEX budget vs actual variance model in Microsoft Excel featuring departmental cost ledgers, automated dollar variances, in-cell data bars, and executive reconciliation scorecards.
Discussion
Ask questions, share formula tips, or discuss alternative approaches with fellow spreadsheet builders.
Loading discussion...