Managing personal wealth without a central balance sheet is difficult. When savings, investments, home equity, and debts are scattered across different banking apps, it is hard to know whether your total wealth is actually moving forward.
A personal balance sheet solves this problem. It brings all your assets and debts into one clear view. In this practical guide, we build a Personal Net Worth Tracker in Microsoft Excel. You will learn how to organize assets into clear tiers, calculate your exact net worth, track year-over-year growth, and build an executive wealth dashboard.
Personal Balance Sheet Layout and Structure
A strong net worth tracker uses standard accounting principles. It organizes everything you own (assets) and everything you owe (liabilities) into clear groups.
In our workbook, row 4 through 7 display executive KPI cards. Rows 10 through 22 hold your asset schedule, grouped into liquid cash, retirement accounts, and real estate. Rows 24 through 27 list your liabilities, including mortgages and auto loans. Row 29 reconciles your consolidated net worth.
Review the data structure below before entering your initial balances:
| Col | Field Name | Type | Format | Operational Role |
|---|---|---|---|---|
| B | Asset / Liability Category | Text | General | Financial line item (Emergency Cash, Index Funds, Primary Mortgage). |
| C | Prior Year Value ($) | Currency | $#,##0 | Audited baseline balance from December 31 of prior year. |
| D | Current Value ($) | Currency | $#,##0 | Current market value of the asset or remaining debt balance. |
| E | Net Change ($) | Formula (Currency) | $#,##0 | Dollar growth or debt reduction: =D11-C11. |
| F | YoY Growth (%) | Formula (Percentage) | +0.0%;-0.0% | Annual growth rate of asset or liability: =(D11-C11)/C11. |
| G | % of Total | Formula (Ratio) | 0.0% | Share of total gross assets: =D11/$D$22. |
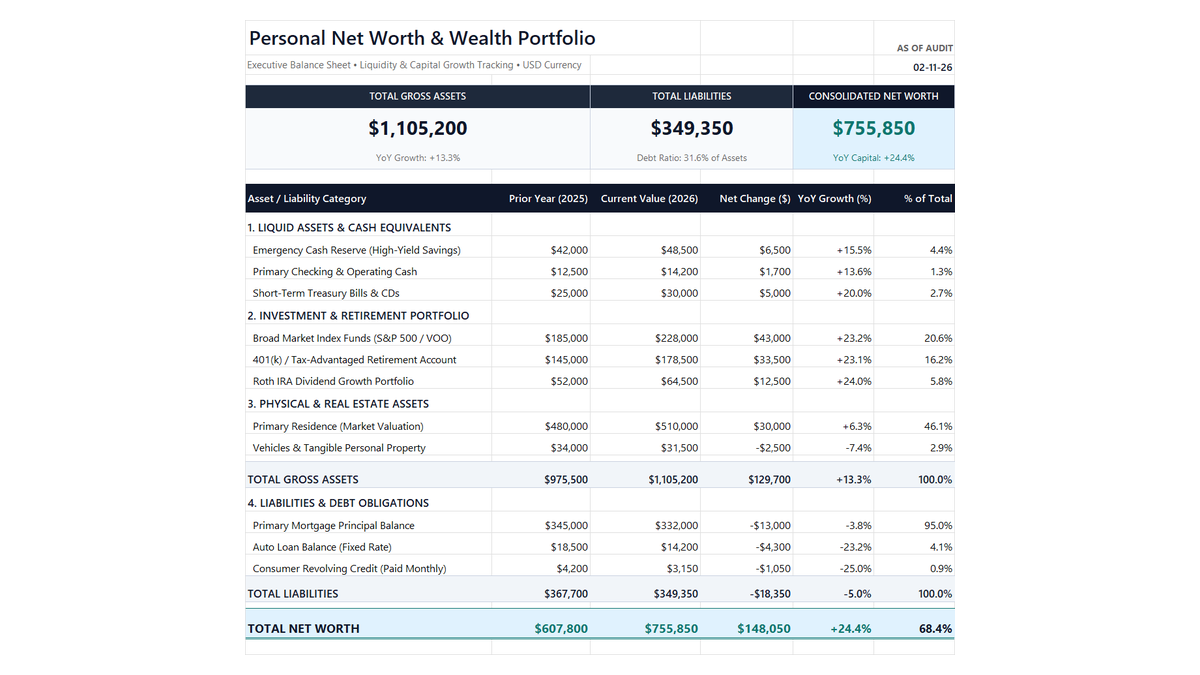
Workbook Blueprint: The Personal Net Worth Tracker architecture displaying wealth scorecards, asset categories, and debt liabilities.
With our ledger structure ready, let us apply professional formatting and configure the core formulas.
Setting Up Accounting Formats, Growth Formulas, and Wealth Rollups
Setting up your tracker involves three clear steps: applying accounting currency formatting, writing subtraction and growth formulas, and auditing your final balance sheet dashboard.
Follow each step below:
1Step 1: Apply Accounting Number Format via Dialog Box
Before entering large financial figures, format columns C through E as Accounting with 0 decimal places. This aligns dollar signs to the left margin and keeps numbers easy to read across long rows.
Select range C11:E29, press Ctrl + 1 to open the Format Cells dialog, choose Accounting in the Category list, set Decimal places to 0, and select $ ($) under Symbol.
Click OK. Negative liabilities will now display cleanly in parentheses, and zero balances will show as dashes.
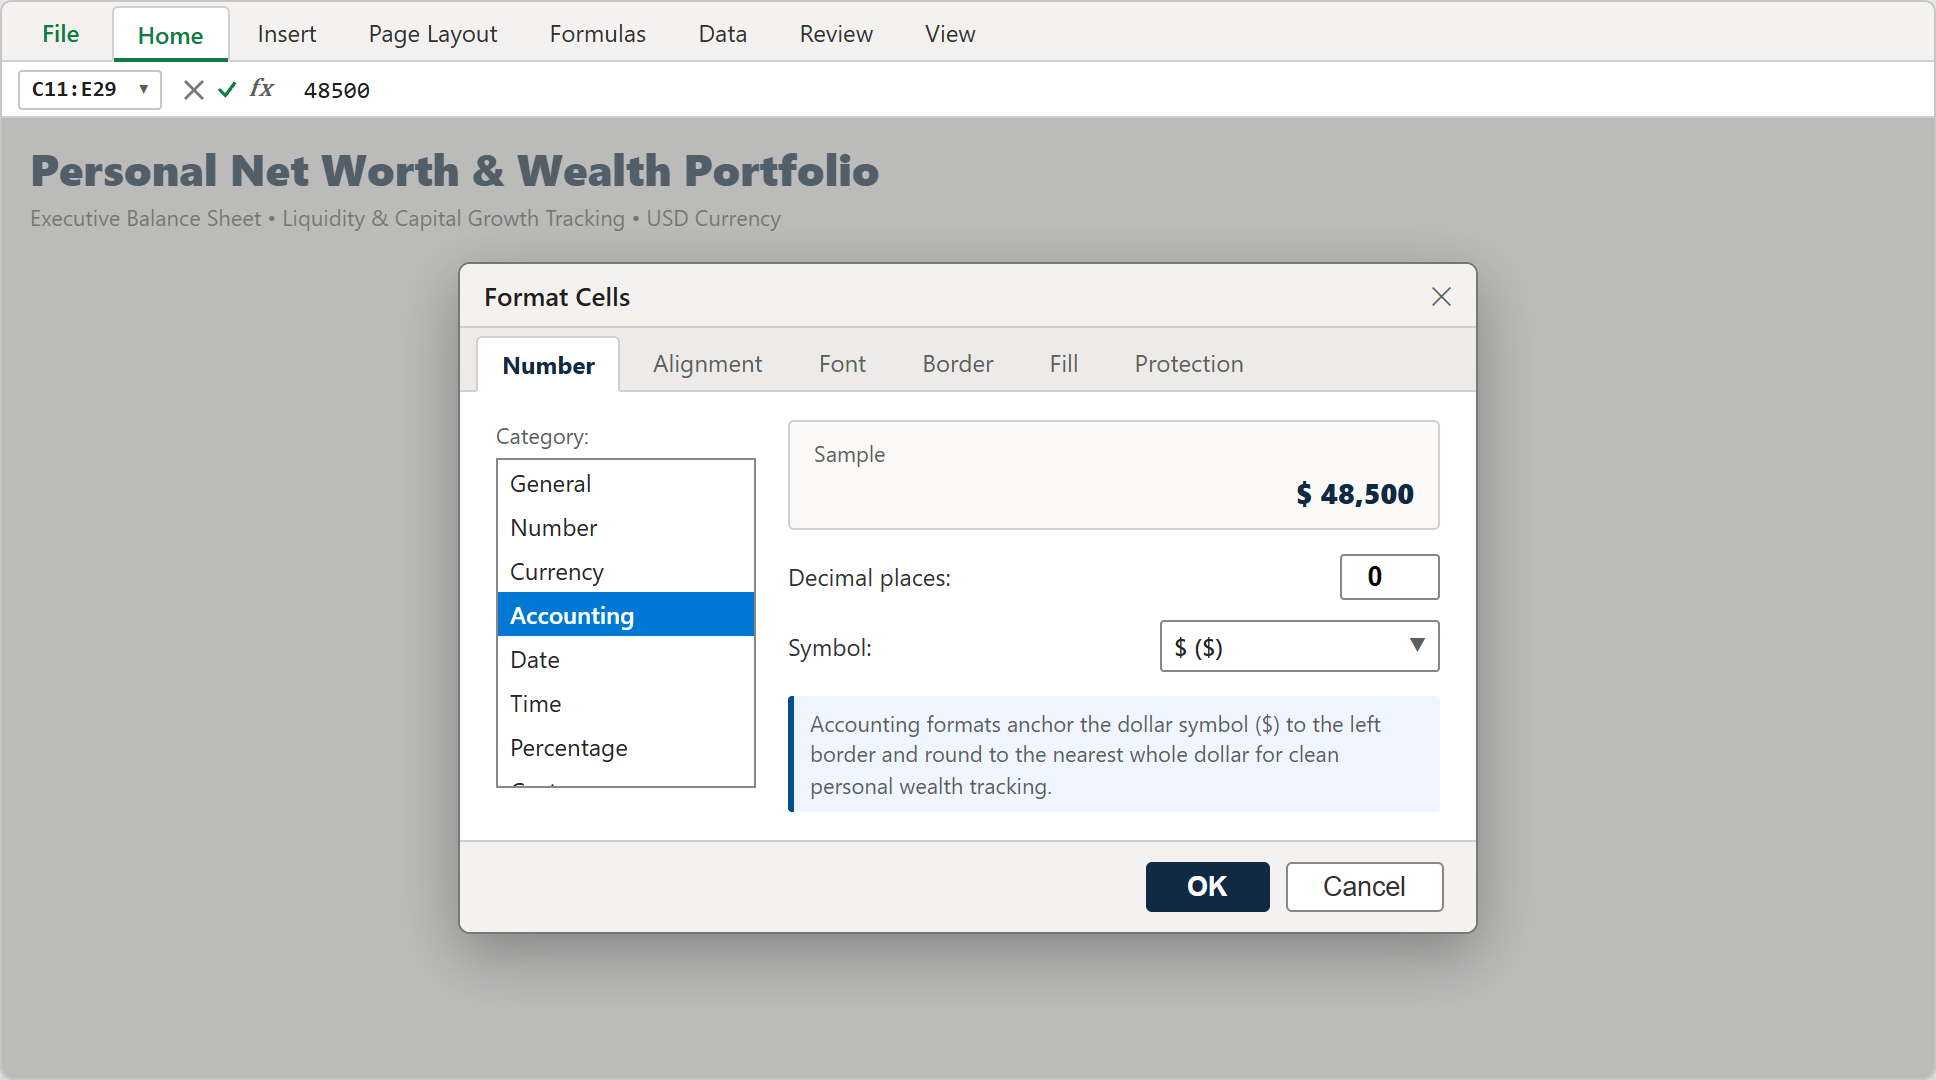
Step 1: Excel Format Cells dialog configuring Accounting format with zero decimal places for clean wealth tracking.
2Step 2: Calculate Net Worth Rollforward and Year-Over-Year Growth
The core rule of personal accounting is simple: Net Worth = Total Assets - Total Liabilities.
In cell D29, enter the net worth equation: =D$22-D$27.
Here, cell D22 sums your gross assets ($1,105,200) and cell D27 sums total liabilities ($349,350). Cell D29 outputs your current net worth of $755,850.
In cell E29, calculate total dollar expansion using =D29-C29 (an increase of +$148,050). In cell F29, calculate percentage growth using =E29/C29, yielding a strong +24.4% year-over-year gain.
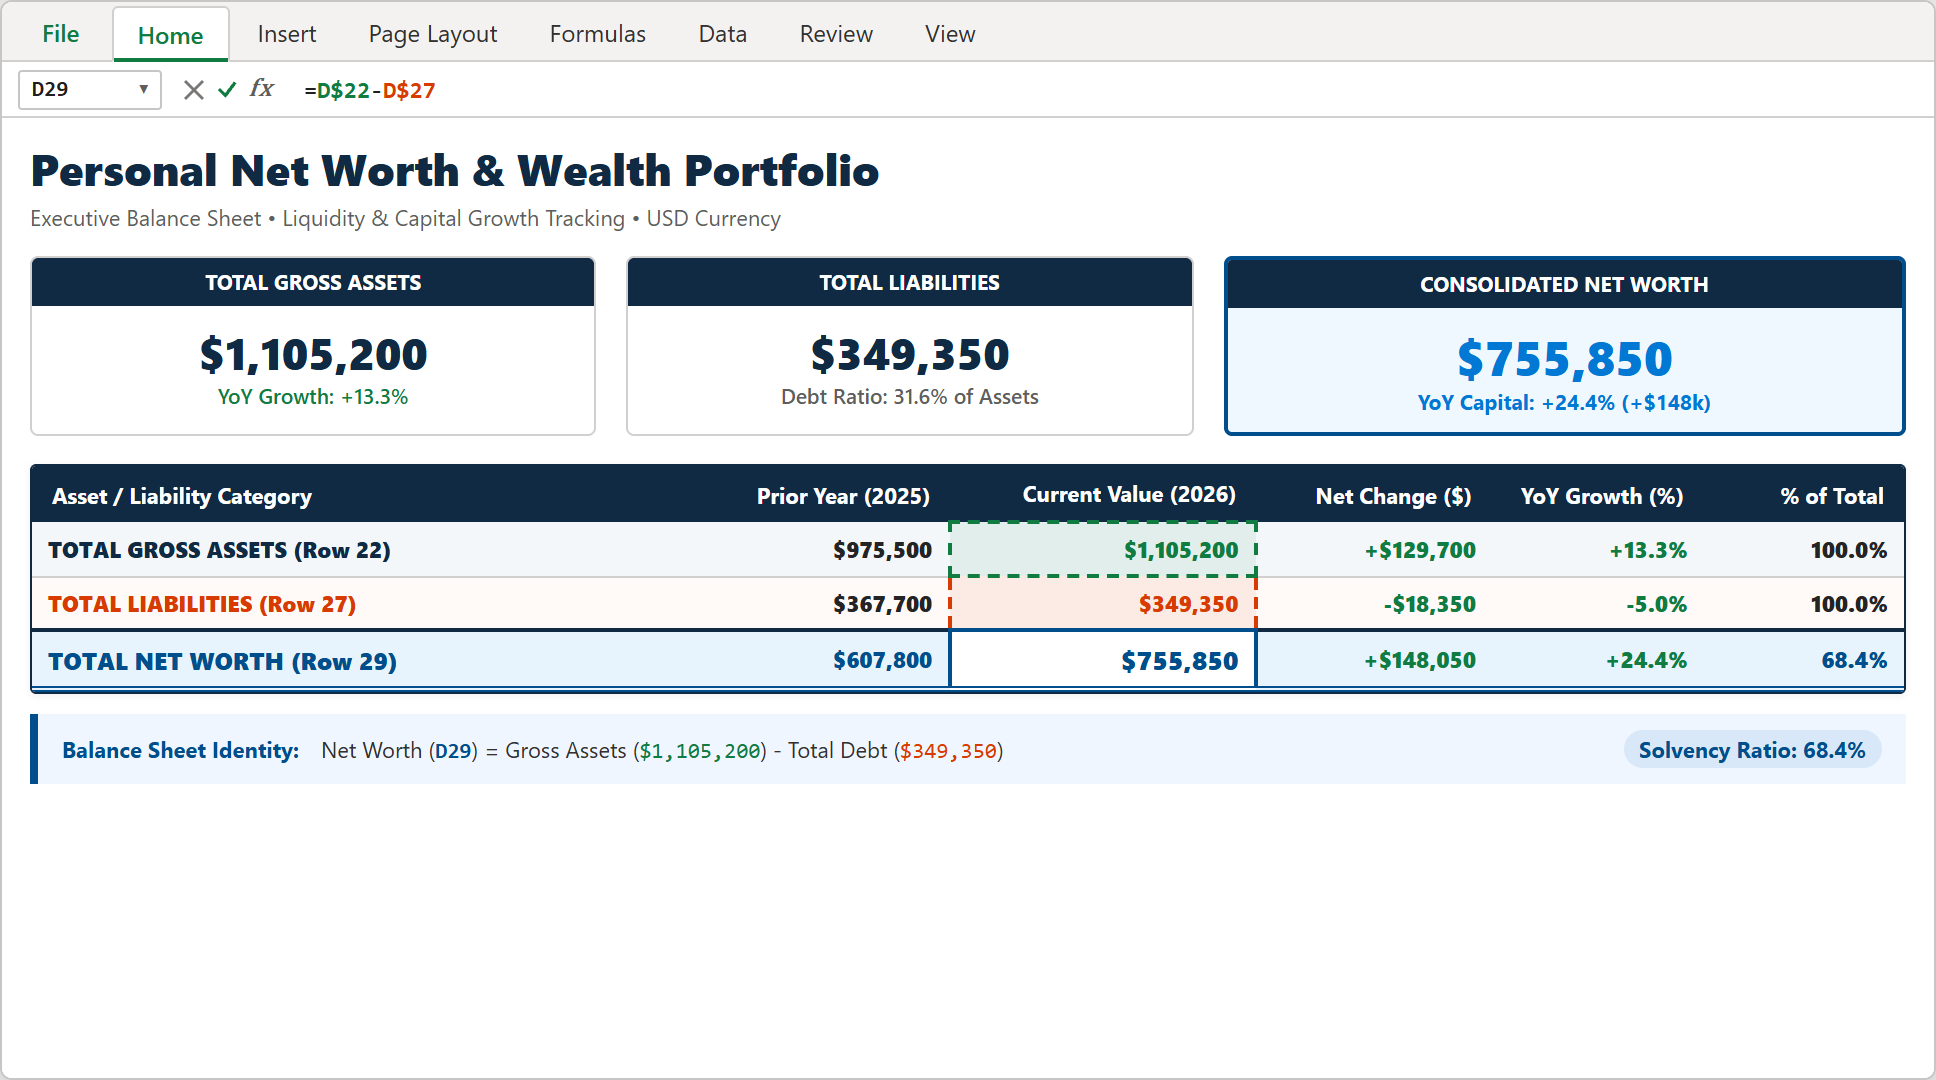
Step 2: Active formula bar showing =D$22-D$27 subtracting total debt from gross assets to derive consolidated net worth.
3Step 3: Executive Wealth Dashboard and Allocation Summary
Now look at the completed balance sheet view. Top KPI cards summarize your three essential financial numbers: Total Gross Assets ($1,105,200), Total Liabilities ($349,350), and Consolidated Net Worth ($755,850).
The portfolio allocation section highlights where your capital is invested: 43.9% in Real Estate equity, 26.6% in Retirement accounts, 19.5% in Brokerage equities, and 6.9% in Liquid cash reserves.
Notice your solvency ratio: your net worth represents 68.4% of your total asset base, proving steady debt paydown and solid financial health.
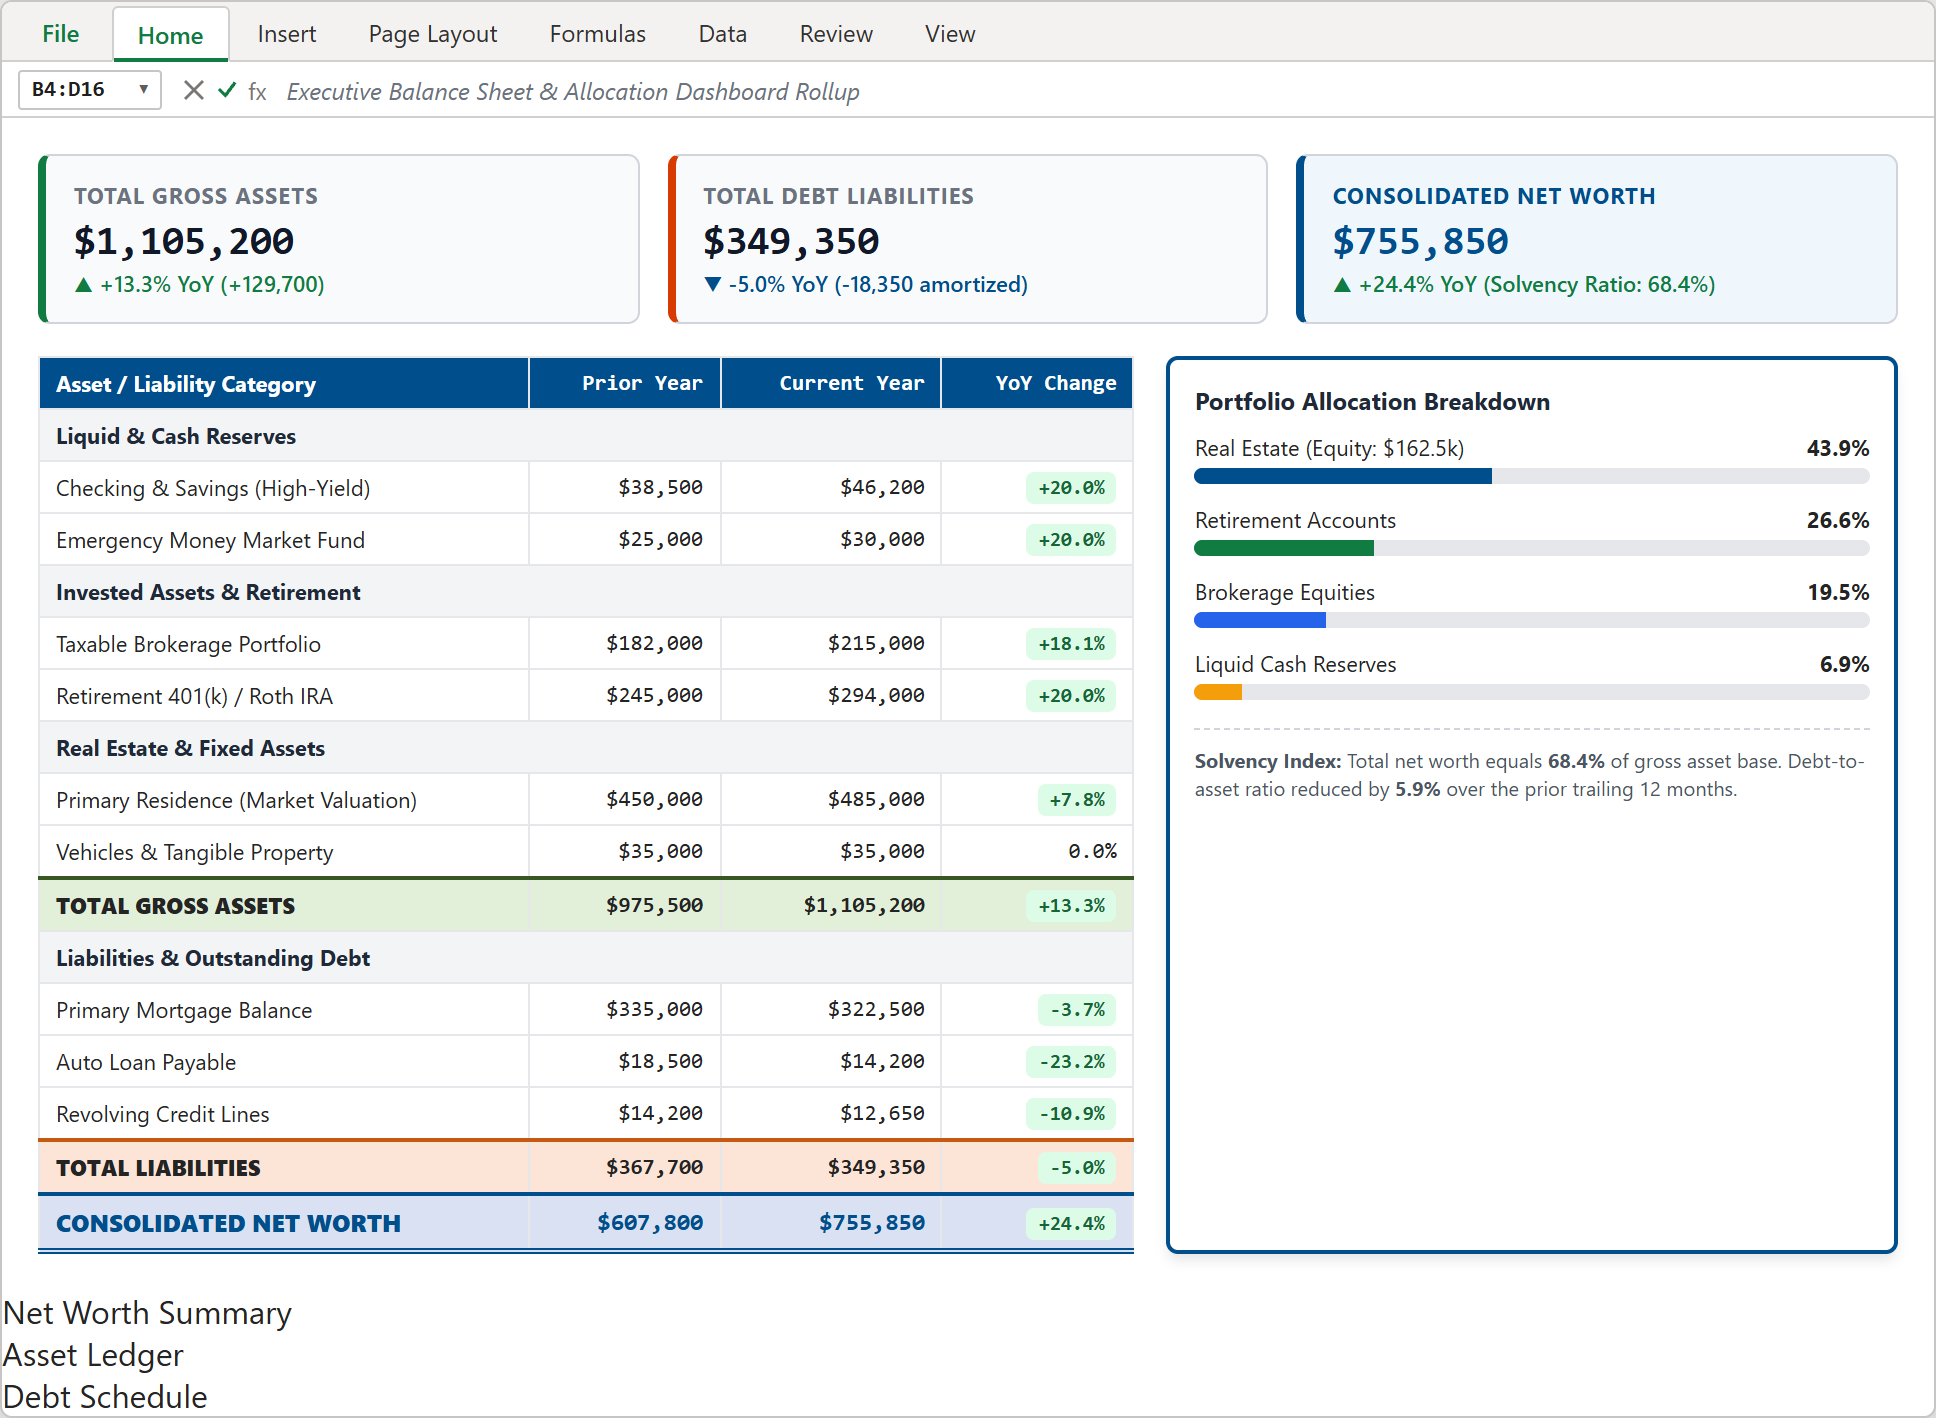
Step 3: Completed personal balance sheet showing top KPI cards, itemized asset rows, and portfolio allocation bars.
Personal Balance Sheet Best Practices and Rules
To keep your net worth tracker accurate and useful over time, follow these three practical guidelines:
1. Keep 6 Months in Cash: Always hold 3 to 6 months of living expenses in liquid high-yield savings before making aggressive investments.
2. Watch Your Debt Ratio: Keep total liabilities below 35% of your total gross assets to protect against real estate or market drops.
3. Update Once per Quarter: Reconcile your account balances on the first weekend of every quarter. Updating too often creates unnecessary stress from normal market swings.
Conclusion and Next Steps
You have built a reliable Personal Net Worth Tracker in Microsoft Excel. With structured asset schedules, automated subtraction formulas, and clear KPI summaries, you now have complete visibility over your financial journey.
Download the template below to plug in your own numbers, or practice adjusting formulas directly inside our interactive spreadsheet playground.

Spreadsheet educator and web developer passionate about hands-on interactive spreadsheet practice.
Related Practical Exercises
Explore more hands-on spreadsheet models with downloadable practice workbooks.
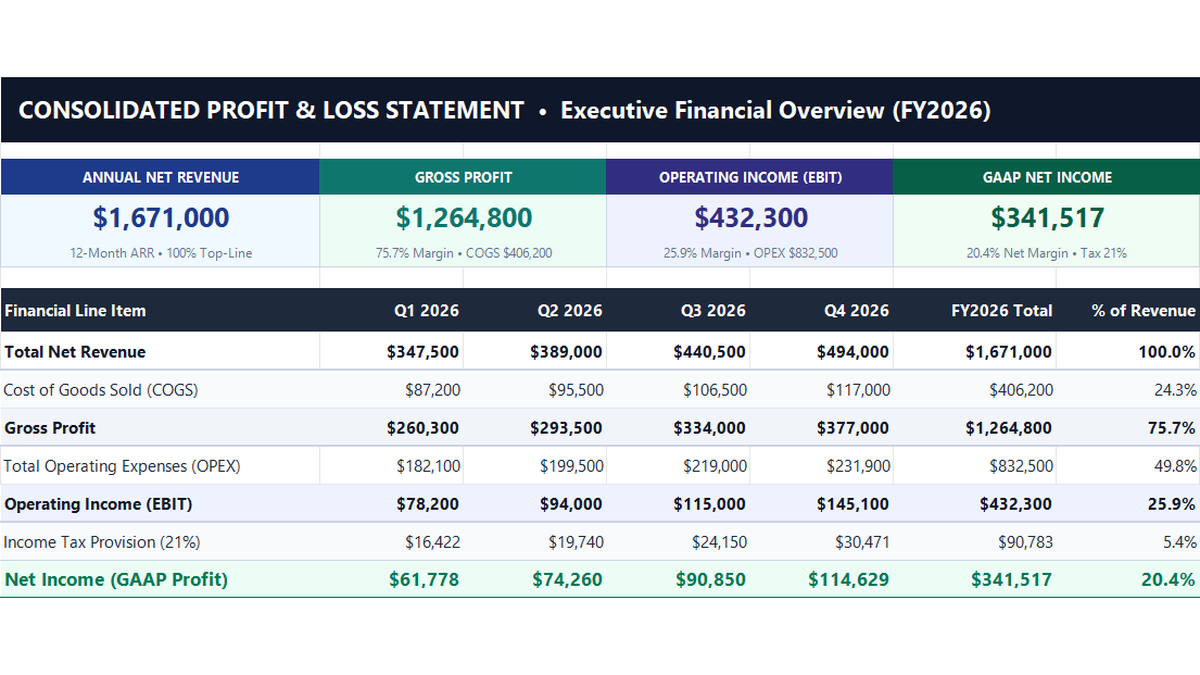 Finance
Profit and Loss Statement Excel Template
Build a standard 12-month corporate profit and loss statement in Microsoft Excel to track revenue lines, cost of goods sold, operating expenses, and net profit margins.
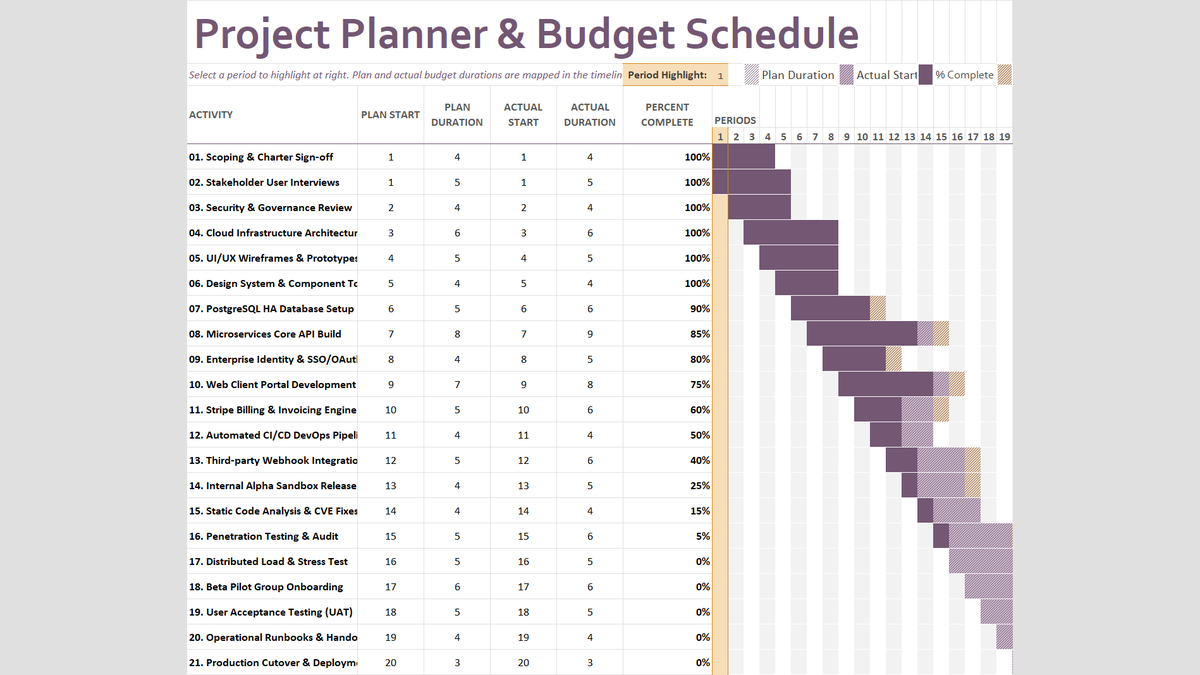 Project Management
Project Budget Estimator Excel Template
Build a practical project planner and budget schedule in Microsoft Excel to track planned versus actual durations, percent complete milestones, and dynamic timeline periods.
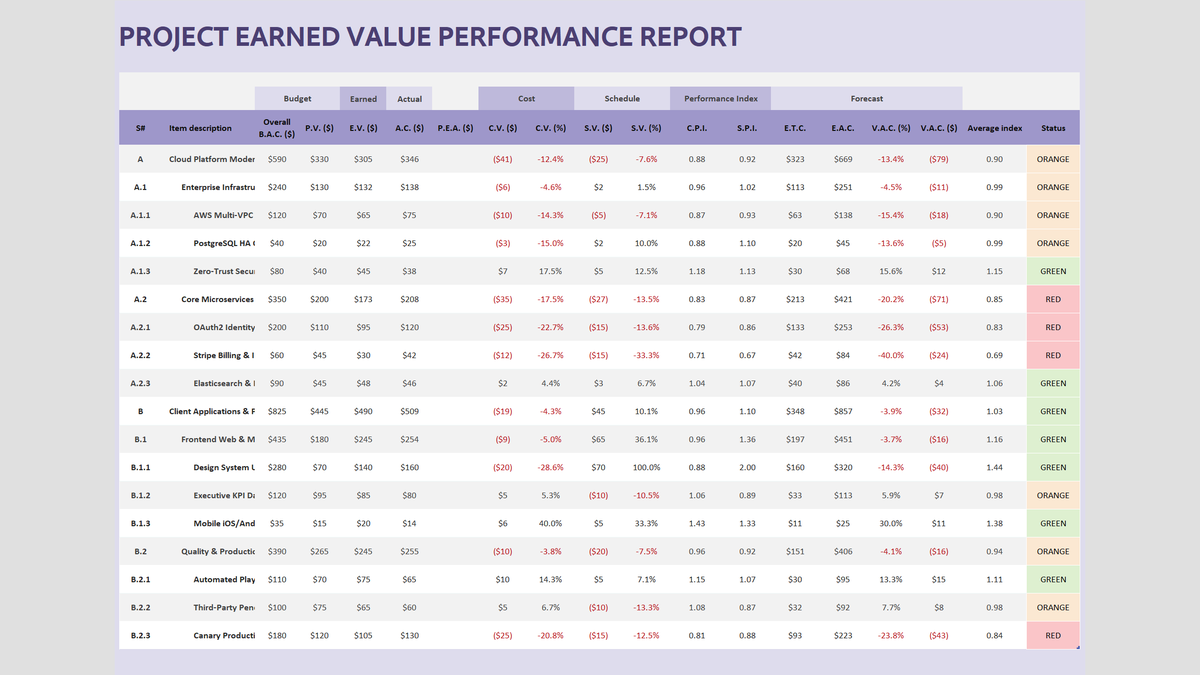 Project Management
Project Earned Value Performance Report Excel Template
Track capital project budgets and delivery deadlines using Earned Value Management (EVM) in Microsoft Excel. Calculate Cost Variance (CV), Schedule Variance (SV), Cost Performance Index (CPI), and Estimate at Completion (EAC) with automated red-amber-green status badges.
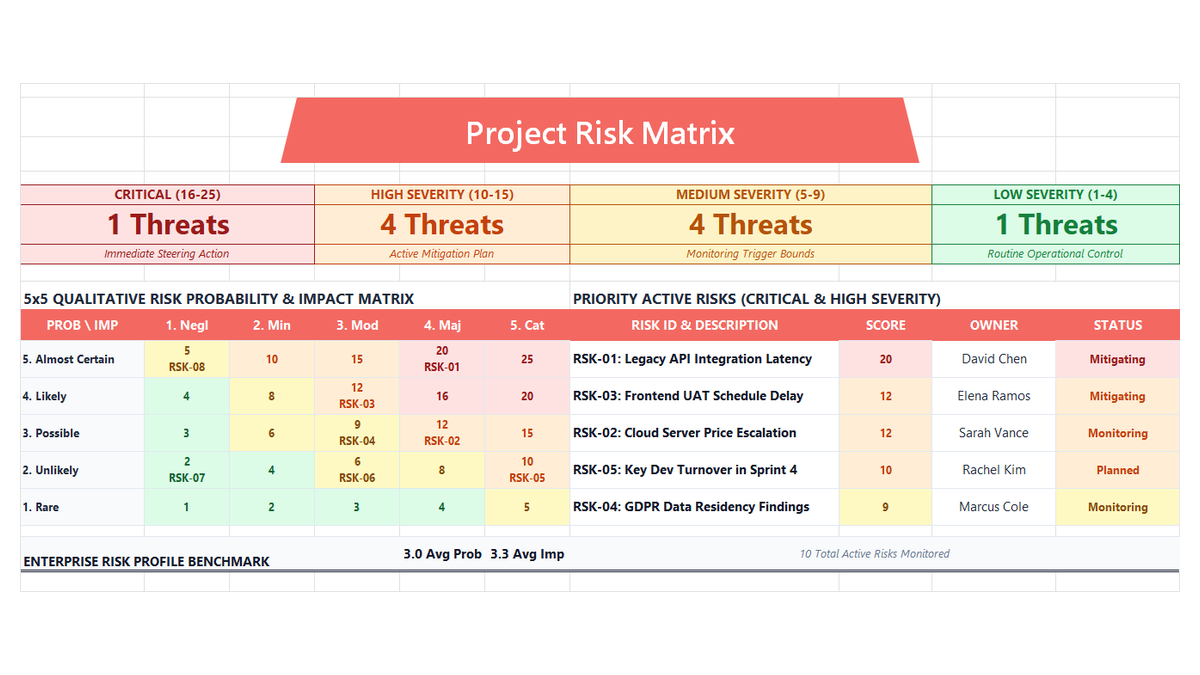 Project Management
Project Risk Register Excel Template
Learn enterprise risk governance in Microsoft Excel. Build an ISO 31000 and PMBOK-compliant 5x5 qualitative risk heatmap, automate probability and impact scoring, engineer multi-tier severity formulas, and enforce accountability with data validation.
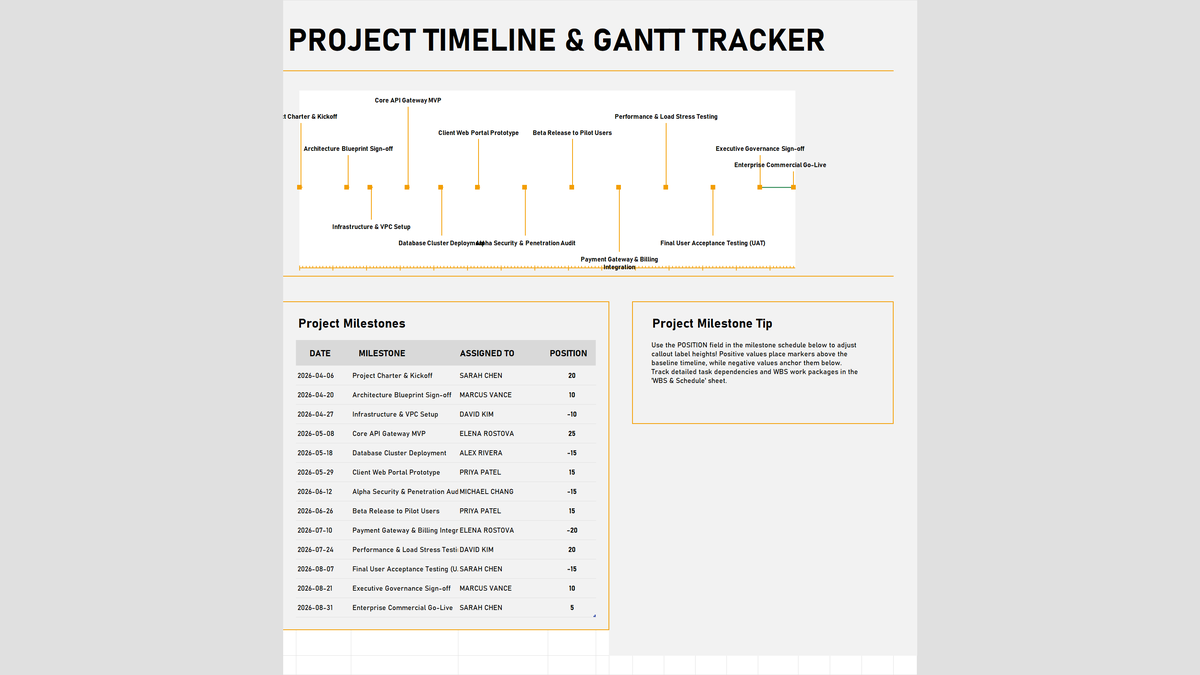 Project Management
Project Timeline & Gantt Tracker Excel Template
Visualize project milestones, key delivery dates, and executive roadmaps in Microsoft Excel. Build an interactive timeline and milestone tracker featuring dynamic calendar year formulas with =DATE(YEAR(TODAY())), standard ISO date formatting, alternating label position controls, and roadmap chart visuals.
Discussion
Ask questions, share formula tips, or discuss alternative approaches with fellow spreadsheet builders.
Loading discussion...