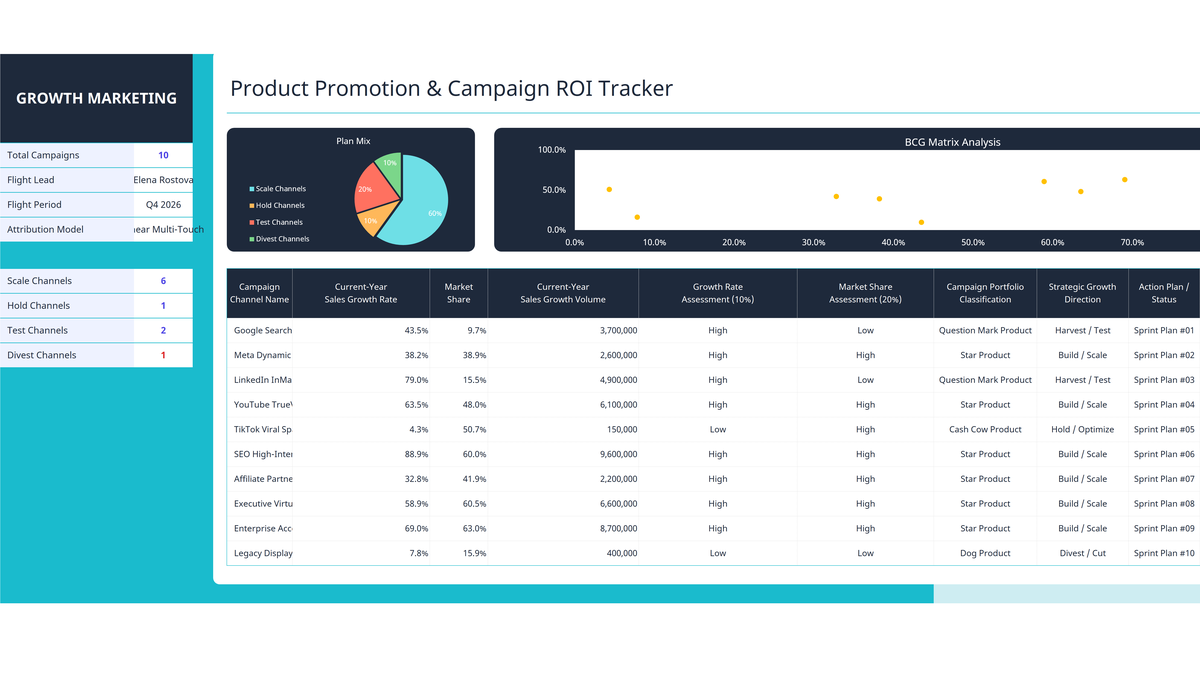
Where Did the Ad Spend Go? Measuring Real Campaign Returns
Marketing teams often launch campaigns across a dozen channels simultaneously: Google Search, Meta ads, TikTok influencers, email newsletters, and YouTube video ads. But when the quarter ends and leadership asks which channels drove profitable revenue, teams often struggle to compare a high-volume mature channel against a fast-growing experimental campaign.
Without a standard framework, companies end up pouring more money into declining channels while starving promising new channels of the budget they need to scale.
In this exercise, you will build a Product Promotion & Campaign ROI Tracker in Excel using the classic BCG Growth-Share Matrix. You will evaluate ten digital marketing channels, classify them into clear performance categories (Stars, Cash Cows, Question Marks, and Dogs), and assemble an executive dashboard that shows leadership exactly where to invest next.
Campaign Metrics & Portfolio Data Dictionary
The tracker is laid out across columns F through N, supported by an executive KPI sidebar (columns B through C) and reference lookup tables. Below is the complete data dictionary specifying the metrics and formulas used.
| Column | Metric Name | Formula / Type | Default Format | Workplace Meaning & Modeling Rule |
|---|---|---|---|---|
| F | Campaign Channel Name | Text | Left Align (Bold) | Digital channel or promotion initiative (e.g. Google Search, Meta Retargeting). |
| G | Sales Growth Rate | =VLOOKUP(F13, ...) | Percentage (0.0%) | Year-over-year revenue growth generated by the channel. |
| H | Market Share | =VLOOKUP(F13, ...) | Percentage (0.0%) | Relative share of total company pipeline contributed by this channel. |
| I | Growth Volume ($) | Formula Subtraction | Currency ($#,##0) | Absolute dollar increase in sales generated compared to the prior year. |
| J | Growth Assessment | =IF(G13>=10%, "High", "Low") | Text Badge | Compares growth against company 10% hurdle rate. |
| K | Market Share Assessment | =IF(H13>=20%, "High", "Low") | Text Badge | Compares share against company 20% significant volume threshold. |
| L | Portfolio Classification | Nested IF & AND Logic | Color-Coded Pill | Star Product (High/High), Cash Cow (Low/High), Question Mark (High/Low), Dog Product (Low/Low). |
| M | Strategic Direction | IF Lookup Logic | Text Strategy | Recommended action: Build/Scale, Hold/Optimize, Harvest/Test, or Divest/Cut. |
Building Your Campaign ROI Tracker Step by Step
Follow these three focused steps to build your campaign portfolio model. We will establish clean percentage formatting, formulate the four-quadrant classification logic, and review the executive visual command center.
3.1Step 1: Setting Single-Decimal Percentage Formatting
In marketing reports, growth rates and conversion shares look messy when displayed as raw decimals like 0.435 or 0.097. We need to display these clearly as 43.5% and 9.7% with a single decimal place.
Highlight the growth and share columns (cells G13:H22). Press Ctrl + 1 to open the Format Cells dialog.
Under Category, select Percentage. Set Decimal places to 1, then click OK.
Excel immediately formats the raw numbers into clean, board-ready percentage figures that make comparisons effortless.
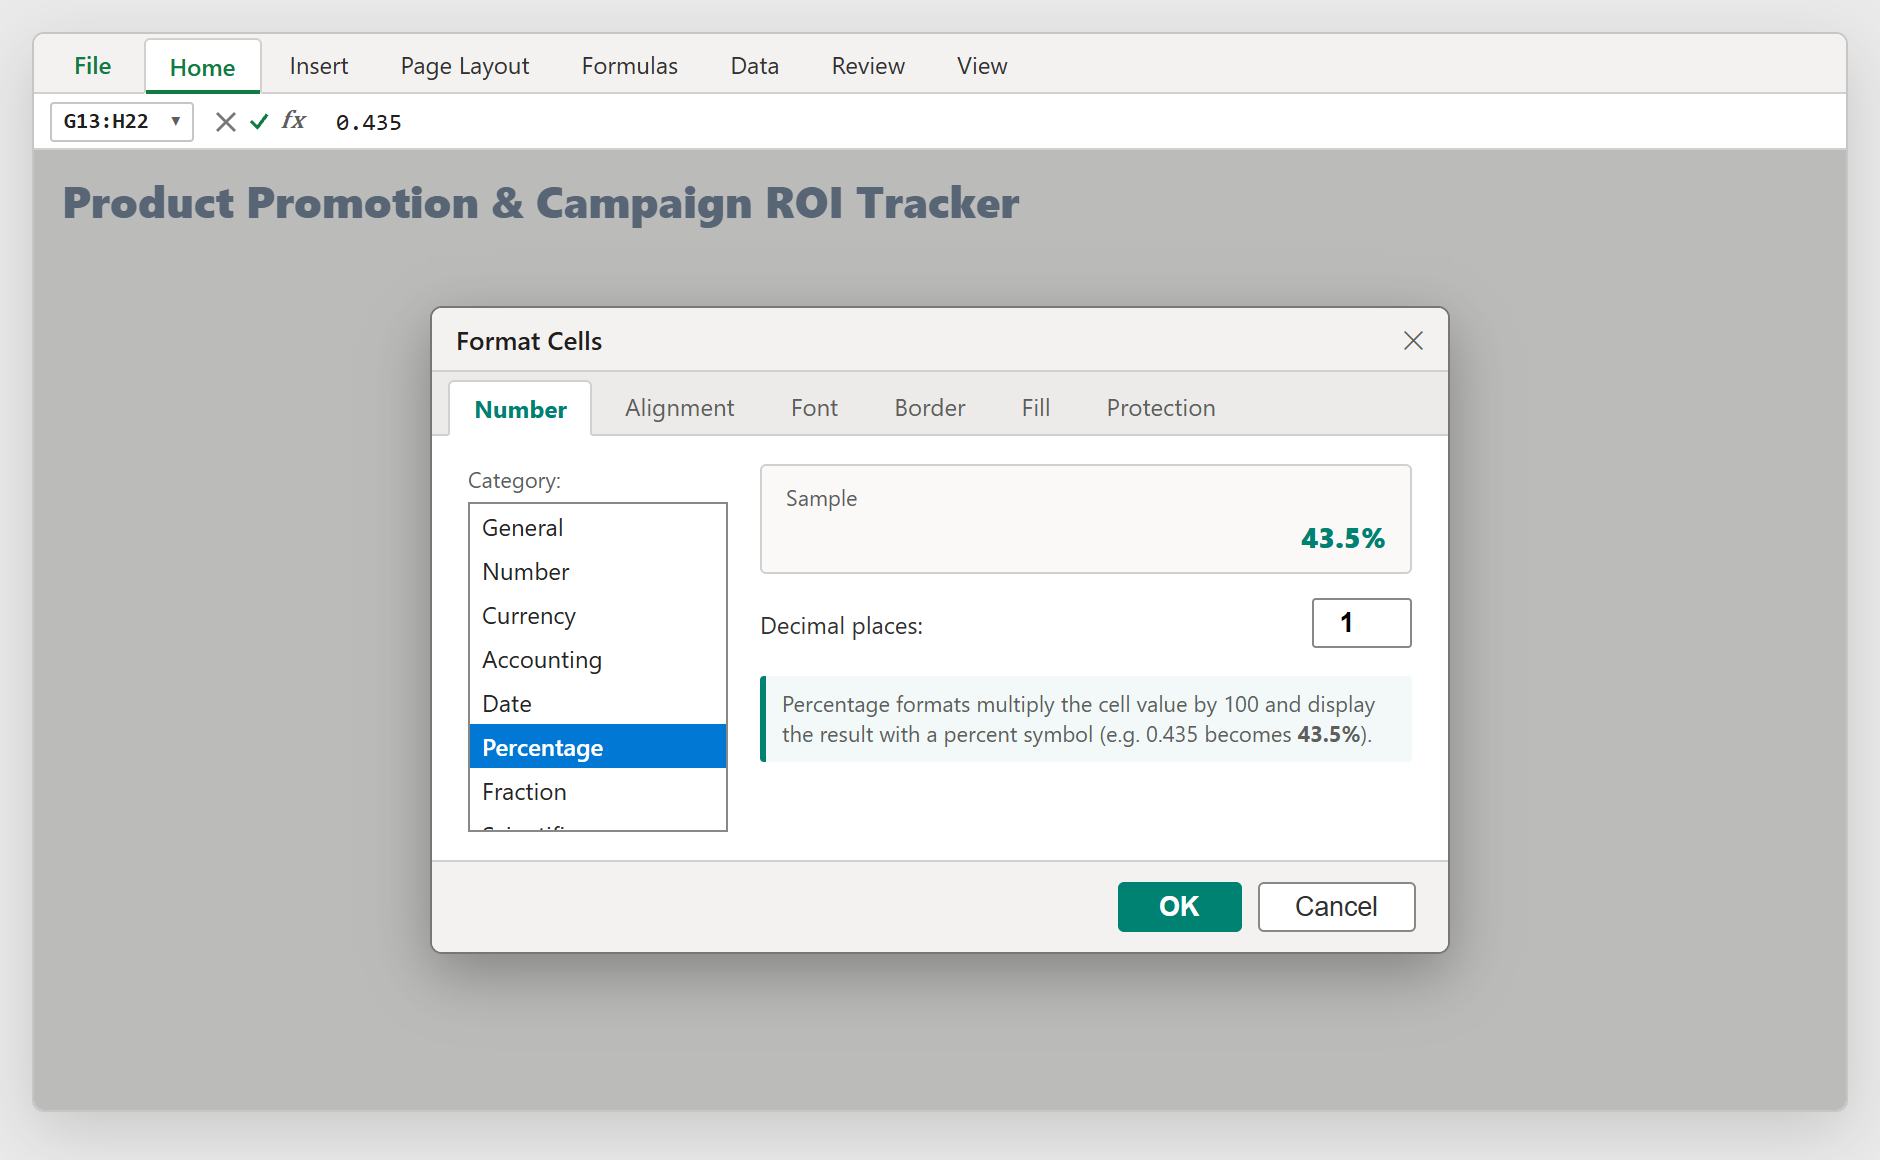
Figure 1: Configuring single-decimal Percentage formatting via the Format Cells dialog (Ctrl + 1).
3.2Step 2: Automating BCG Matrix Classification with IF & AND
Rather than manually guessing whether a channel is a winner or a loser, we use a structured nested formula that evaluates two benchmarks: Sales Growth Rate (10% benchmark) and Market Share (20% benchmark).
In cell L13 (Portfolio Classification), enter the four-way decision formula:
=IF(AND(J13="High", K13="High"), "Star Product", IF(AND(J13="Low", K13="Low"), "Dog Product", IF(AND(J13="High", K13="Low"), "Question Mark Product", "Cash Cow Product")))
For Google Search (43.5% growth, 9.7% share), Excel evaluates High growth but Low share, instantly labeling it a "Question Mark Product".
In column M (Strategic Direction), link the recommendation: =IF(L13="Star Product", "Build / Scale", IF(L13="Cash Cow Product", "Hold / Optimize", IF(L13="Question Mark Product", "Harvest / Test", "Divest / Cut"))).
Copy both formulas down to row 22. Your entire portfolio is now categorized objectively without bias.
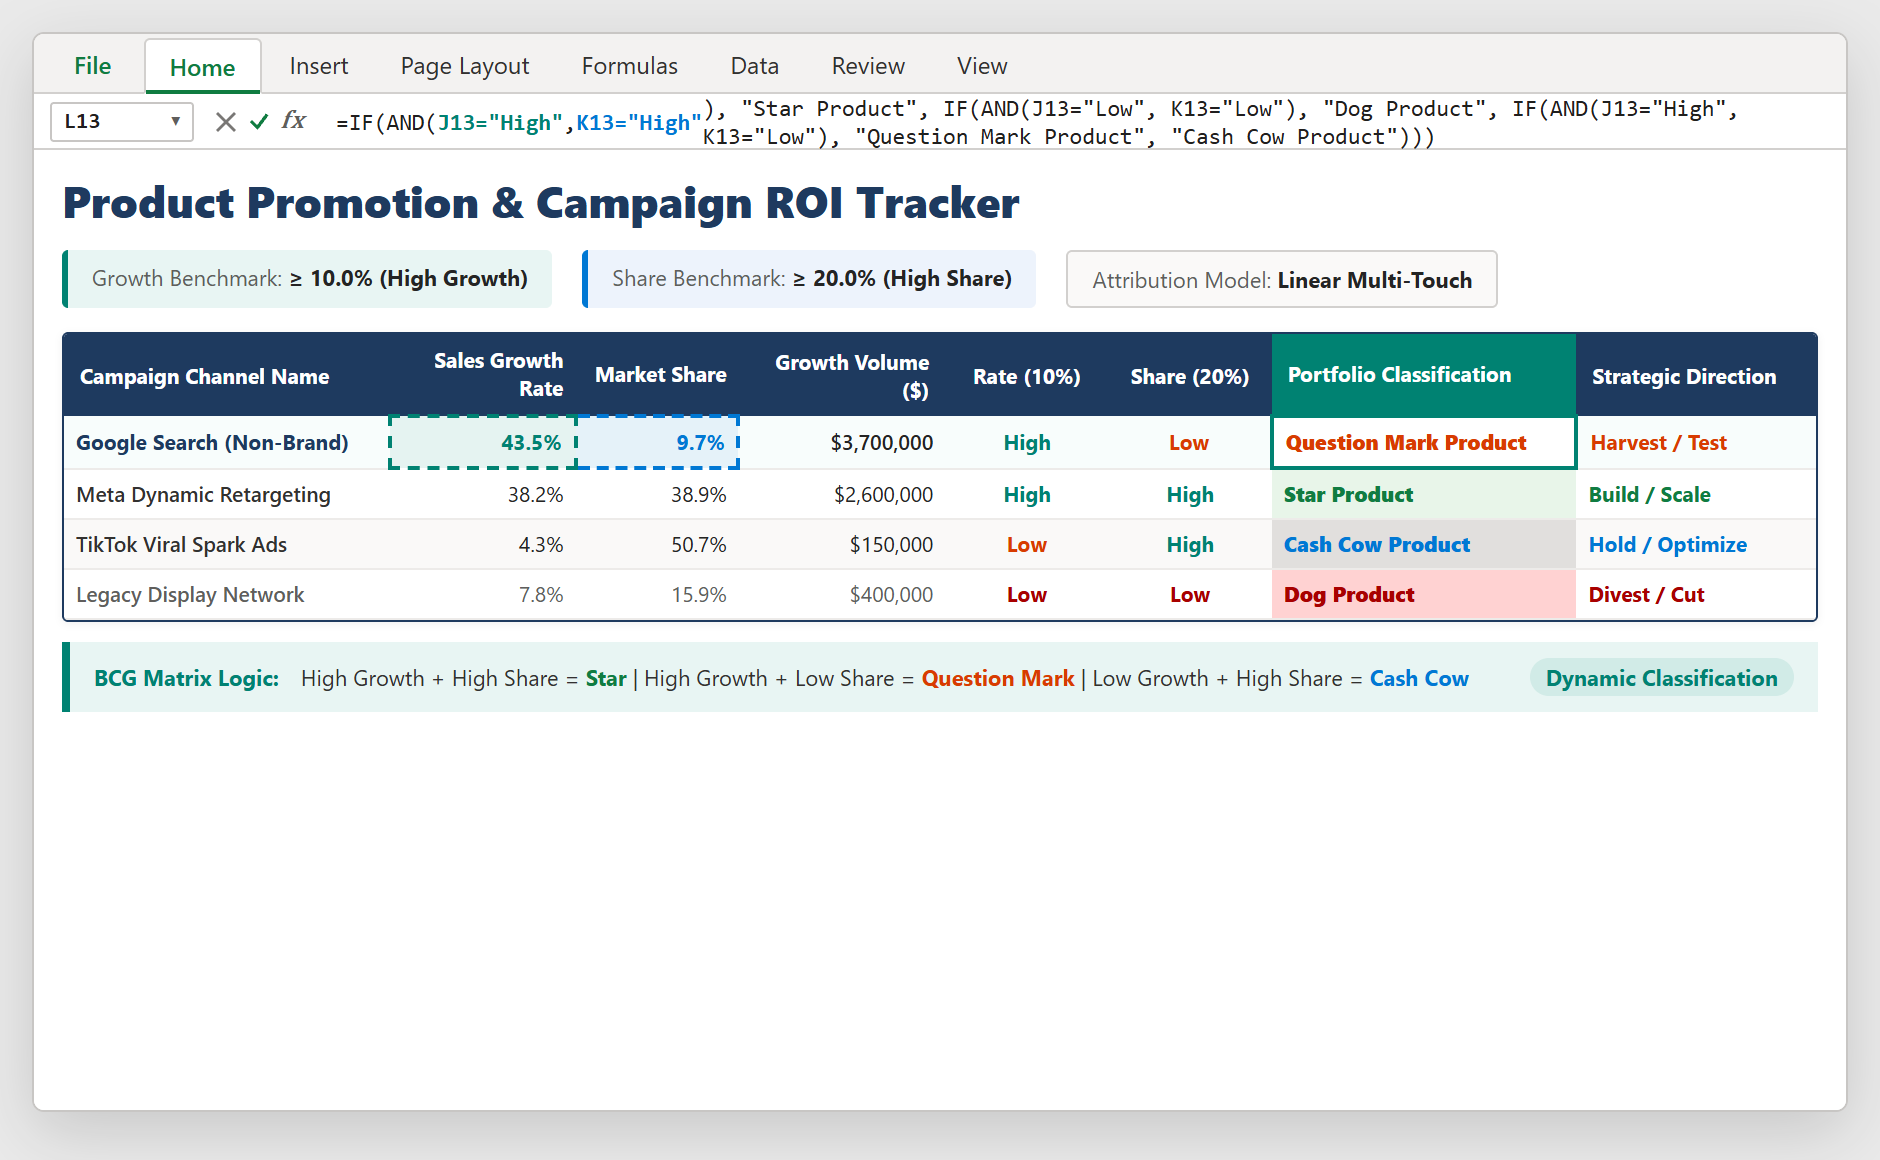
Figure 2: Formulating the four-quadrant portfolio classification logic using nested =IF() and =AND().
3.3Step 3: Constructing the Executive Marketing Command Center
To make the data easy for leadership to digest in a 10-minute briefing, we assemble an executive visual command center above the ledger.
On the left, a dark navy KPI card displays total active campaigns (10 channels), showing that 6 channels are ready to scale, 1 is in maintenance, 2 are in test mode, and 1 should be cut.
In the center, a Plan Mix donut chart shows the portfolio distribution: 60% of our channels are high-growth Star Products, while 20% represent experimental test bets.
On the right, a scatter plot matrix graphs Market Share against Sales Growth Rate, with dotted reference lines at 10% and 20% dividing the four quadrants cleanly.
This visual hierarchy allows executive leadership to confirm marketing strategy in seconds.
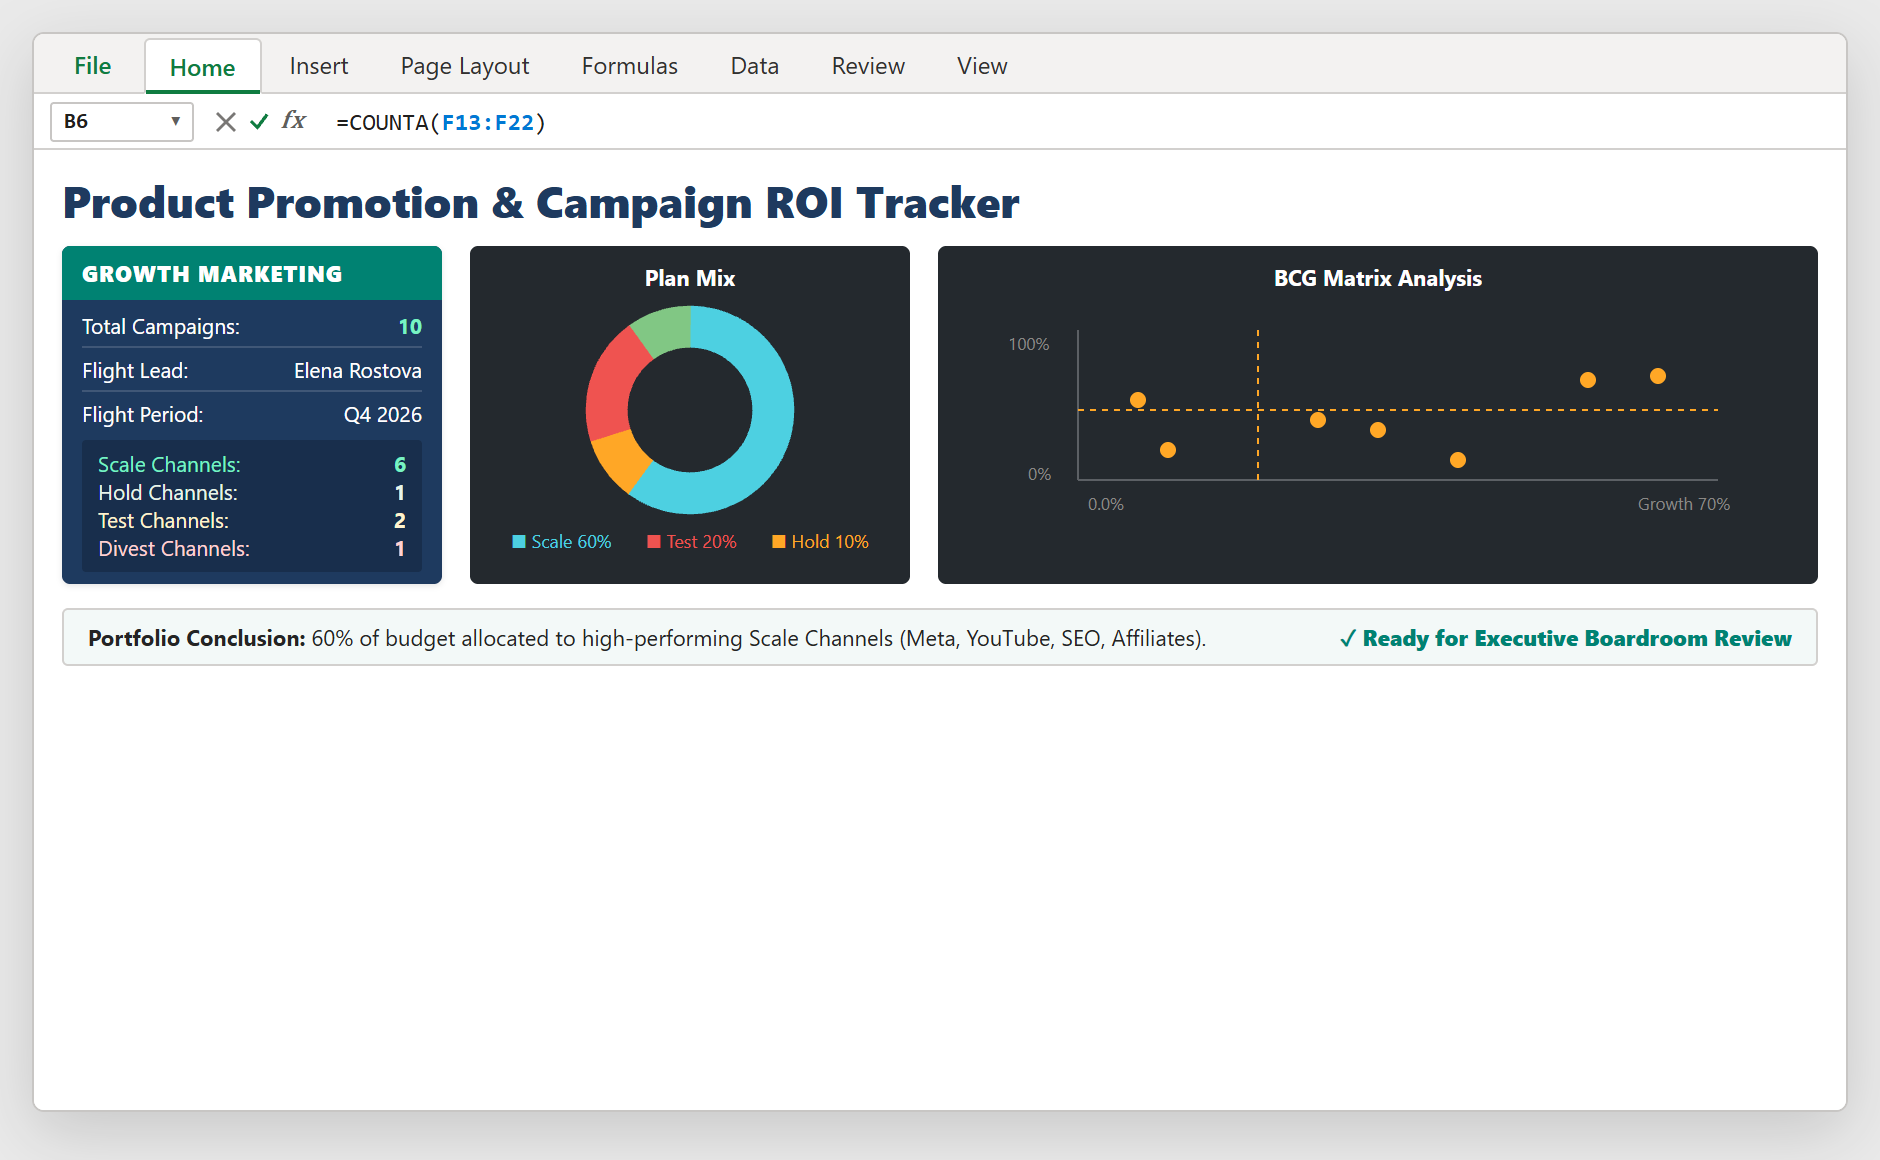
Figure 3: Complete executive marketing command center combining channel counts, donut mix, and BCG scatter matrix.
Growth Marketing Rules: Reallocating Budget Across Channels
When reviewing quarterly campaign performance, follow these practical budget allocation rules:
1. Double Down on Stars: Channels in the Star quadrant (like Meta Dynamic Retargeting and YouTube TOFU) have proven high market share and strong growth. Increase their ad spend by 15-25% until marginal CPA begins to rise.
2. Harvest Cash Cows to Fund Experiments: Use the steady profits from mature Cash Cow channels (like TikTok Viral Spark) to bankroll test budgets for Question Mark initiatives (like Google Search Non-Brand).
3. Ruthlessly Cut Dogs: If a channel stays in the Dog Product quadrant for two consecutive quarters with low growth and low share (like Legacy Display Network), cut its spend and reallocate funds to your top two Star channels.

Spreadsheet educator and web developer passionate about hands-on interactive spreadsheet practice.
Related Practical Exercises
Explore more hands-on spreadsheet models with downloadable practice workbooks.
 Productivity
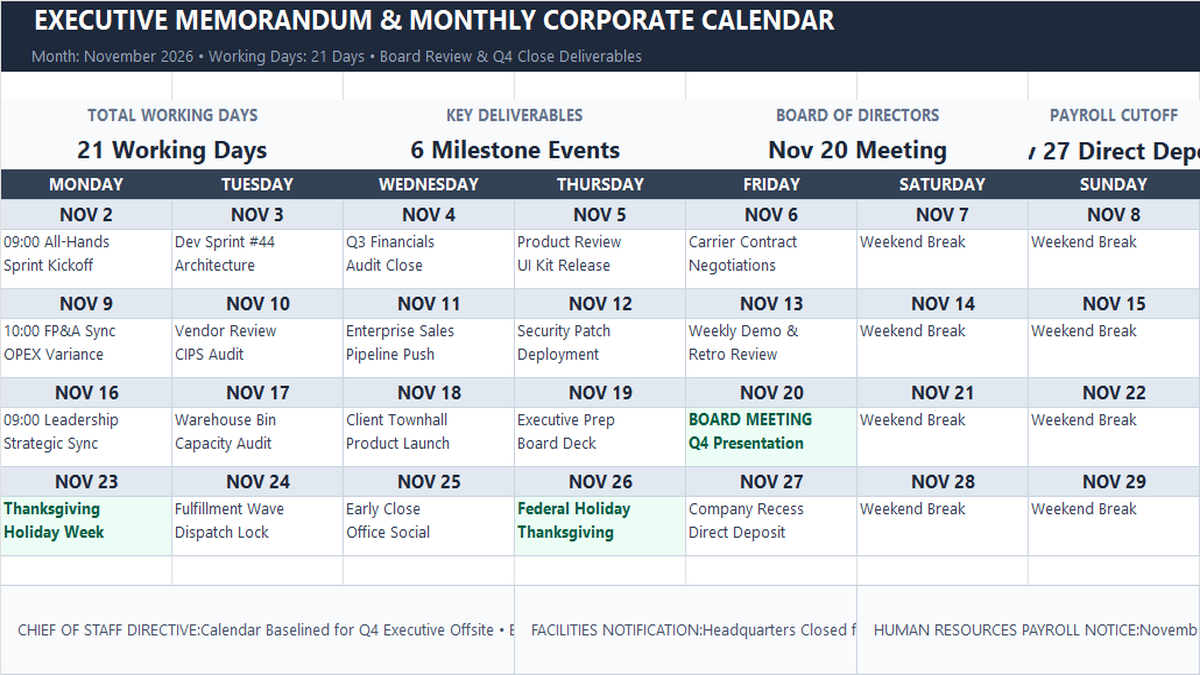
Monthly Memo Calendar Excel Template
Learn how to construct a monthly executive memo calendar in Microsoft Excel featuring single-sheet architecture, working days rollups with NETWORKDAYS, milestone event highlights, and department directive memos.
 Productivity
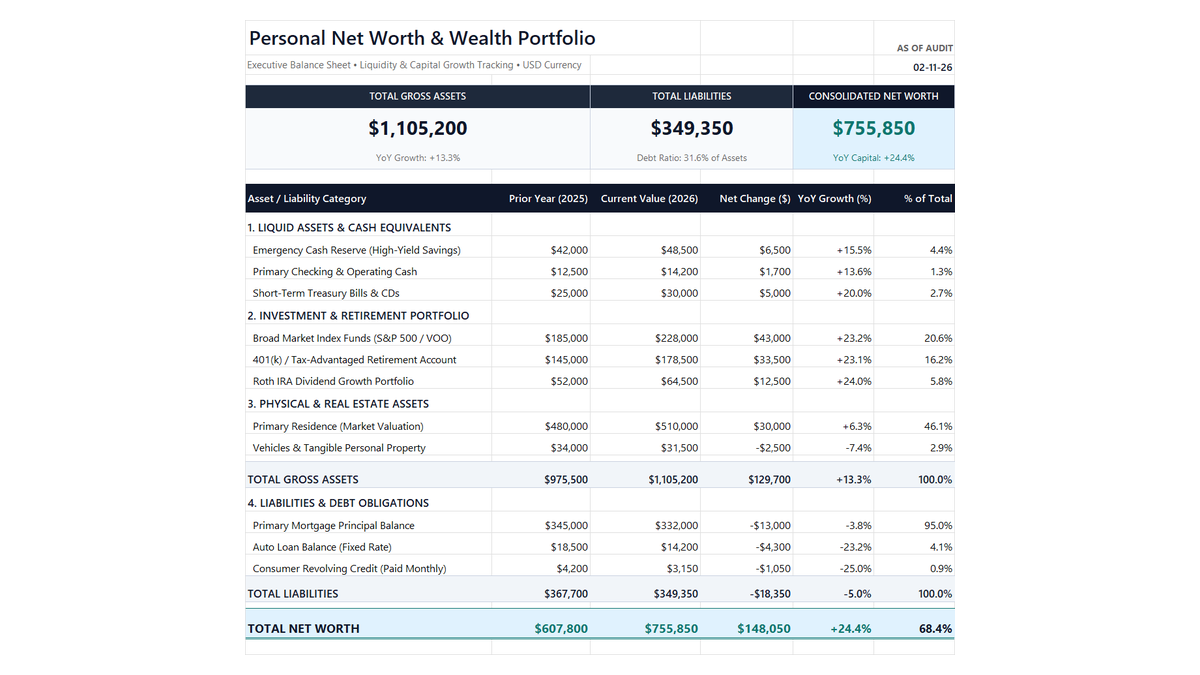
Personal Net Worth Tracker Excel Template
Build a clean personal net worth tracker in Microsoft Excel to monitor liquid savings, retirement accounts, real estate equity, and debt paydown with automated balance sheet math.
 Finance
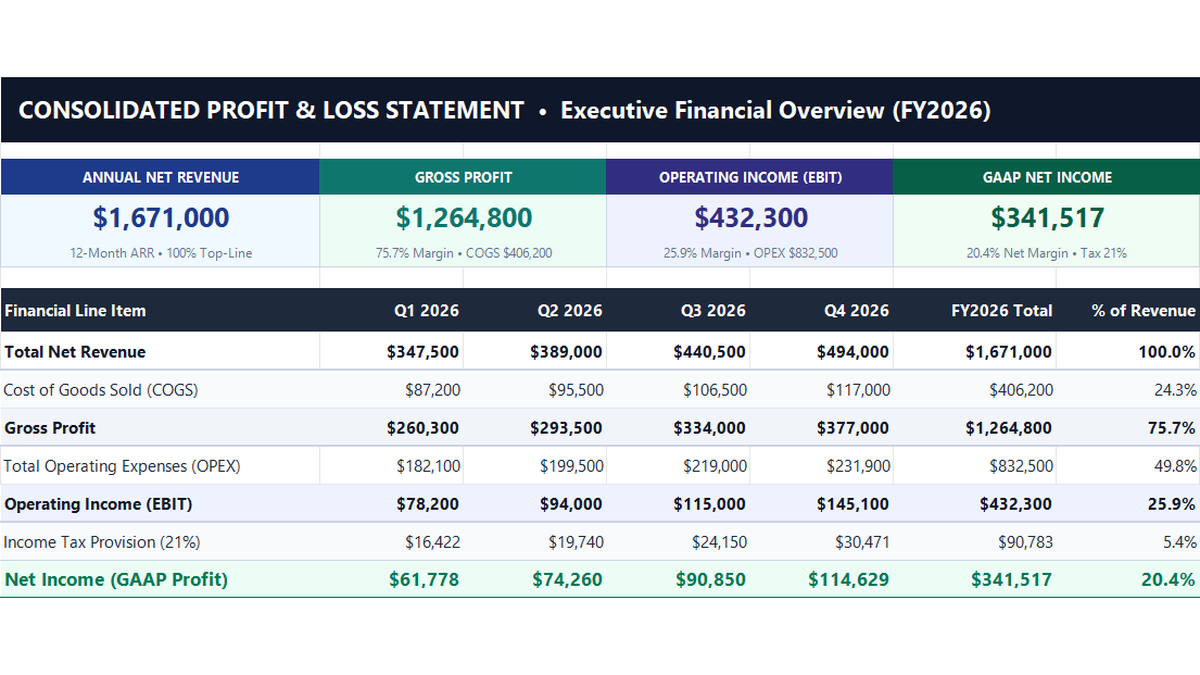
Profit and Loss Statement Excel Template
Build a standard 12-month corporate profit and loss statement in Microsoft Excel to track revenue lines, cost of goods sold, operating expenses, and net profit margins.
 Project Management
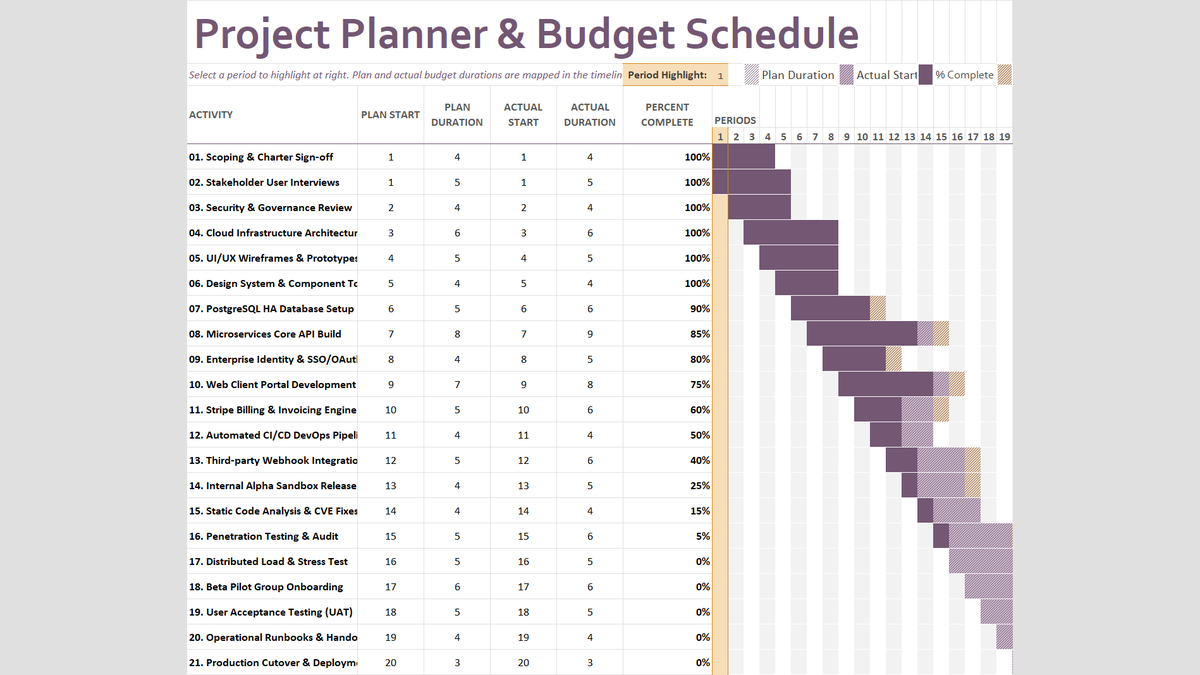
Project Budget Estimator Excel Template
Build a practical project planner and budget schedule in Microsoft Excel to track planned versus actual durations, percent complete milestones, and dynamic timeline periods.
 Project Management
Project Earned Value Performance Report Excel Template
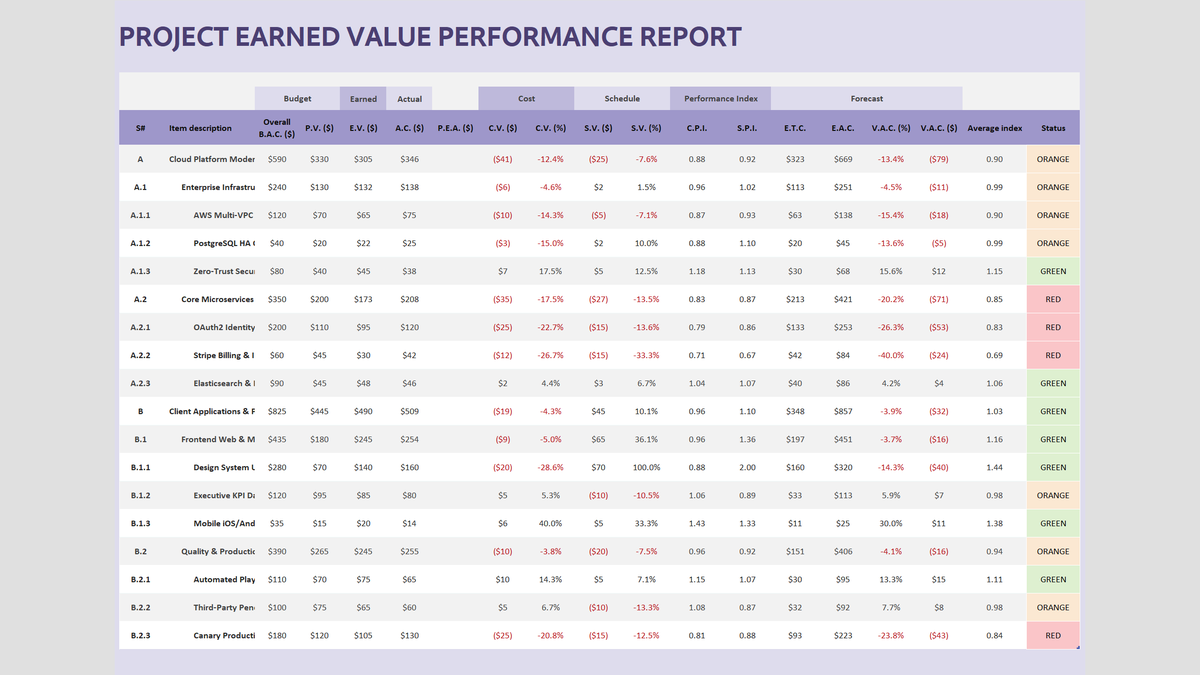
Track capital project budgets and delivery deadlines using Earned Value Management (EVM) in Microsoft Excel. Calculate Cost Variance (CV), Schedule Variance (SV), Cost Performance Index (CPI), and Estimate at Completion (EAC) with automated red-amber-green status badges.
Discussion
Ask questions, share formula tips, or discuss alternative approaches with fellow spreadsheet builders.
Loading discussion...