Commercial Debt Architecture & Underwriting Fundamentals
When corporate treasurers and investment bankers structure senior term debt, the primary operational tool is the loan amortization schedule. Unlike revolving lines of credit or interest-only bullet loans, a fixed-rate amortizing facility guarantees predictable cash outflows through equal periodic payments. Each payment is a composite cash flow consisting of accrued interest on the outstanding beginning balance and an amortizing principal repayment that permanently burns down the principal.
In corporate credit agreements, precision to the exact cent is non-negotiable. Lenders evaluate the borrower's Debt Service Coverage Ratio (DSCR = Net Operating Income / Total Debt Service), while corporate controllers must track principal retirements to properly separate balance sheet liabilities from interest expense on the income statement. An error in period compounding or sign convention can distort cash forecasts across decades.
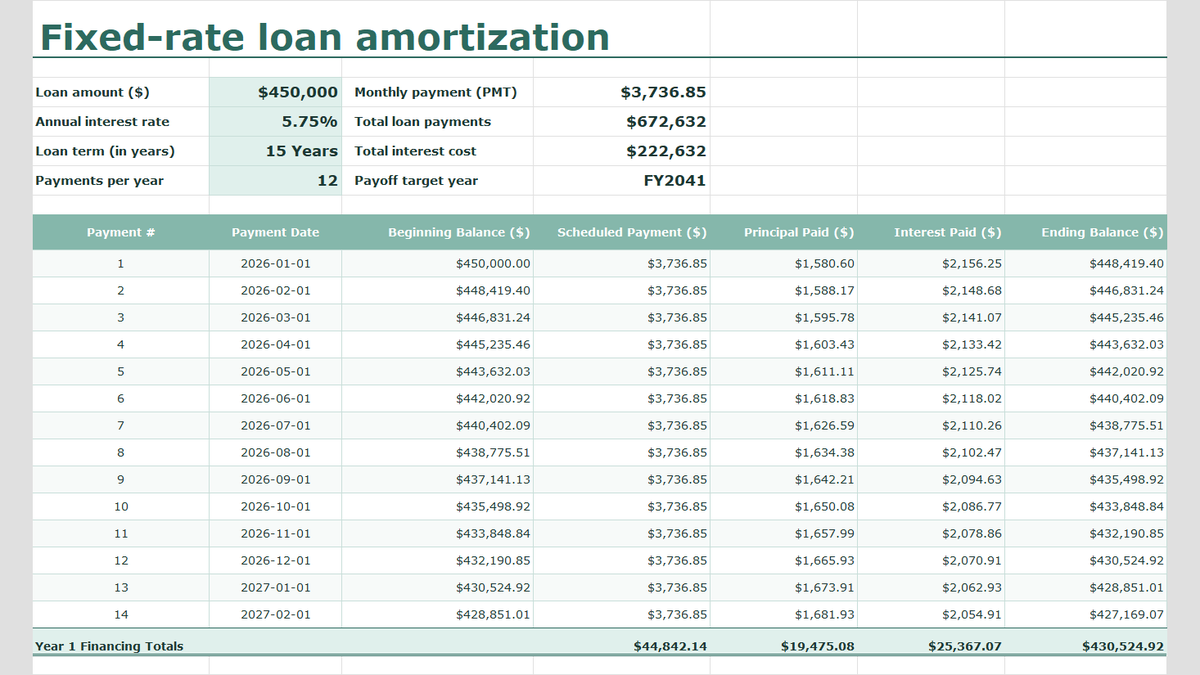
This tutorial reconstructs a corporate facility modeled in Excel: a $450,000 senior commercial loan amortized over 15 years at a fixed 5.75% annual percentage rate with monthly compounding. By engineering the schedule from the ground up, you will build an auditable financial model that withstands rigorous internal and credit committee audits.
Facility Terms & Financial Ledger Data Dictionary
The underlying workbook divides the debt model into two discrete architectural layers: the Facility Parameter Block (cells C3:F6) containing underwriting terms and summary metrics, and the Periodic Amortization Ledger (columns B through H) housing the period-by-period rollforward. The schema below specifies the data typing, cell references, and mathematical formulas utilized.
| Cell Range | Parameter / Metric Name | Data Type | Number Format | Description & Modeling Rule |
|---|---|---|---|---|
| C3 | Loan Amount (Principal PV) | Numeric Currency | Accounting ($#,##0) | Original principal commitment of the loan facility ($450,000.00). |
| C4 | Annual Interest Rate | Numeric Percentage | 0.00% | Contractual nominal annual coupon (5.75%). Must be divided by compounding frequency in periodic calculations. |
| C5 | Loan Term (Tenor) | Numeric Integer | General ("15 Years") | Overall facility duration in years (15 years = 180 monthly periods). |
| C6 | Payments Per Year | Numeric Integer | General | Annual payment frequency (12 for monthly payments). |
| E3 | Monthly Payment (Debt Service) | Formula Output | Accounting ($#,##0.00) | =PMT(C4/C6, C5*C6, -C3). Fixed monthly annuity payment ($3,736.85). |
| E4 | Total Payments | Formula Output | Accounting ($#,##0) | =E3*(C5*C6). Aggregate nominal cash outflow across the facility tenor ($672,632). |
| E5 | Total Interest | Formula Output | Accounting ($#,##0) | =E4-C3. Cumulative financing charge incurred by the borrower ($222,632). |
| B9:B22 | Payment Index (Pmt #) | Integer Sequence | Center Align | Sequential period counter running from 1 through the maturity period (180). |
| C9:C22 | Payment Date | Calendar Date | DD/MM/YYYY | Payment due date. Increments monthly via regular corporate settlement schedule. |
| D9:D22 | Beginning Balance | Formula Reference | Accounting ($#,##0.00) | Period opening liability. Period 1 links to =C3; period 2+ links to previous ending balance =H9. |
| E9:E22 | Scheduled Payment | Absolute Reference | Accounting ($#,##0.00) | Fixed monthly debt service linking to =$E$3 ($3,736.85). |
| F9:F22 | Principal Paid | Formula Calculation | Accounting ($#,##0.00) | =E9-G9. The portion of debt service that directly repays the debt liability. |
| G9:G22 | Interest Paid | Formula Calculation | Accounting ($#,##0.00) | =D9*(C$4/C$6). Period interest expense recognized on the opening principal balance. |
| H9:H22 | Ending Balance | Formula Calculation | Accounting ($#,##0.00) | =D9-F9. Closing outstanding loan principal at the end of the period. |
Step-by-Step Amortization Ledger Build
Building an institutional amortization schedule requires five logical operations: computing the level debt service annuity, establishing banking-grade cell formats, calculating the period interest-principal bifurcation, binding the rollforward engine, and aggregating period results into executive summary totals.
3.1Step 1: Calculating Level Debt Service with =PMT()
Excel provides the built-in financial function =PMT(rate, nper, pv, [fv], [type]) to determine the constant periodic annuity payment required to fully extinguish a loan balance. In corporate debt modeling, three critical rules govern its implementation:
First, the rate argument must represent the periodic interest rate, computed by dividing the annual coupon by annual payments: C4/C6 (5.75% / 12 = 0.479167% per month). Second, the nper argument represents total payment periods across the life of the loan: C5*C6 (15 years * 12 = 180 months). Third, the present value pv must be entered as a negative value -C3 (or the formula prefixed with a minus sign) so that the resulting debt service displays as a positive cash disbursement rather than a negative cash flow.
Select cell E3 and input the formula: =PMT(C4/C6, C5*C6, -C3). This yields an exact monthly debt service requirement of $3,736.85.
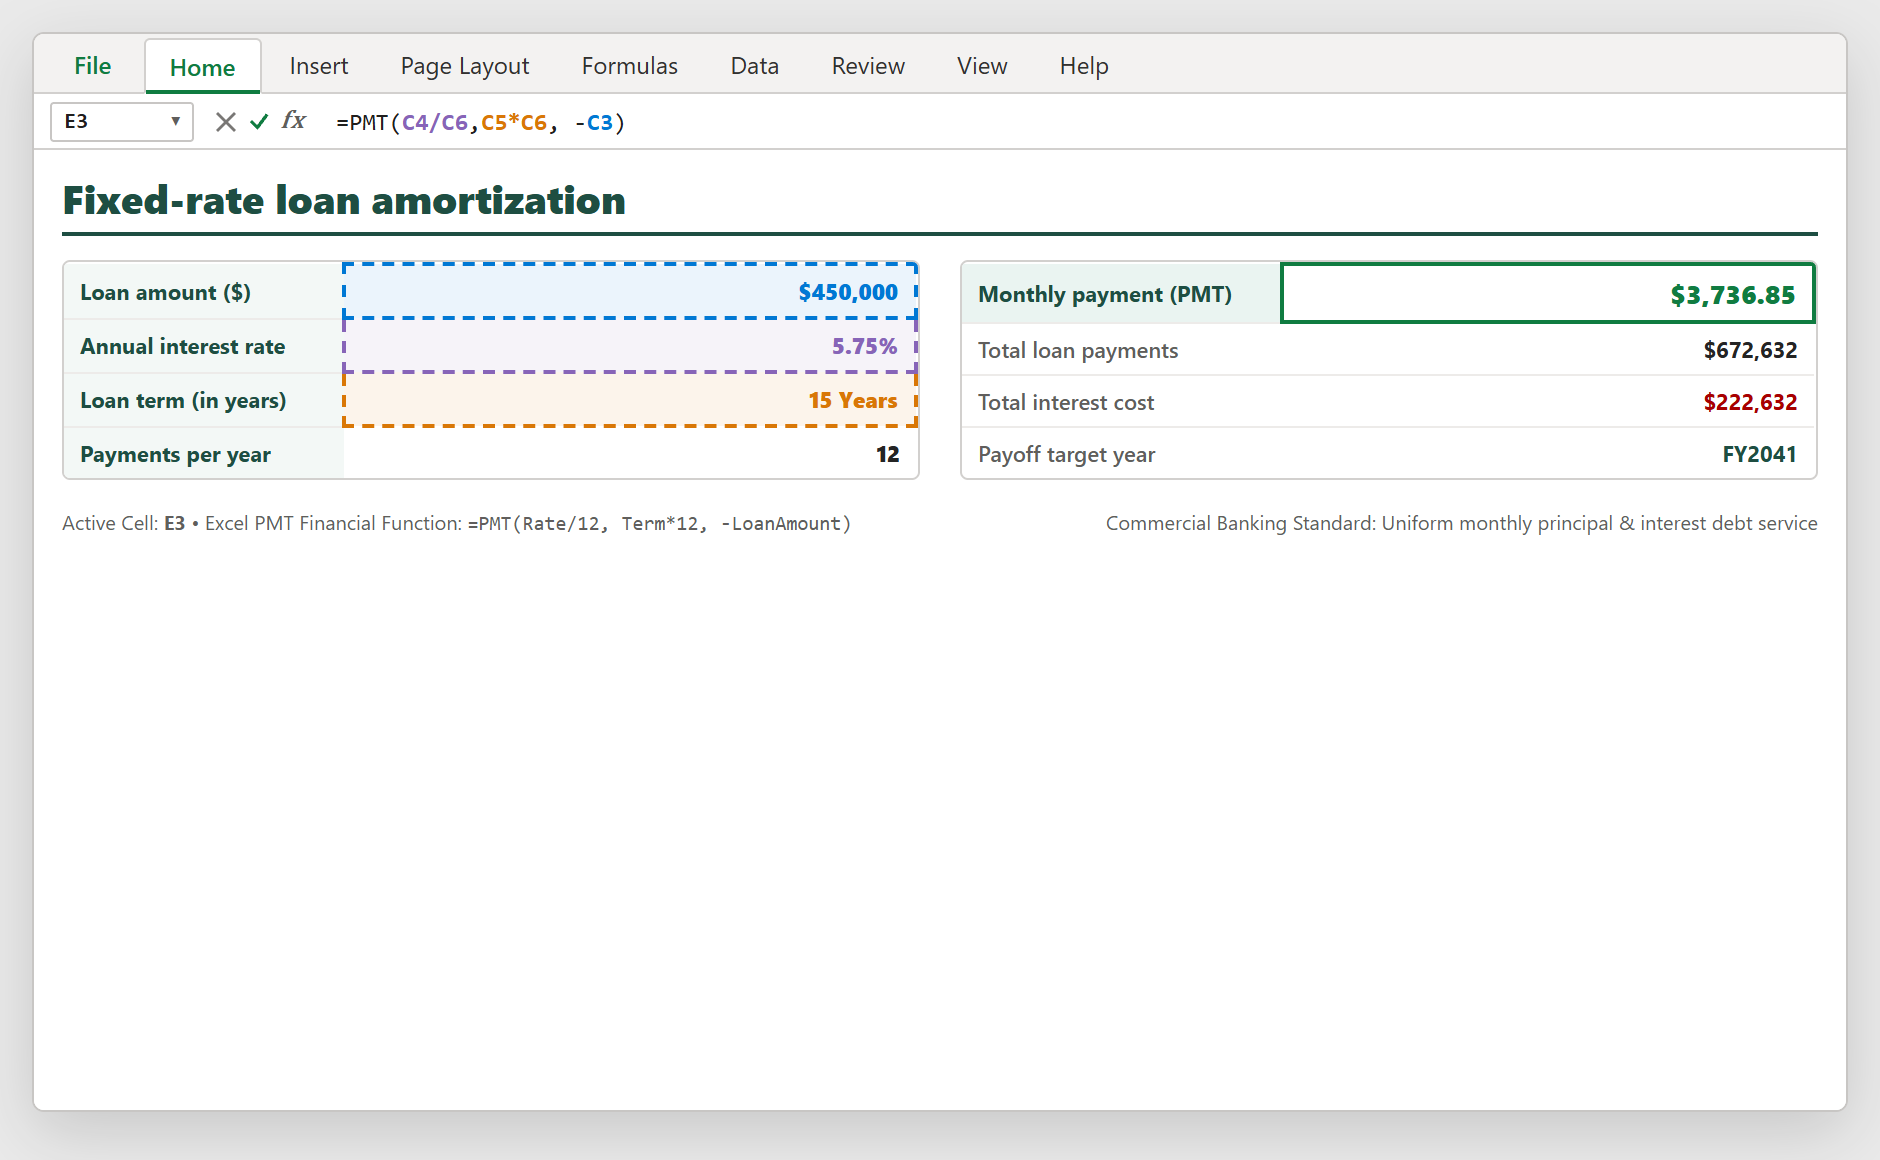
Figure 1: Executing the =PMT() annuity calculation in cell E3 with color-coded cell references for annual rate, tenor, and principal commitment.
3.2Step 2: Configuring Accounting Number Formatting
In financial ledgers, raw unformatted numbers look unpolished and obscure decimal variance. Corporate lending standards require the Accounting number format, which anchors currency symbols ($) flush against the left cell border, aligns decimal points vertically down the entire column, and displays zero balances cleanly as hyphens (-).
Highlight the entire schedule range D9:H22 along with summary cells C3 and E3:E5. Press Ctrl + 1 to open the Format Cells dialog box.
Under the Category menu on the left, select Accounting. Confirm that Decimal places is set to 2 and the Symbol dropdown is configured to $ ($). Click OK to apply. Notice how this immediately formats all monetary values into clean, institutional figures like $ 450,000.00 and $ 3,736.85.
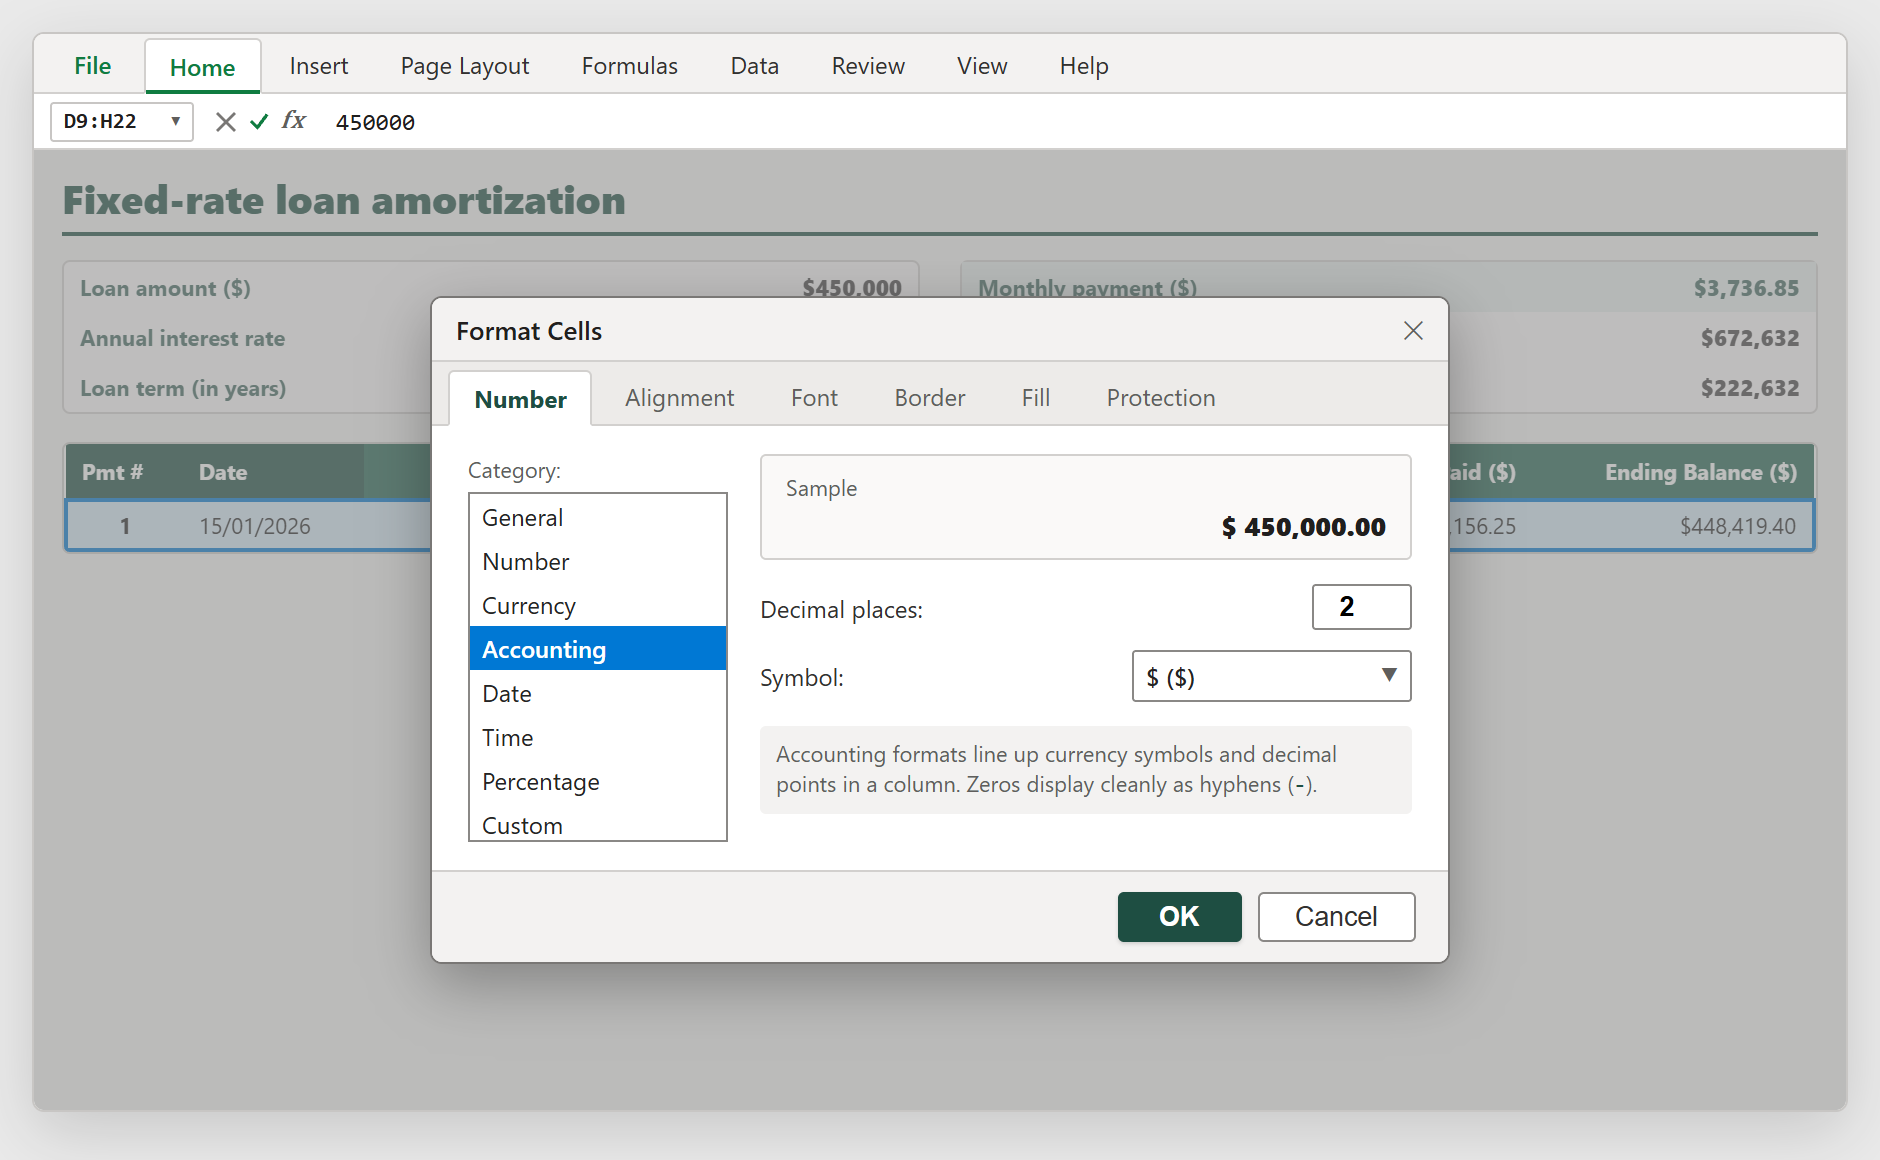
Figure 2: Configuring the official Accounting format via the Format Cells dialog (Ctrl + 1) to align currency columns and ensure zero-hyphen audit compliance.
3.3Step 3: Calculating Period Interest & Principal Paydown
Each fixed payment of $3,736.85 must be partitioned into its two constituent accounting components: interest expense (tax-deductible operational cost) and principal reduction (balance sheet liability repayment).
In Month 1 (Row 9), opening principal in D9 is $450,000.00. The accrued interest for the month is calculated by multiplying the opening balance by the monthly interest rate: =D9*(C$4/C$6). Notice the mixed cell references C$4 and C$6 with dollar signs locking the row number. This ensures that when the formula is copied down across 180 rows, the rate and payment frequency remain anchored to the header parameter block.
In cell G9, enter: =D9*(C$4/C$6) ($2,156.25). Once period interest is determined, the remaining portion of the fixed scheduled payment directly pays down loan principal in cell F9: =E9-G9 ($1,580.60). As principal decreases each month, subsequent interest charges shrink, shifting a progressively higher percentage of each fixed payment toward principal retirement.
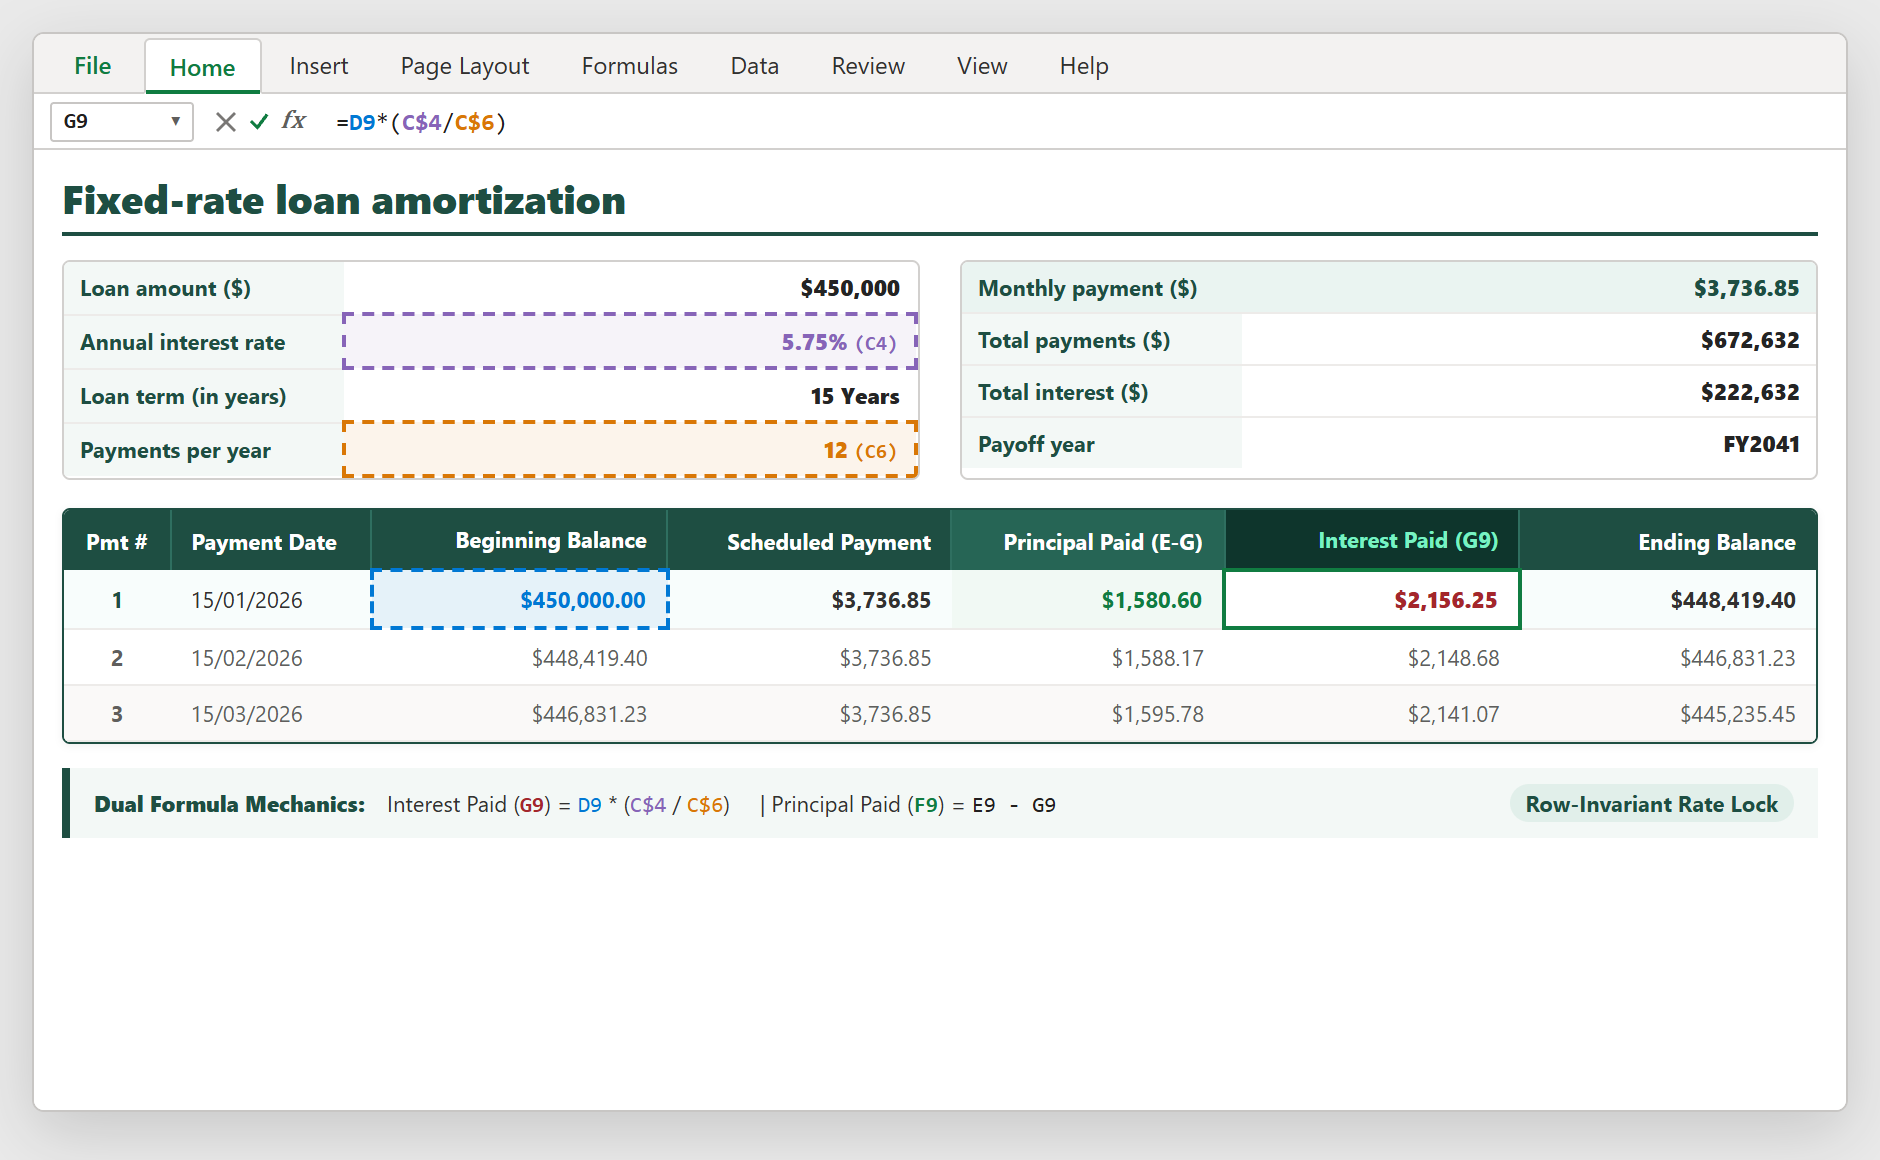
Figure 3: Formulating the interest-principal split in Period 1 using row-locked cell references (C$4 and C$6) for rate stability.
3.4Step 4: Engineering Unbroken Balance Rollforward Links
The core engine of any financial debt schedule is the balance rollforward: Ending Balance = Beginning Balance - Principal Paid.
In Month 1, cell H9 calculates: =D9-F9 ($450,000.00 - $1,580.60 = $448,419.40). For Month 2 (Row 10), the beginning balance must inherit the previous period closing balance. Never hardcode or re-enter balances manually. In cell D10, enter the dynamic reference: =H9.
This single relative reference establishes an unbroken mathematical chain. Once set, you can copy cells D10:H10 down through all 180 periods. Any unscheduled prepayments or interest rate adjustments automatically ripple across all remaining periods without manual intervention.
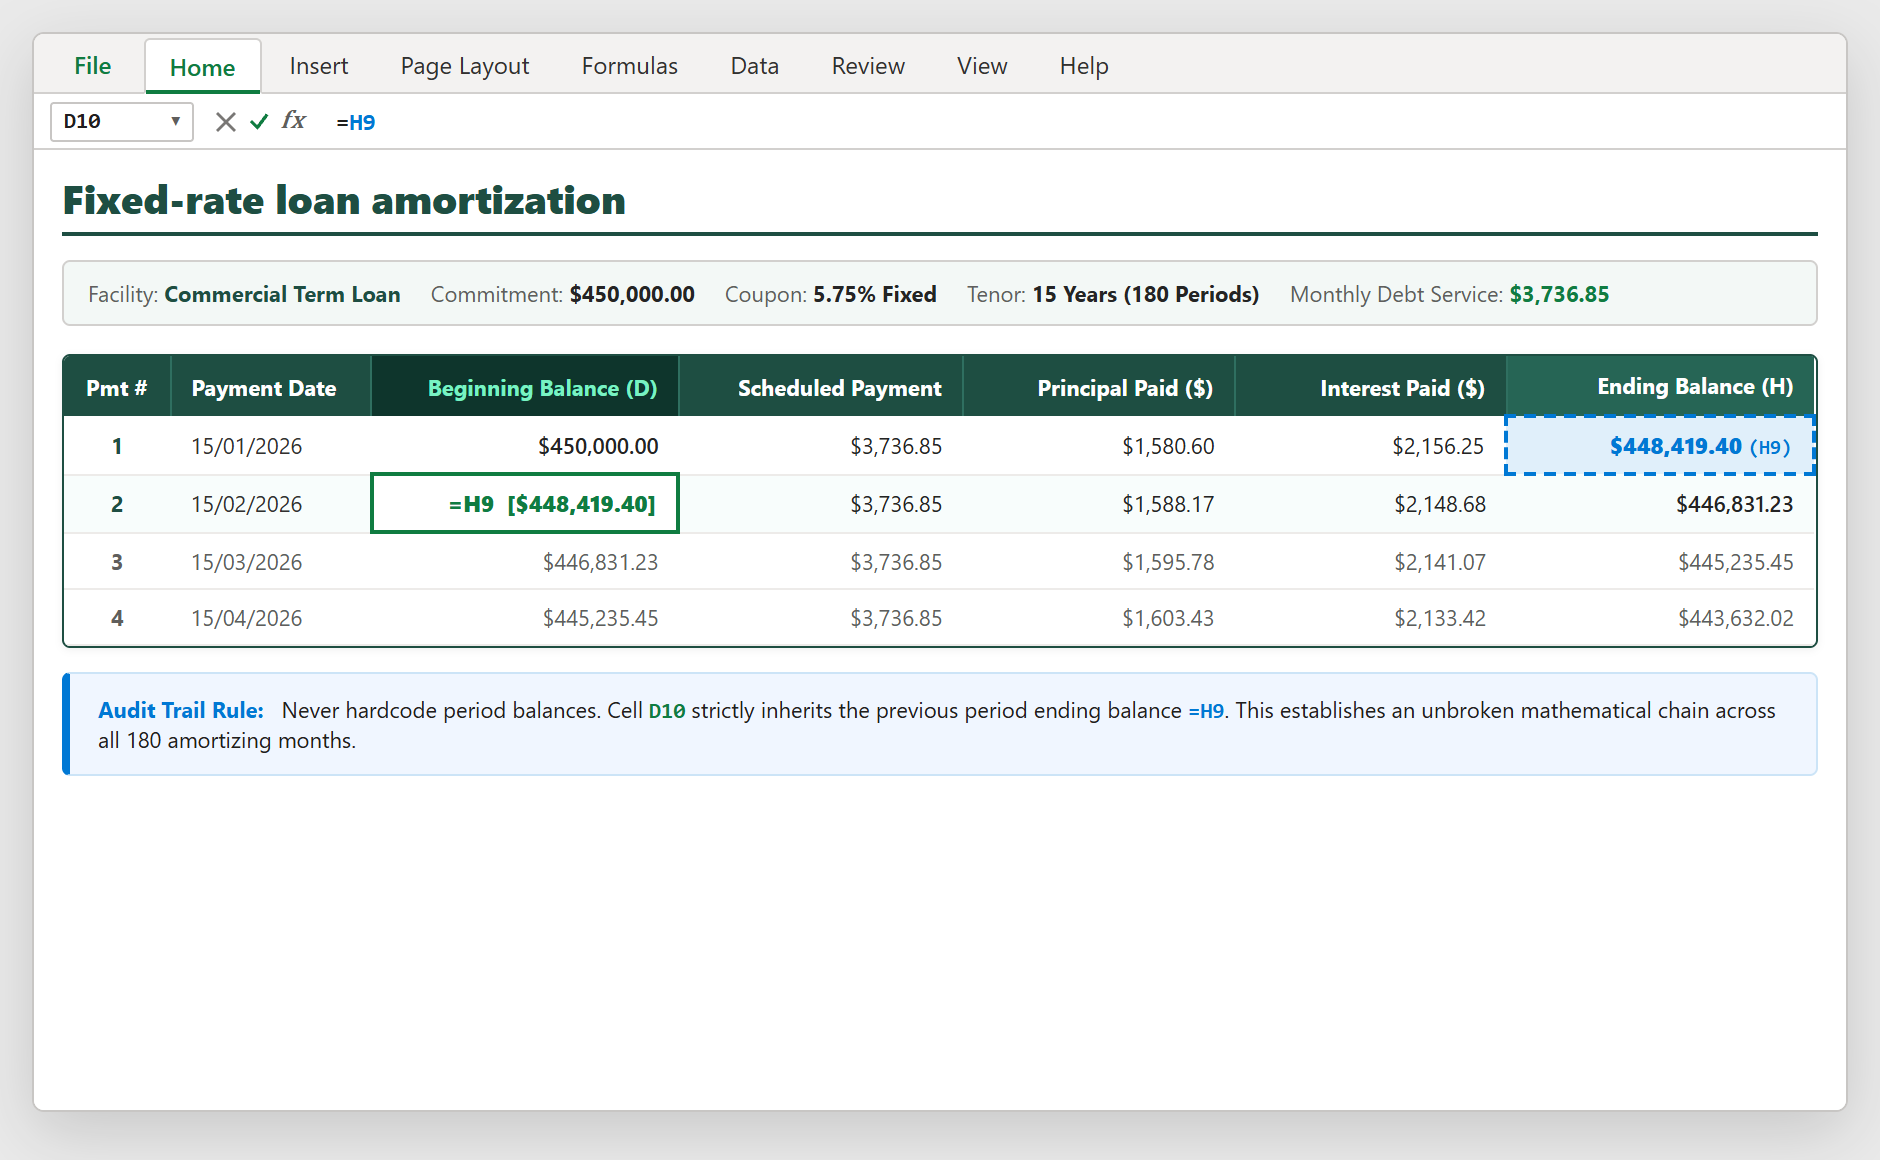
Figure 4: Dynamic balance rollforward linkage in cell D10 (=H9) connecting consecutive monthly amortization periods.
3.5Step 5: Aggregating Annual Debt Service Rollups
Corporate lenders and CFOs evaluate debt service on an annual basis to verify compliance with financial covenants. In Row 23, construct the Year 1 Financing Totals rollup row beneath Period 12.
For Scheduled Payments (cell E23), sum the 12 monthly payments: =SUM(E9:E22) ($44,842.20). For Principal Paid (cell F23), sum total principal retired: =SUM(F9:F22) ($19,475.01). For Interest Paid (cell G23), sum total financing charges: =SUM(G9:G22) ($25,367.19). For Ending Balance (cell H23), reference the final period closing balance: =H22 ($430,524.99).
Notice the mathematical verification: Scheduled Payments ($44,842.20) exactly equals Principal ($19,475.01) plus Interest ($25,367.19). In Year 1, interest represents 56.57% of all payments made, illustrating the front-loaded nature of long-term commercial loans.
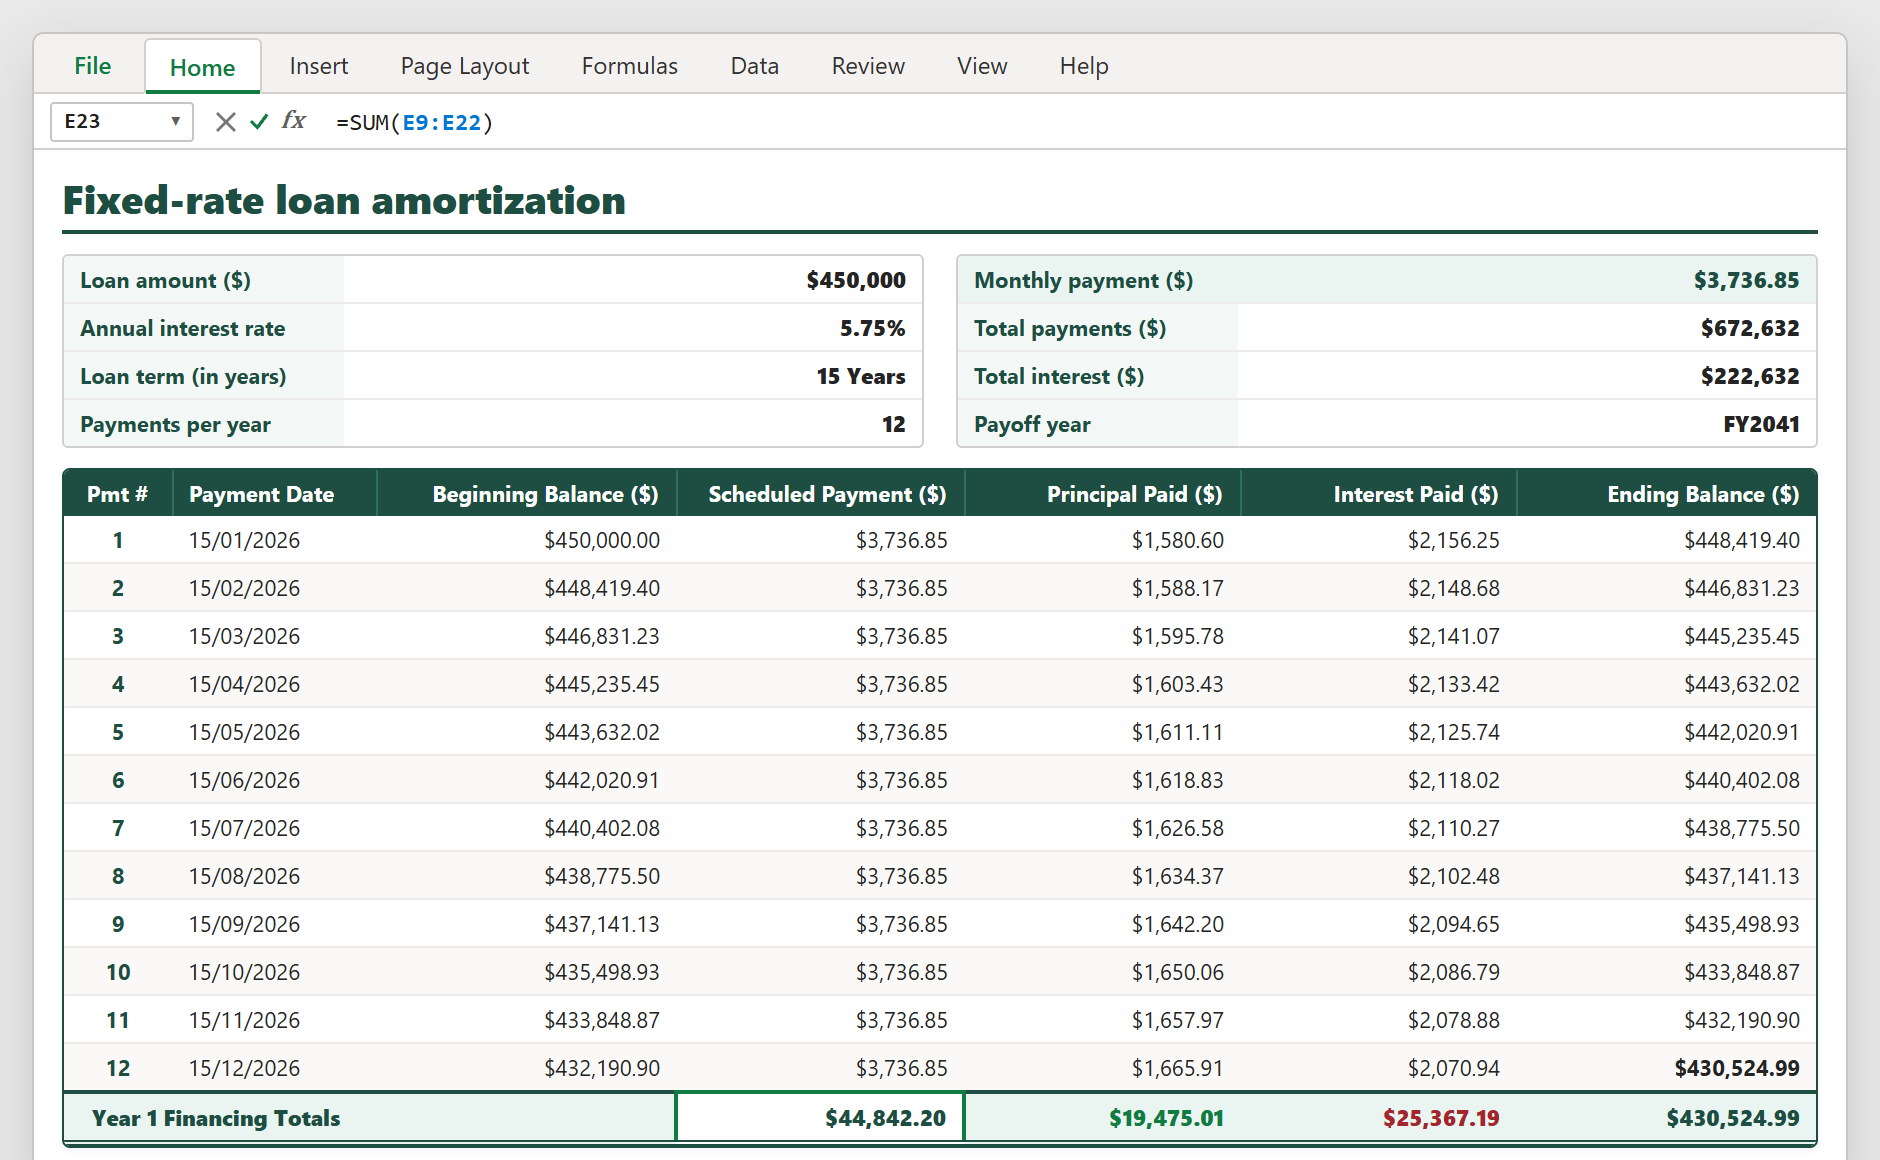
Figure 5: Complete Year 1 commercial loan amortization schedule showing monthly payment progression and year-end rollup totals.
Treasury Audit Checks, Covenants & Common Traps
Before submitting an amortization schedule to credit underwriters or auditors, verify the model against three standard institutional controls:
1. Zero Terminal Balance Check: At the maturity period (Month 180), the ending balance H188 must equal exactly $0.00. If it terminates at a non-zero value, you have either miscounted payment periods or omitted the compounding frequency division.
2. Dollar Lock Anchor Failures: A frequent error is omitting the row anchor in the interest calculation (writing =D9*(C4/C6) instead of =D9*(C$4/C$6)). When copied down, the rate reference shifts to empty cells, producing #VALUE! or zero-interest anomalies in subsequent months.
3. Debt Service Coverage Ratio (DSCR) Integration: Annual debt service from cell E23 ($44,842.20) directly populates the denominator of the borrower DSCR test. If the operating business generates $70,000 in Net Operating Income, the resulting DSCR is 1.56x ($70,000 / $44,842.20), providing adequate cushion above standard bank covenants of 1.25x.

Spreadsheet educator and web developer passionate about hands-on interactive spreadsheet practice.
Related Practical Exercises
Explore more hands-on spreadsheet models with downloadable practice workbooks.
 Productivity
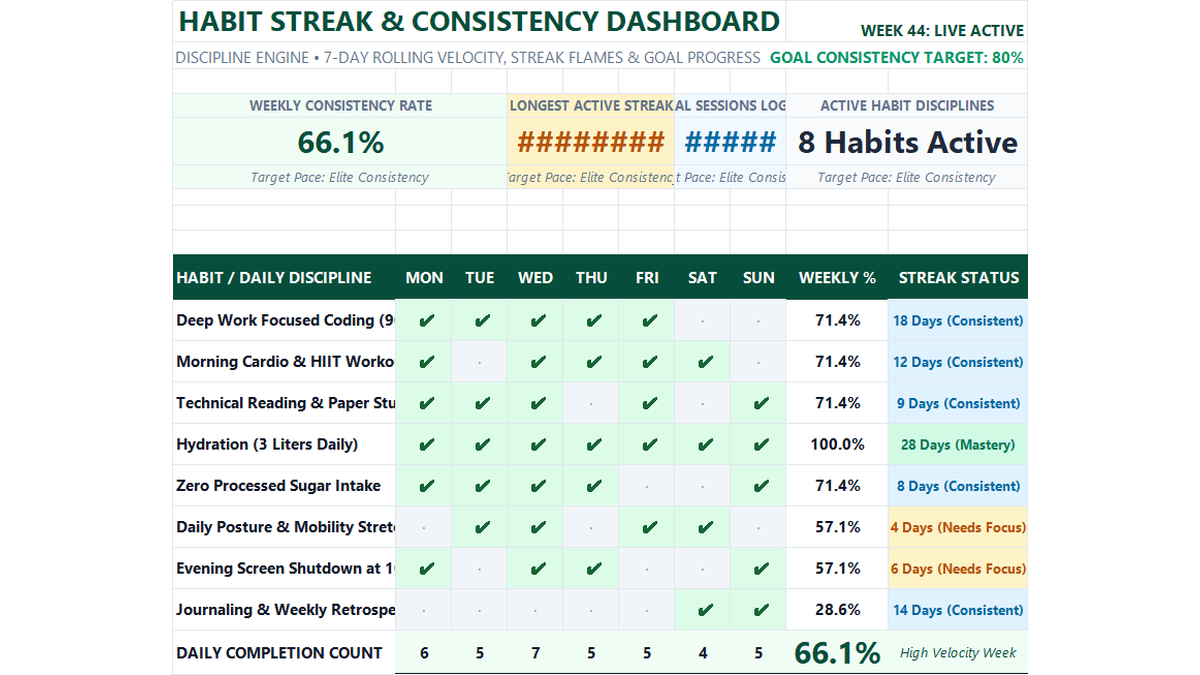
Daily Habit Tracker Excel Template
Build a practical daily habit tracker in Microsoft Excel to track 7-day consistency rates, checkmark styling, streak milestones, and overall productivity scorecards.
 Sales
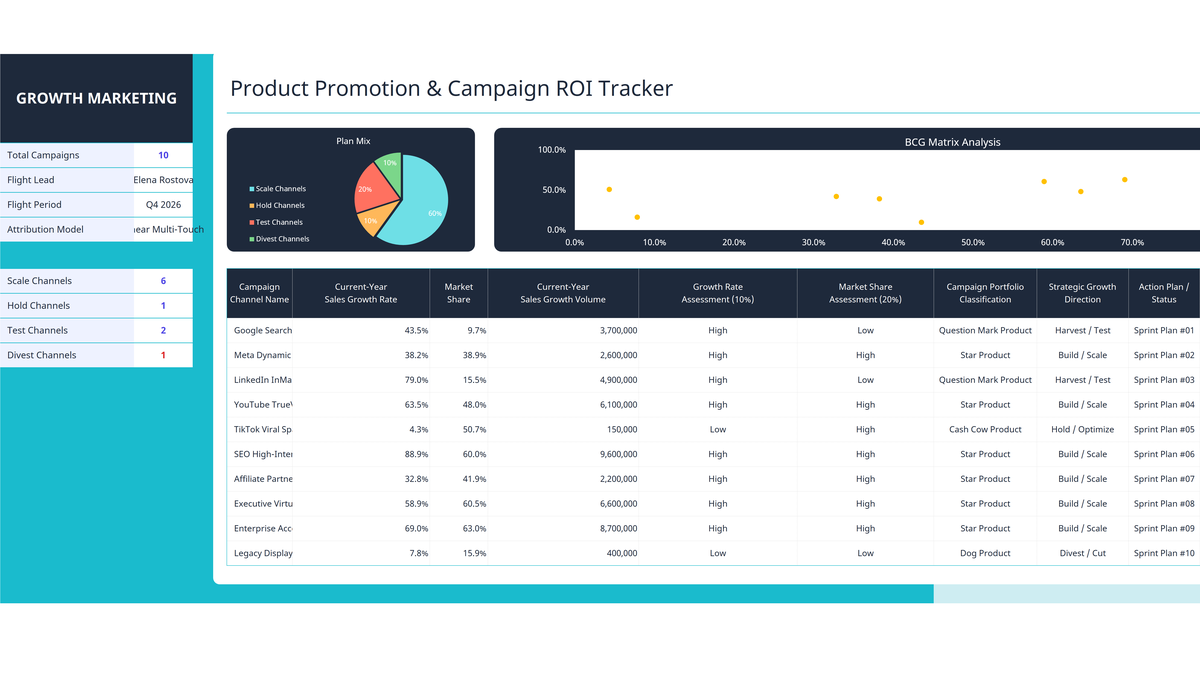
Marketing Campaign ROI Tracker Excel Template
Evaluate marketing channels, advertising returns, and campaign growth in Microsoft Excel. Build an executive campaign ROI tracker featuring growth rate percentage formatting, automated BCG matrix portfolio classification (Star, Cash Cow, Question Mark, Dog), and executive dashboard visualizations.
 Productivity
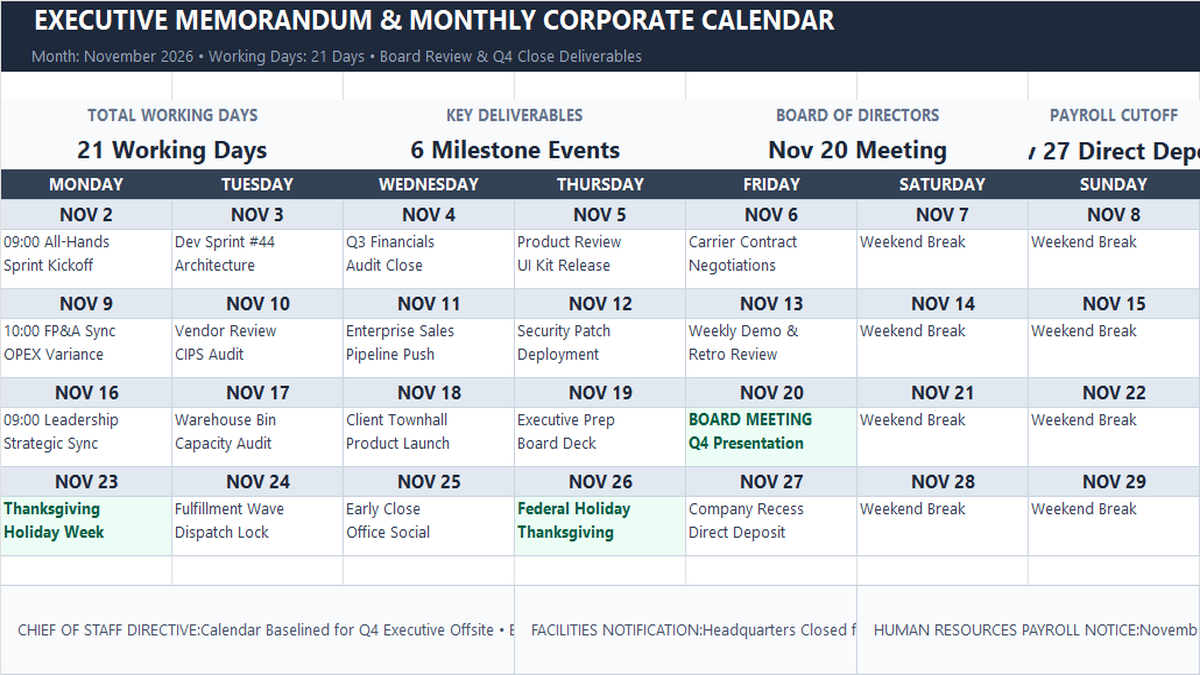
Monthly Memo Calendar Excel Template
Learn how to construct a monthly executive memo calendar in Microsoft Excel featuring single-sheet architecture, working days rollups with NETWORKDAYS, milestone event highlights, and department directive memos.
 Productivity
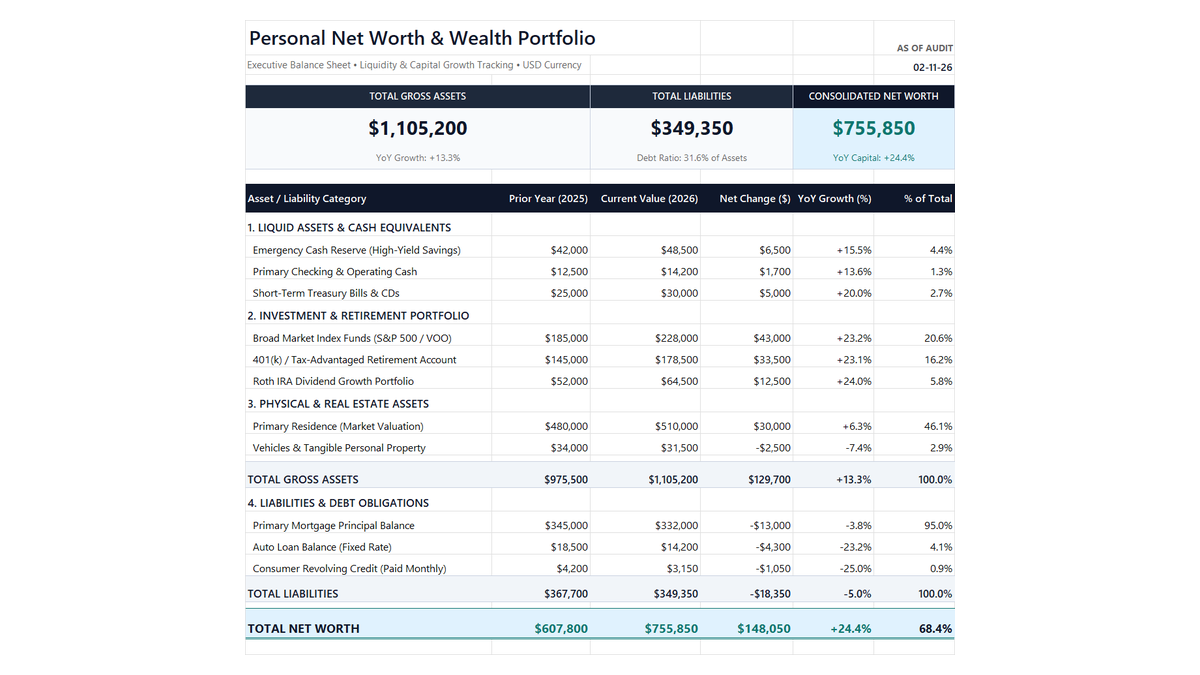
Personal Net Worth Tracker Excel Template
Build a clean personal net worth tracker in Microsoft Excel to monitor liquid savings, retirement accounts, real estate equity, and debt paydown with automated balance sheet math.
 Finance
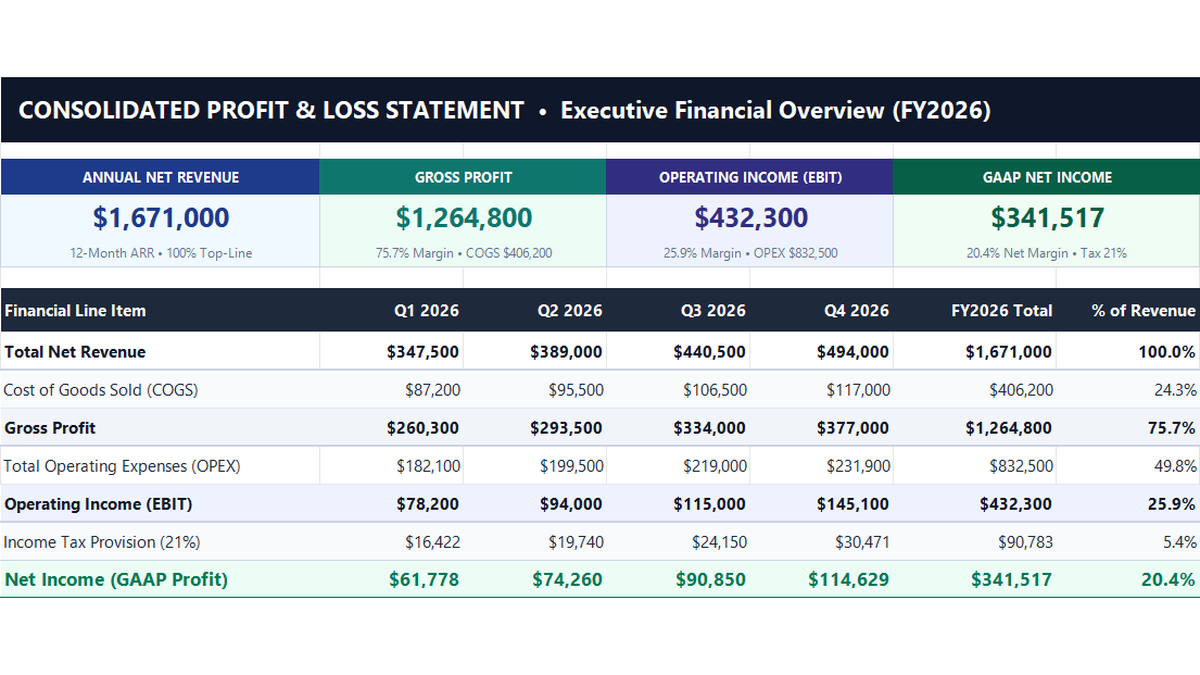
Profit and Loss Statement Excel Template
Build a standard 12-month corporate profit and loss statement in Microsoft Excel to track revenue lines, cost of goods sold, operating expenses, and net profit margins.
Discussion
Ask questions, share formula tips, or discuss alternative approaches with fellow spreadsheet builders.
Loading discussion...