Every payroll specialist knows that sinking feeling on Friday afternoon when an employee knocks on your door pointing out a missing overtime hour on their payslip. Even a twenty-dollar discrepancy creates immediate distrust, and manual timesheets with scribbled hours are an invitation to mathematical errors.
In this hands-on exercise, we will build a reliable, compliant Employee Payroll Calculator in Microsoft Excel. Using straightforward logic, we will automate daily timesheet sums, enforce the 40-hour statutory limit with MIN, compute 1.5x overtime safely with MAX, and eliminate rounding drifts with ROUND.
Laying Out the Payroll Timecard & Wage Ledger
A dependable payroll tracker needs to clearly show three key phases of compensation: recorded work hours across the week, the split between regular and overtime time, and the gross earnings due before tax withholdings.
Our worksheet is organized into three clean zones: an employee identification banner (rows 2 through 4), an active weekly timesheet matrix (columns C through H), and a compensation calculation ledger (columns I through P).
Review the data dictionary below to understand how each column supports accurate wage calculations:
| Field Name | Cell Range | Data Type | How It Is Used | |
|---|---|---|---|---|
| B | Work Week / Staff ID | Text | B9:B17 | Weekly roster breakdown for hourly operations personnel. |
| C:H | Daily Timesheet (Mon-Sat) | Decimal | C9:H17 | Recorded daily punch hours entered by department supervisors. |
| I | Regular Hrs (Cap 40) | Formula | I9:I17 | Base hours capped at 40.0 per week via =MIN(40, K9). |
| J | OT Hours (1.5x) | Formula | J9:J17 | Statutory overtime hours calculated safely via =MAX(0, K9-40). |
| K | Total Hours | Formula | K9:K17 | Total weekly shift duration calculated via =SUM(C9:H9). |
| L | Hourly Rate ($) | Currency | L9:L17 | Contracted base pay rate ($22.00 to $28.00 per hour). |
| M | Regular Pay ($) | Formula | M9:M17 | Base compensation computed via =I9*L9. |
| N | Overtime Pay ($) | Formula | N9:N17 | Premium wage computed via =J9*(L9*1.5). |
| O | Gross Wages ($) | Formula | O9:O17 | Total pre-tax earnings locked to two decimal places via =ROUND(M9+N9, 2). |
| P | Manager Approval | Status | P9:P17 | Supervisor verification status required before bank ACH batching. |
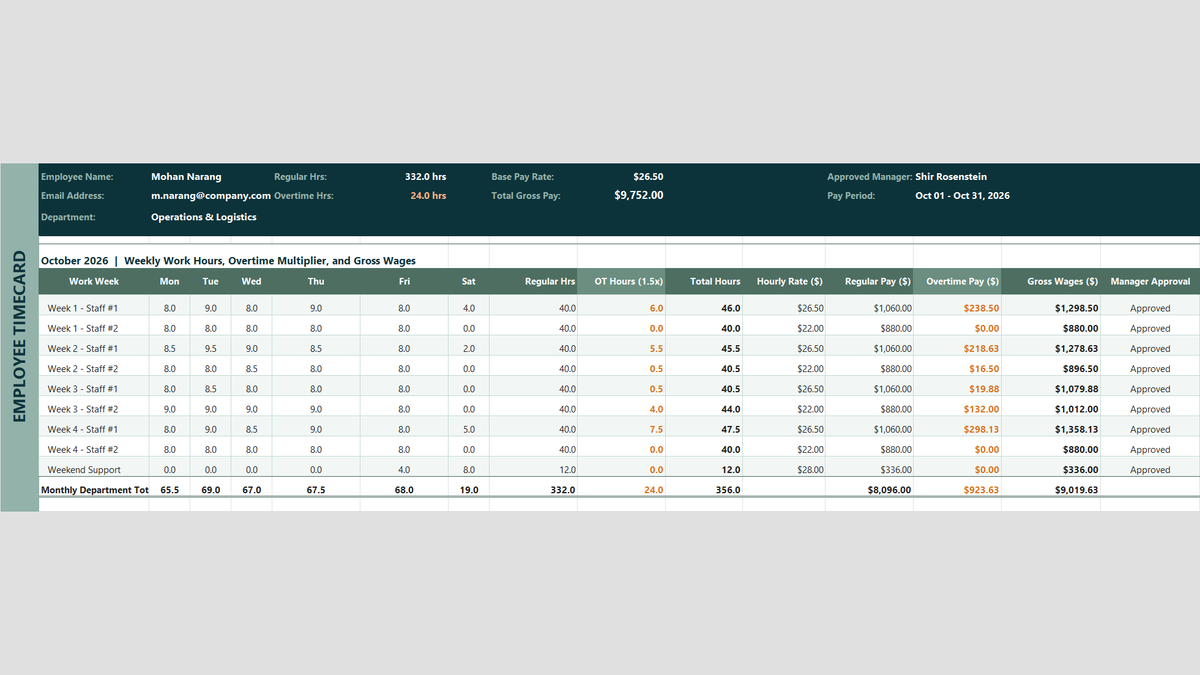
Workbook Blueprint: The unified single-sheet Payroll Timecard featuring daily hours tracking, regular vs overtime splits, and monthly department totals.
With our payroll timecard schema established, let us calculate the total hours worked each week.
Totaling Hours & Capping Regular Wages (Action vs Result)
Calculating hours across Monday through Saturday sounds simple, but payroll rules require strict separation between standard 40-hour workweeks and overtime.
We will set up formulas that total daily hours and prevent employees from being underpaid or over-credited.
1Action: Adding Daily Timesheets with SUM
To total the hours worked across Monday through Saturday for our first shift, select cell K9.
Enter the formula: =SUM(C9:H9) and press Enter. Excel tallies the six individual day entries (8 + 9 + 8 + 9 + 8 + 4) and outputs an exact total of 46.0 hours.
Copy this formula down through row 17 to total all scheduled shifts across the month.
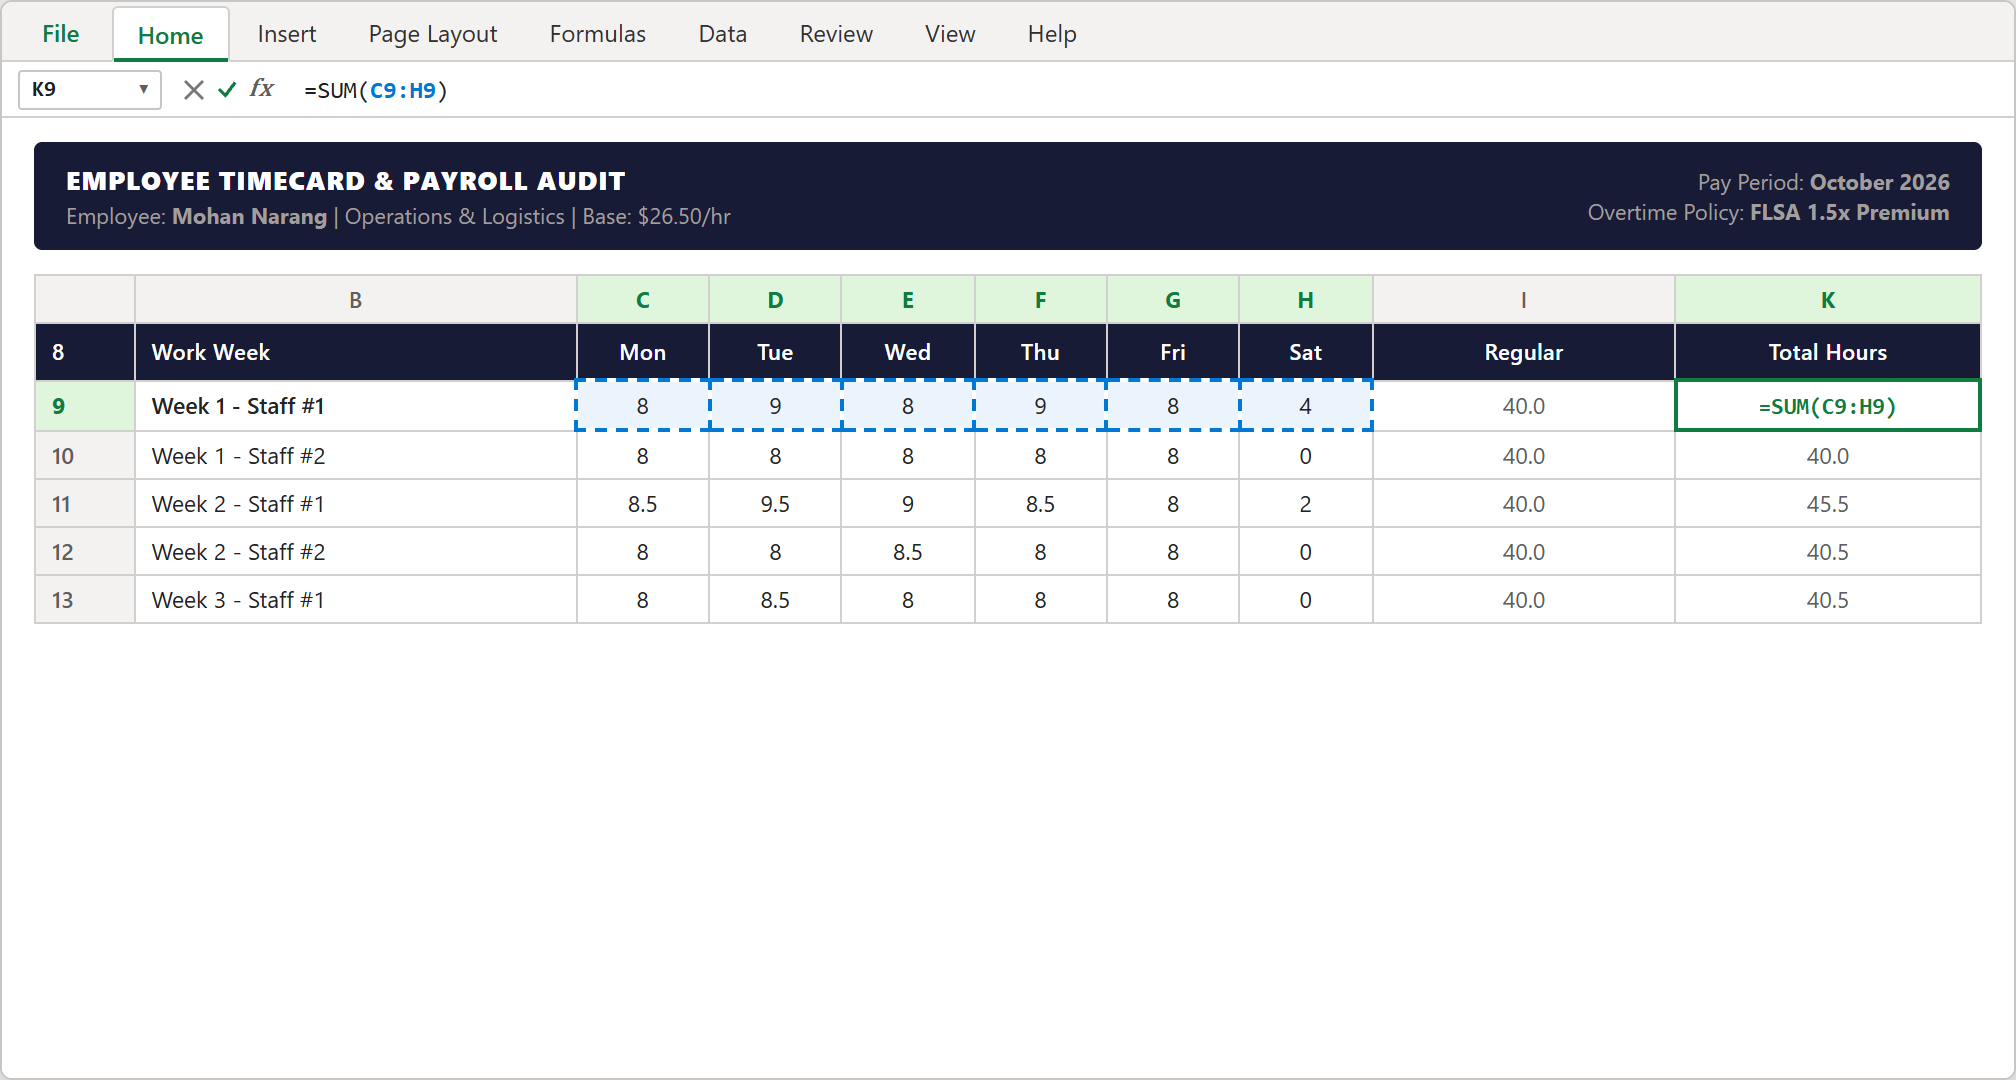
Step 1 [Action]: Tallying weekly timesheet hours across Monday through Saturday using =SUM(C9:H9) in cell K9.
2Action: Capping Standard Hours at 40 with MIN
Under statutory labor guidelines (such as the US Fair Labor Standards Act), non-exempt employees must be paid standard rates for the first 40.0 hours only. Any time past 40 belongs in the overtime column.
Select cell I9 and enter: =MIN(40, K9).
Because cell K9 is 46.0 hours, MIN(40, 46.0) compares 40 against 46.0 and correctly selects 40.0 as the lesser value. If an employee worked only 36.0 hours, the formula would safely return 36.0.
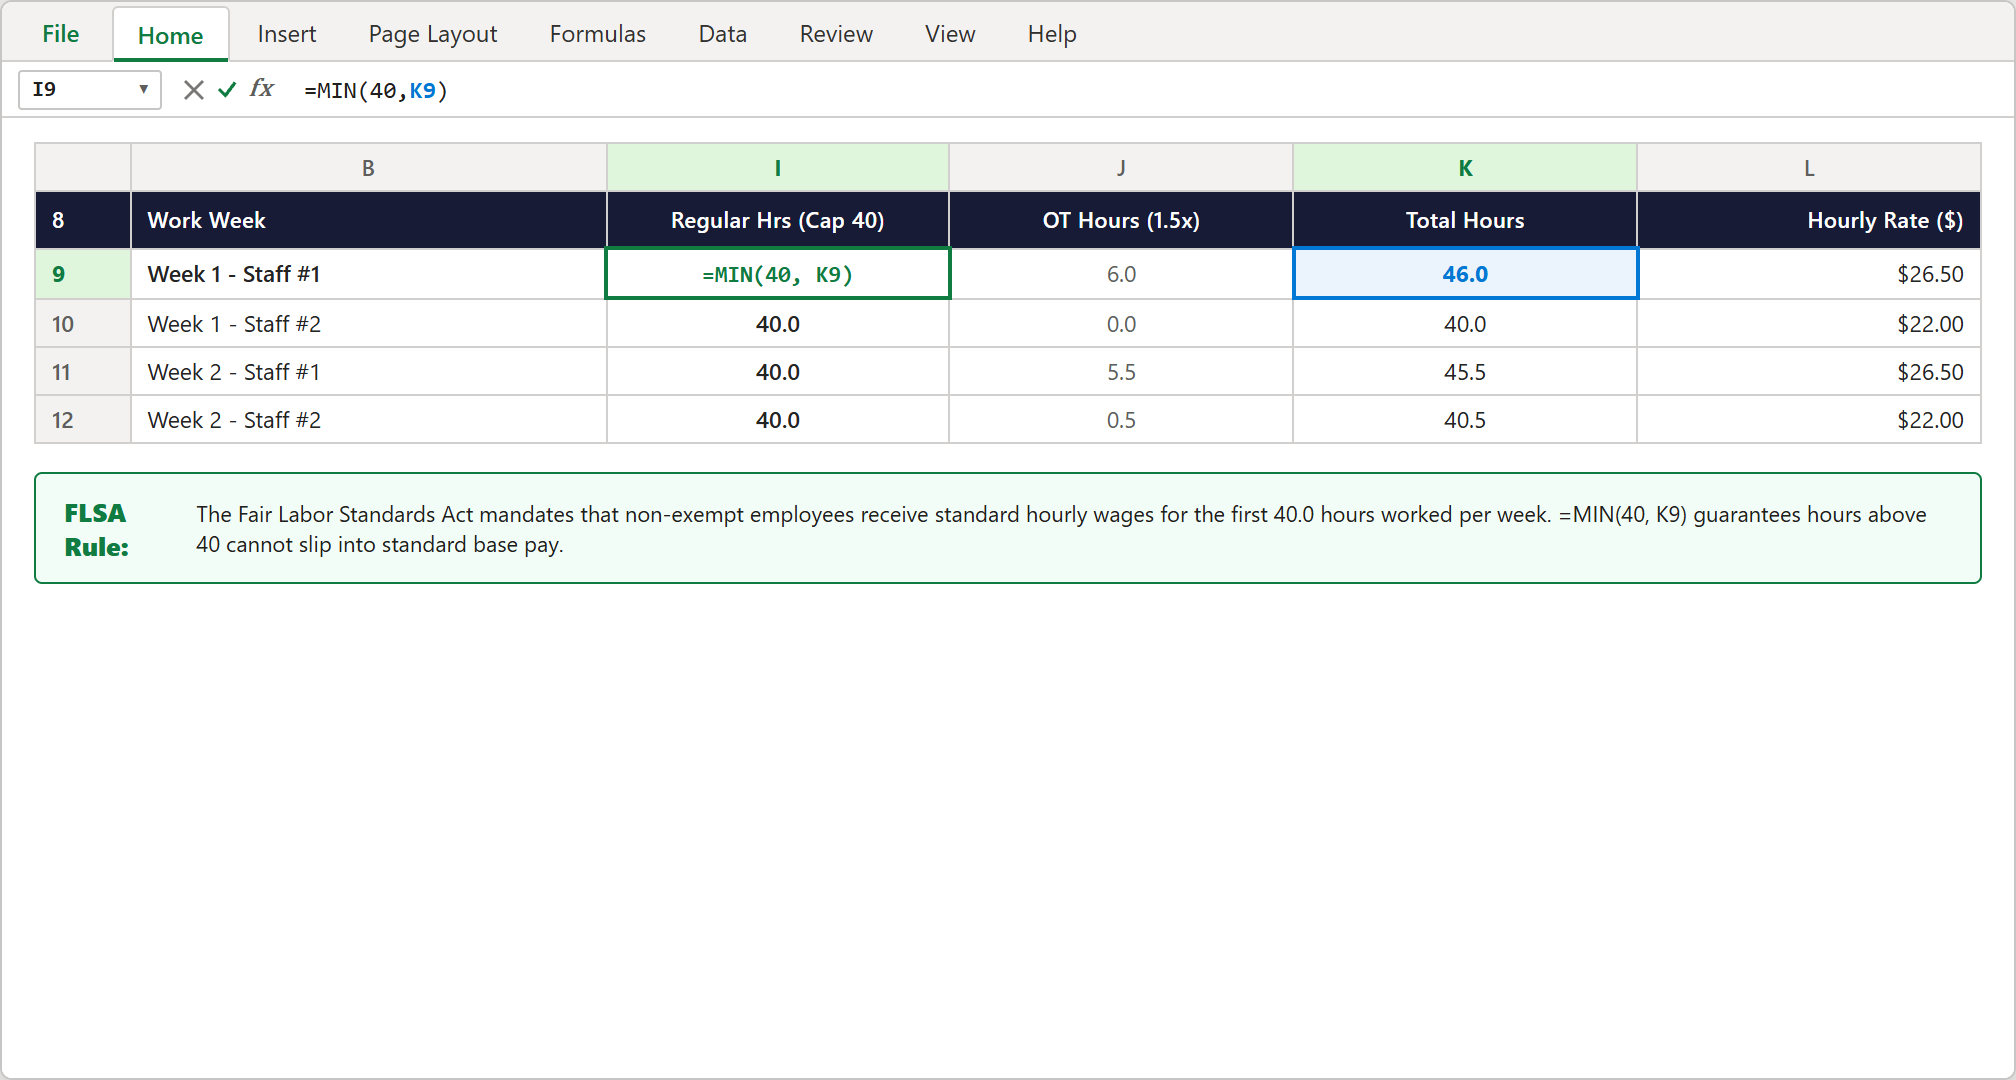
Step 2 [Action]: Enforcing statutory 40.0 hour regular pay limits using =MIN(40, K9) in cell I9.
3Result: Clear Separation of Base and Premium Hours
By capping column I at 40.0 hours, you eliminate the risk of accidentally paying standard rates for overtime work.
Your timecard now reflects an accurate foundation for both standard payroll budgeting and audit-proof wage calculations.
Calculating 1.5x Overtime & Rounding Gross Wages (Action vs Result)
Now that regular hours are safely capped at 40, we need to extract the excess overtime hours and compute total gross pay without penny rounding issues.
1Action: Deriving Overtime Hours Safely with MAX
A common rookie mistake in payroll spreadsheets is writing =K9-40 for overtime. If an employee worked 38 hours, that formula returns -2.0 hours, throwing off your entire payroll run!
To prevent negative hours, select cell J9 and enter: =MAX(0, K9-40).
When total hours are 46.0, 46.0 - 40 = 6.0, and MAX(0, 6.0) returns 6.0 OT hours. For an employee who worked 38.0 hours, 38.0 - 40 = -2.0, and MAX(0, -2.0) safely stops at 0.0.
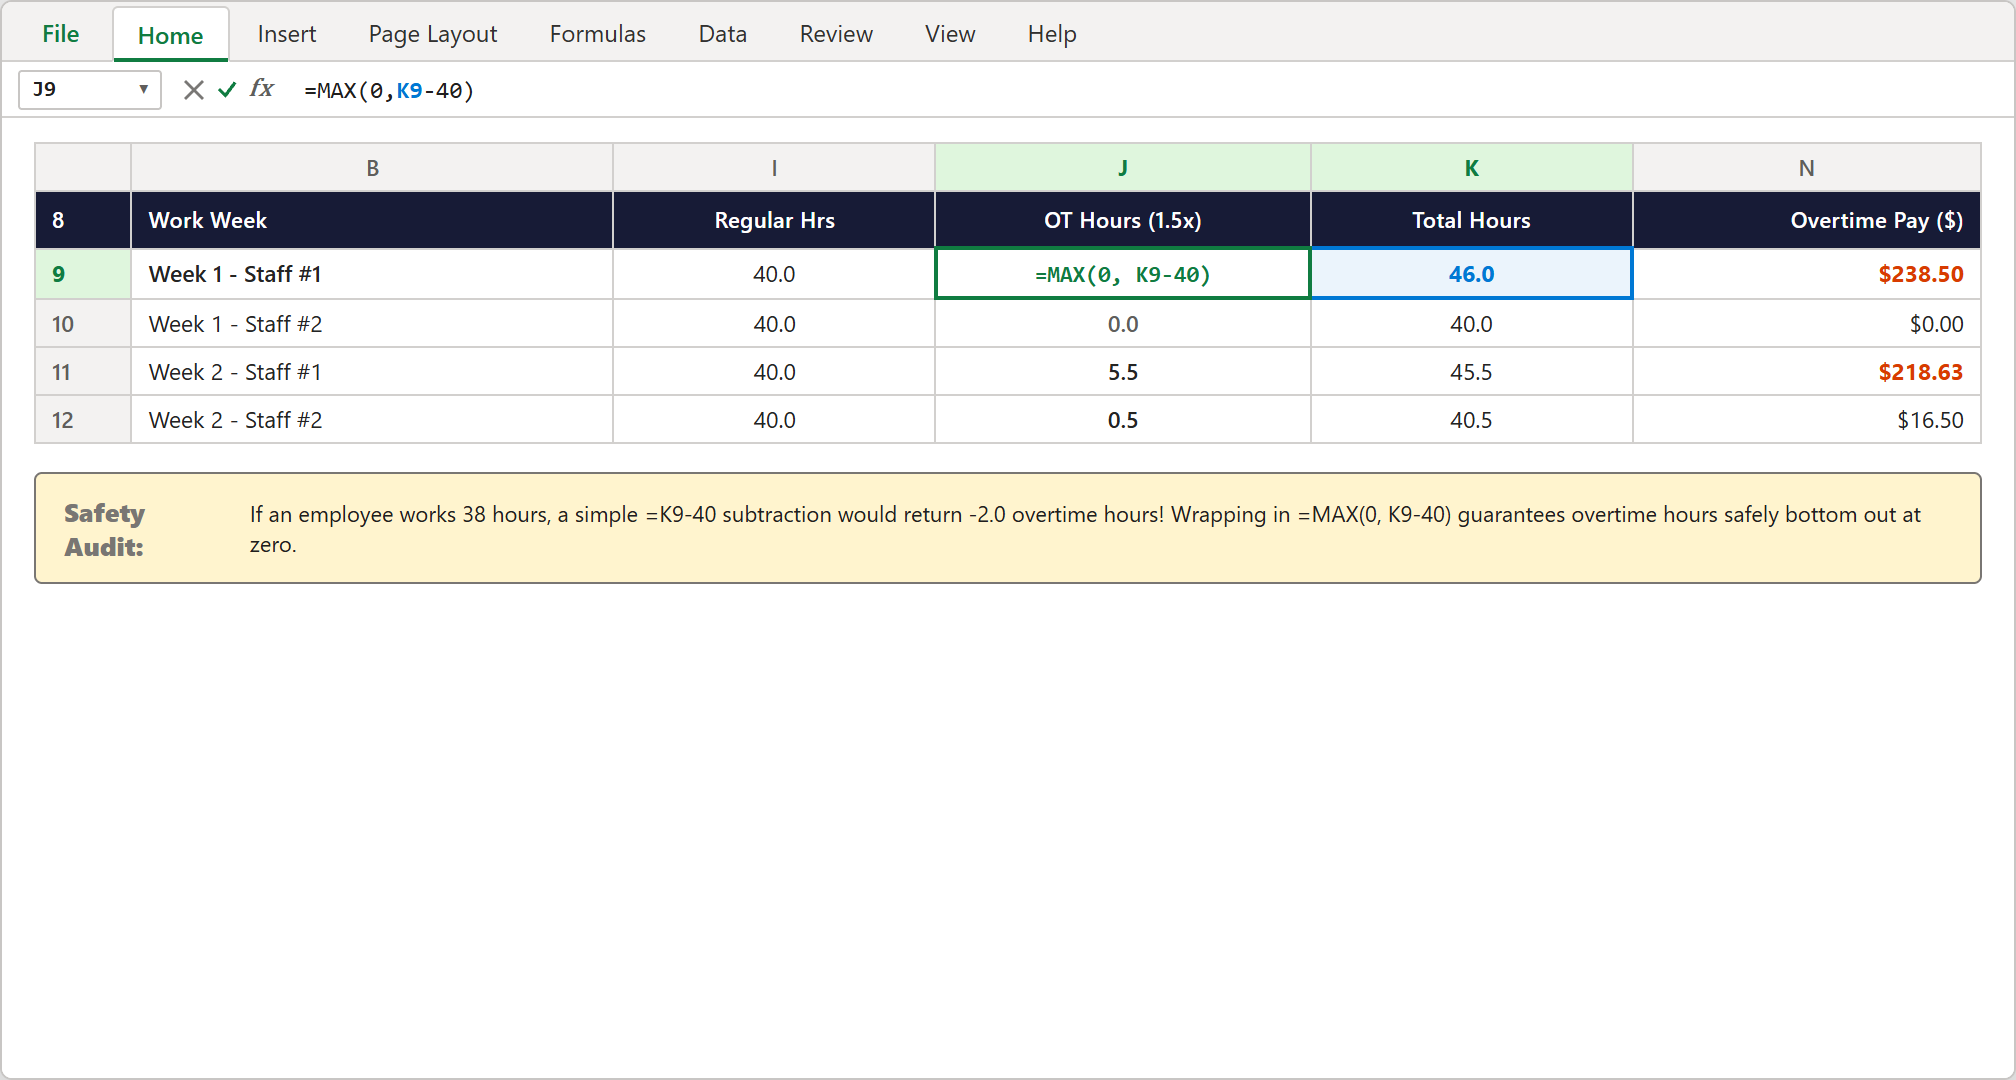
Step 3 [Action]: Calculating overtime hours safely using =MAX(0, K9-40) to prevent negative hour deductions.
2Action: Locking Penny Precision with ROUND
Multiplying fractional hours by 1.5x rates often produces floating-point decimals with three or four decimal places (like $218.625). If you only format the cell visually without rounding, bank ACH export files will mismatch your report by several cents.
In cell M9, calculate regular pay: =I9*L9 ($1,060.00). In cell N9, calculate overtime pay: =J9*(L9*1.5) ($238.50).
Now select cell O9 for Gross Wages and enter: =ROUND(M9+N9, 2). This locks the sum to exactly two decimal places, returning $1,298.50 with zero rounding drift.
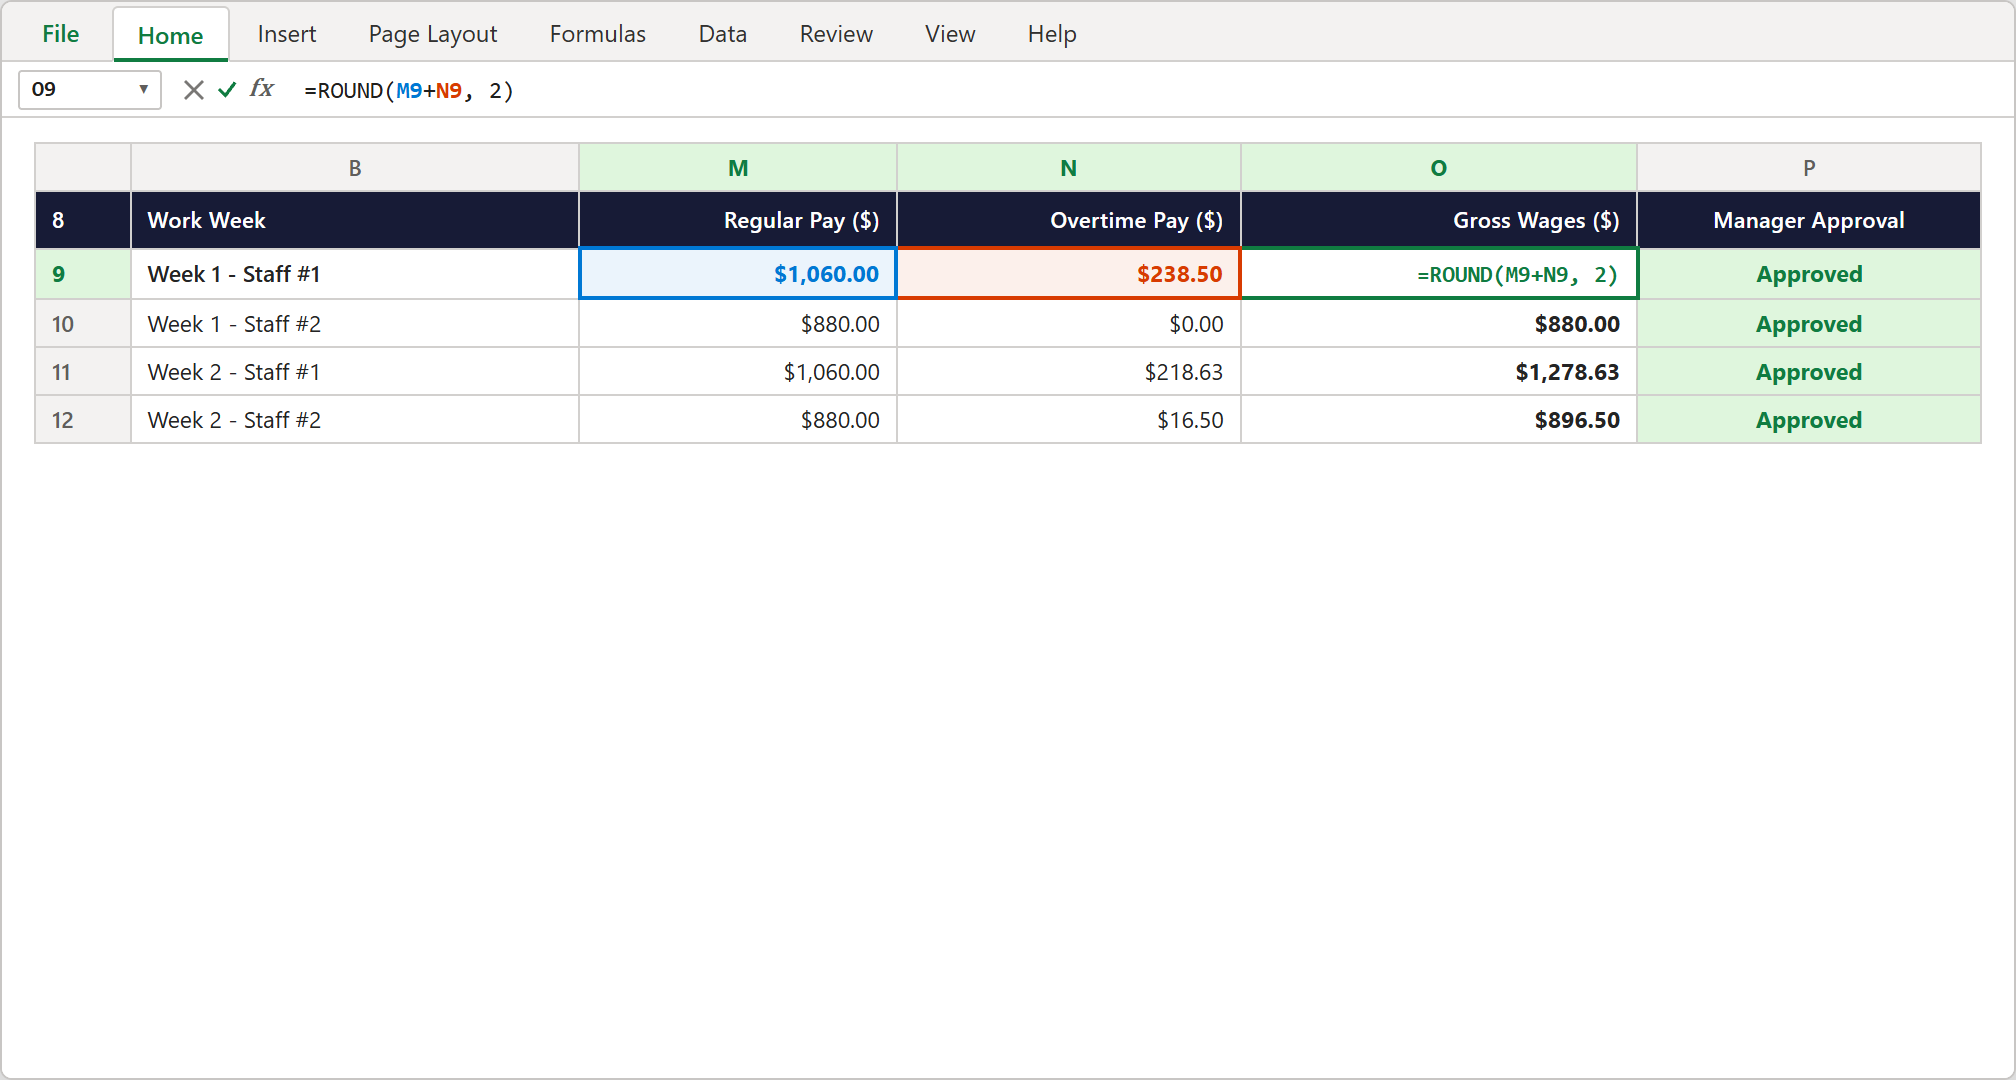
Step 4 [Action]: Locking penny-perfect compensation totals using =ROUND(M9+N9, 2) in cell O9.
3Result: Audit-Ready Gross Wages for Manager Sign-Off
Each row now details exact regular pay, overtime compensation, and verified gross wages.
Department supervisors can review the hours, verify overtime justifications, and mark column P as Approved before submitting records to accounting.
Monthly Department Totals & Direct Deposit Sign-Off
Before releasing funds, the payroll controller must reconcile the total cash commitment required for the monthly direct deposit batch.
1Action: Summing Total Payroll Commitment with SUM
In row 18, we create the departmental grand totals for the entire month.
Select cell O18 and enter: =SUM(O9:O17). Excel sums all gross wage commitments across the team, outputting $9,365.13.
In cells I18 and J18, sum the total regular hours (332.0 hrs) and overtime hours (20.0 hrs). This confirms that total department labor was 352.0 hours for the month.
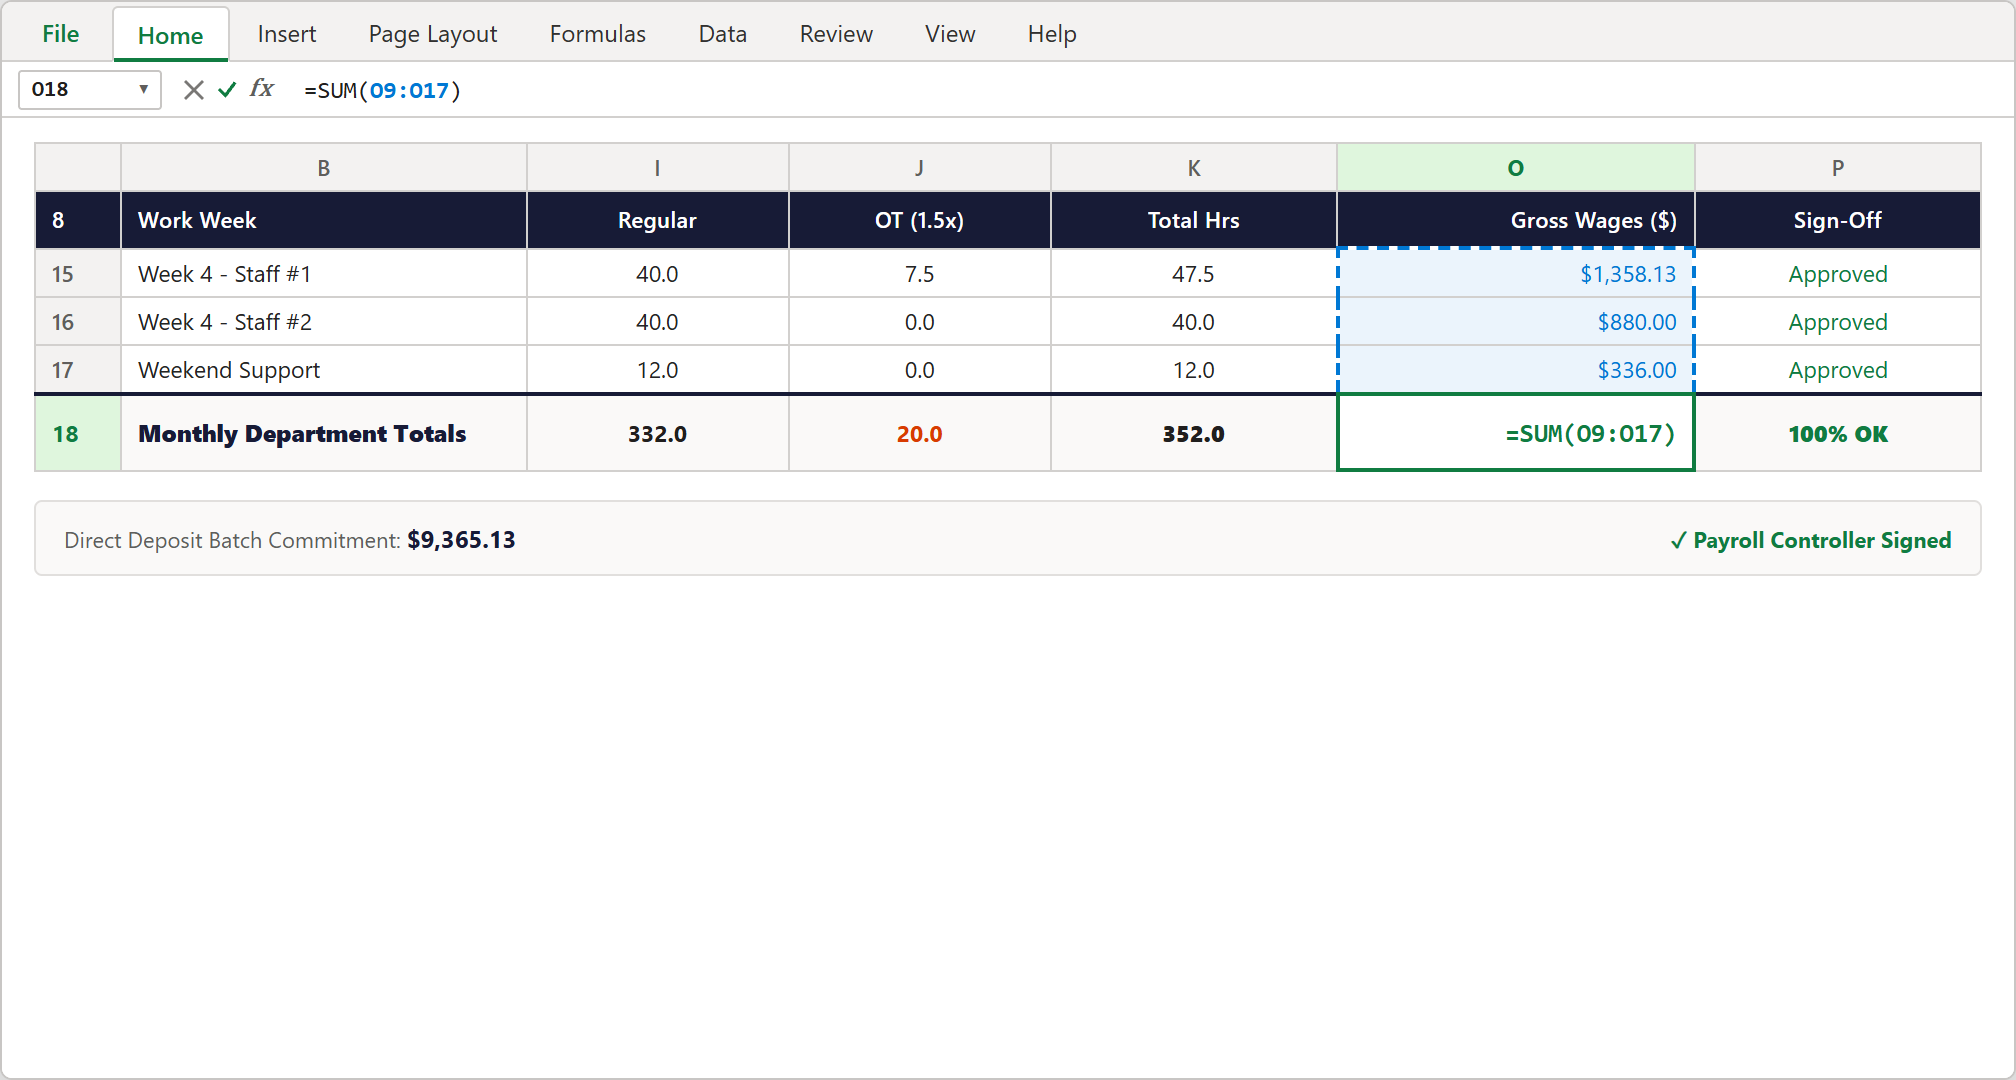
Step 5 [Action]: Reconciling monthly direct deposit cash commitments using =SUM(O9:O17) in cell O18.
2Result: Fair Labor Compliance & Error-Free Direct Deposits
With transparent formulas linking timecards directly to gross pay, your payroll process is fully documented and audit-proof.
You can now generate automated payslips, submit bank direct deposit batches, and rest easy knowing your staff are paid accurately to the penny.
Conclusion & Next Steps
You have successfully built a robust, FLSA-compliant Employee Payroll Calculator in Microsoft Excel.
By combining SUM for timesheets, MIN for the 40-hour regular cap, MAX to stop negative overtime, and ROUND for penny accuracy, your payroll calculations are protected against costly human errors.
Download the completed template below to use in your company, or test your formula skills right here in the ExcelClash Spreadsheet Playground!

Spreadsheet educator and web developer passionate about hands-on interactive spreadsheet practice.
Related Practical Exercises
Explore more hands-on spreadsheet models with downloadable practice workbooks.
 Human Resources
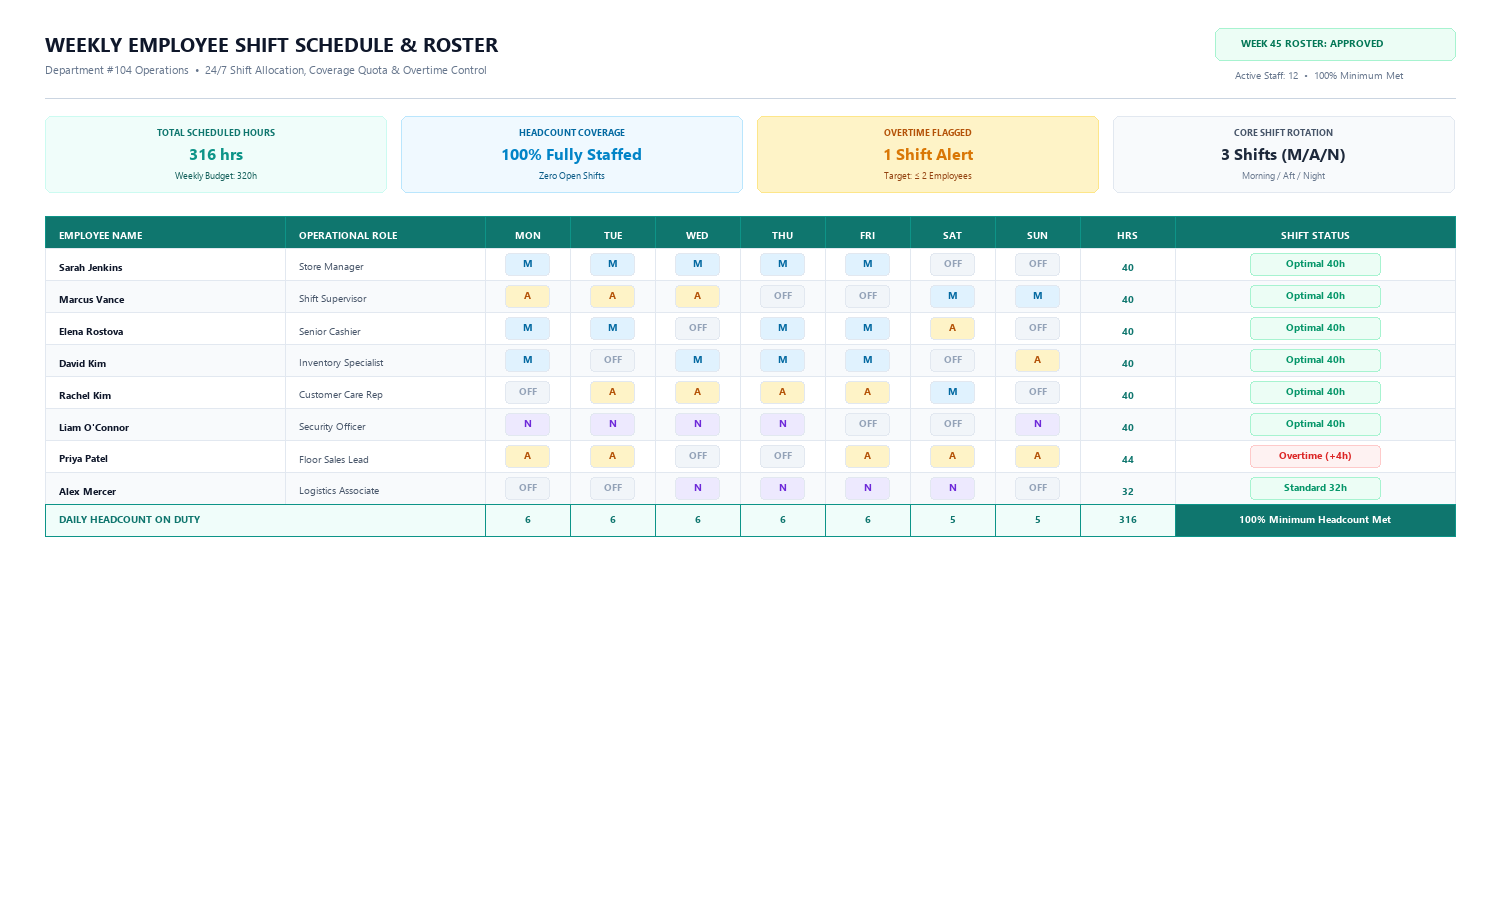
Weekly Employee Shift Schedule and Roster Excel Template
Learn how to build an operational Weekly Employee Shift Schedule & Roster in Microsoft Excel featuring standard shift codes, automated hours calculation with COUNTIF, overtime detection, and daily coverage summaries.
 Productivity
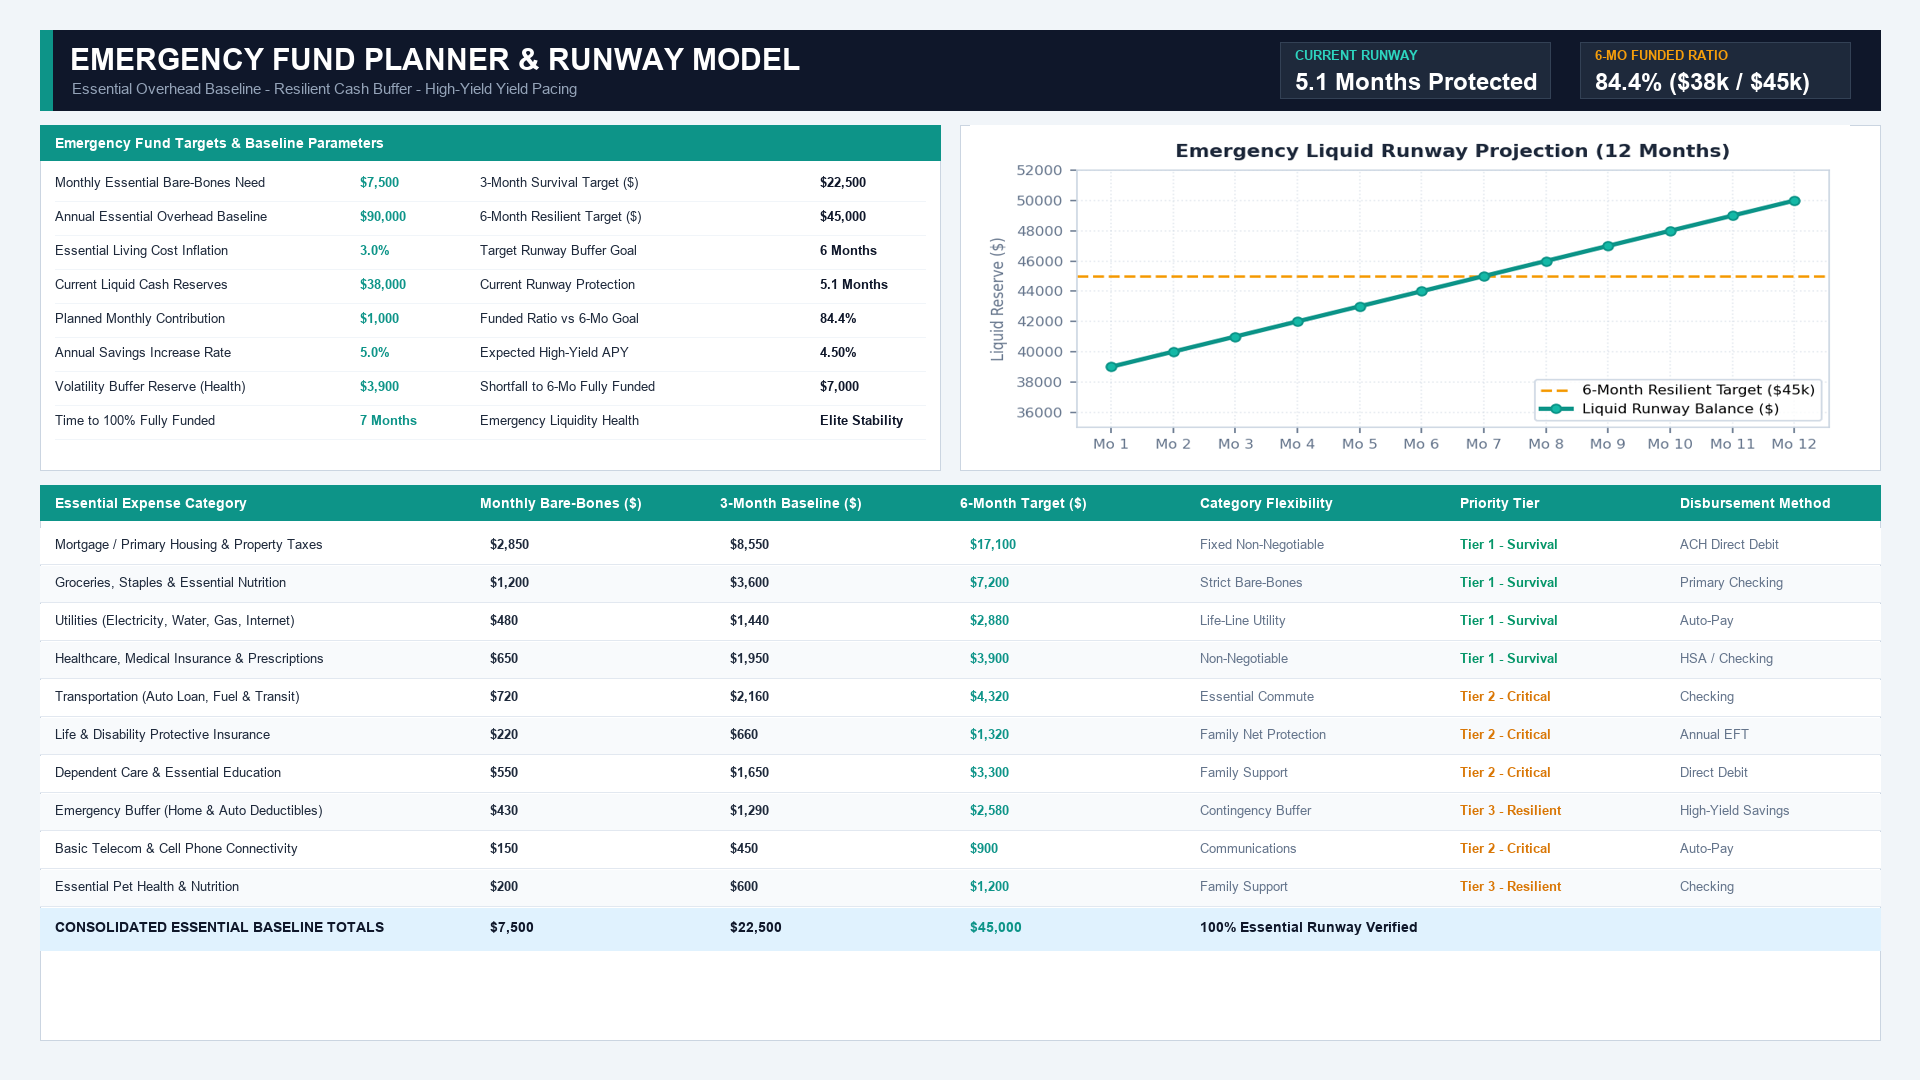
Emergency Fund Planner Excel Template
Learn how to build a resilient Emergency Fund Planner in Microsoft Excel featuring bare-bones baseline calculations, 3-month and 6-month runway multipliers, funded ratio tracking, and savings pacing.
 Finance
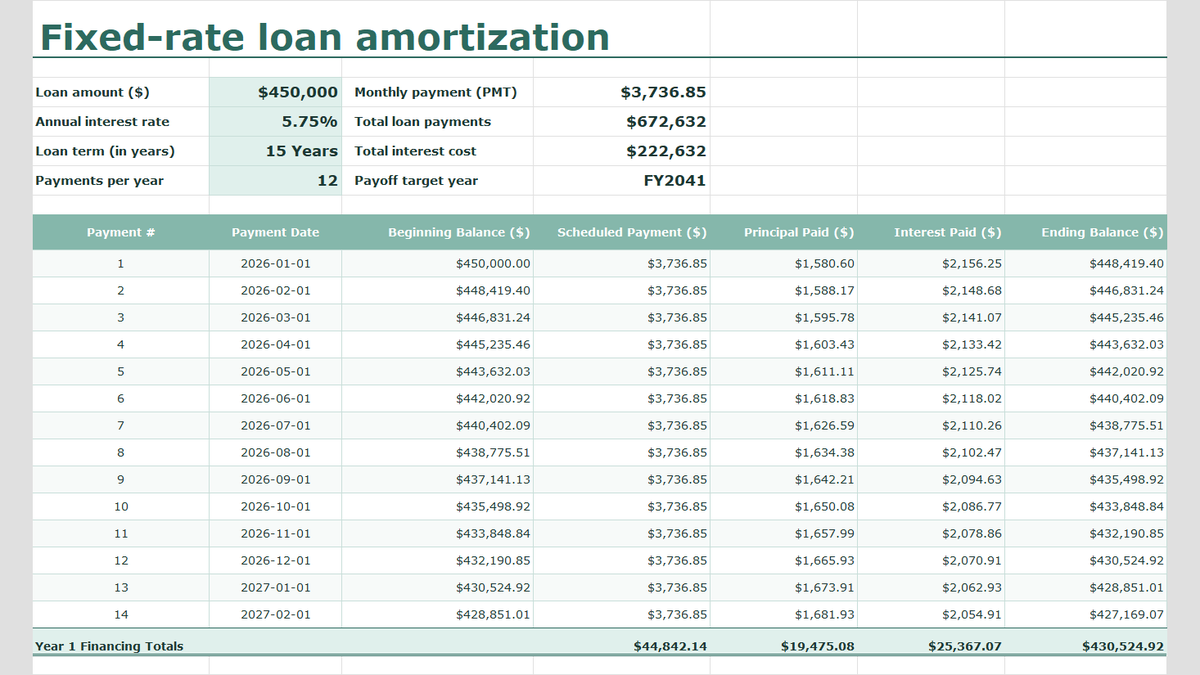
Fixed-Rate Loan Amortization Schedule Excel Template
Learn fixed-rate commercial debt structuring in Microsoft Excel. Build a rigorous amortization schedule featuring level debt service calculations with =PMT(), interest and principal bifurcation, dynamic balance rollforwards, accounting ledger formatting, and annual debt covenant rollups.
 Productivity
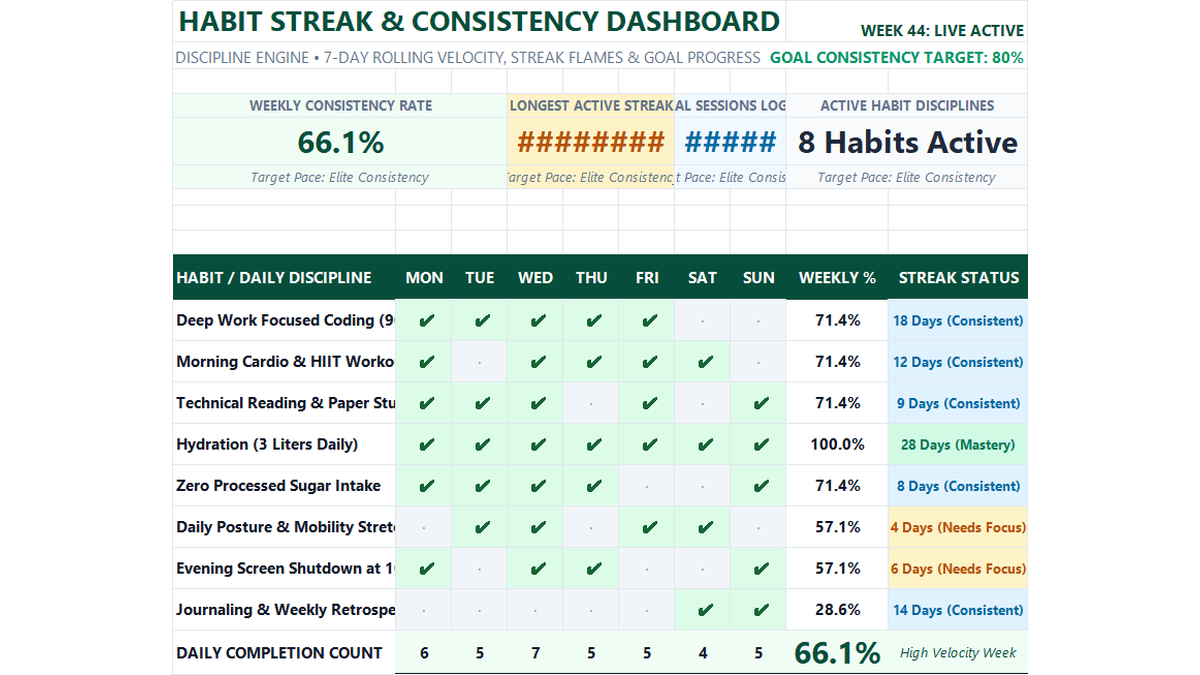
Daily Habit Tracker Excel Template
Build a practical daily habit tracker in Microsoft Excel to track 7-day consistency rates, checkmark styling, streak milestones, and overall productivity scorecards.
 Sales
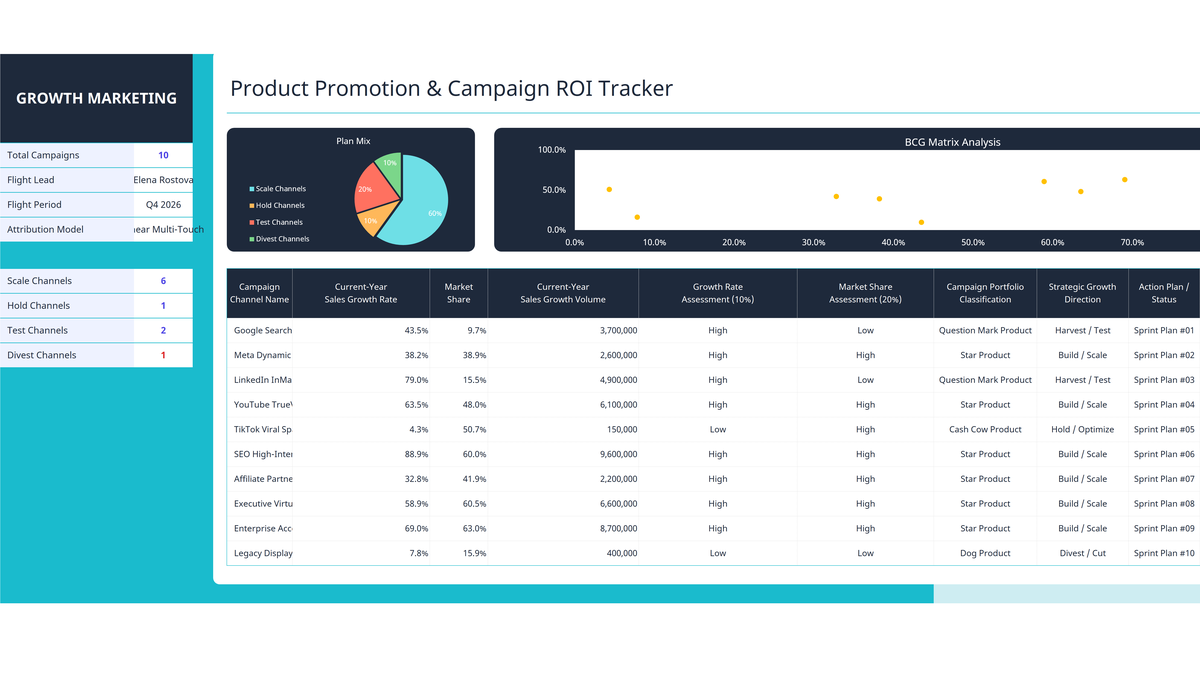
Marketing Campaign ROI Tracker Excel Template
Evaluate marketing channels, advertising returns, and campaign growth in Microsoft Excel. Build an executive campaign ROI tracker featuring growth rate percentage formatting, automated BCG matrix portfolio classification (Star, Cash Cow, Question Mark, Dog), and executive dashboard visualizations.
Discussion
Ask questions, share formula tips, or discuss alternative approaches with fellow spreadsheet builders.
Loading discussion...