In fast-moving omnichannel logistics, 17:00 is not just the end of an afternoon shift—it is the cutoff deadline when FedEx, UPS, and DHL sweep trailers depart the loading docks. A shipment lagging behind by ten minutes turns an expedited 2-day delivery promise into a customer cancellation and carrier breach penalty.
Warehouse supervisors and dispatch controllers cannot afford to squint at disorganized clipboards or untamed spreadsheets. When orders flow through multiple distribution nodes—from Chicago Mid-Continent Gateway (ORD) to regional coastal hubs—you need an airtight tracking model that balances granular tracking waybills with high-level wave capacity scorecards.
In this comprehensive guide, we build a production-grade E-Commerce Wave Dispatch & Order Fulfillment Tracker in Microsoft Excel. From dynamic order counting and strict carrier dropdown validation to real-time SLA percentage tracking and visual volume split charts, this workstation gives supply chain teams immediate dockside command.
The High-Velocity Fulfillment Problem: Why Manual Spreadsheets Break at 17:00
At peak shipping volume, warehouse floors operate under fierce physical and temporal pressure. Pickers navigate aisles with barcoded totes, packers seal cartons, and dock loaders stage pallets right at the bay doors. In this high-velocity environment, spreadsheets often become the weakest operational link when they are treated as passive journals rather than proactive control towers.
Consider the three structural traps that derail manual dispatch tracking during evening carrier sweeps:
1. The Typo-Riddled Carrier Trap: When warehouse clerks manually type carrier names, slight variations like "FedEx", "Fed-Ex", or "FEDEX EXP" instantly break downstream pivot tables and courier pickup manifests, creating reconciliation discrepancies during evening freight sign-offs.
2. Blind Spots on Dockside Staging: An order that has been packed but is sitting on a staging pallet without a final carrier scan looks identical to an order in transit unless operational statuses are rigorously categorized and visually flagged.
3. Lack of Real-Time SLA Ratios: Logistics directors do not want to calculate fulfillment rates after trailers have already driven away. They need an automated numerator-denominator formula comparing closed parcels against total assigned wave volume before dock doors roll down.
By structuring our Excel workbook with intentional validation boundaries, automated formulas, and high-contrast status cues, we transform raw packing lists into a proactive dispatch cockpit.
Ledger Architecture: Designing the Wave Manifest Data Model
An executive fulfillment tracker pairs high-level dispatch KPI scorecards with an itemized carrier manifest ledger. Our single-sheet layout includes wave facility metadata in row 5, executive performance cards in rows 7 and 8, an operational order ledger in rows 10 through 18, and carrier dispatch rollups in row 20.
Orders are routed across regional distribution hubs (ORD-East, LAX-Gateway, JFK-Metro) with assigned logistics carriers (FedEx Express, DHL Air, UPS Ground).
Review the schema below to understand how the operational manifest functions across columns B through J.
| Col | Field Name | Type | Format | Operational Role |
|---|---|---|---|---|
| B | Order ID | Code | Centered Tag | Unique order fulfillment identifier (ORD-88201 through ORD-88208). |
| C | Customer Recipient | Text | General | Delivery recipient verified against order confirmation. |
| D | Hub Origin | Text | General | Regional distribution center (Hub ORD-East, LAX-Gateway, JFK-Metro). |
| E | Items | Integer | #,##0 | Total individual product units packed inside the container. |
| F | Order Value | Currency | $#,##0.00 | Commercial invoice value for transit insurance coverage. |
| G | Assigned Carrier | List / Dropdown | General | Logistics partner (FedEx Express, DHL Air Express, UPS Ground, USPS Priority). |
| H | Tracking Waybill | Code | Centered Tag | Carrier waybill tracking number (TRK-9921-01). |
| I | SLA Target | Integer / Tag | 0 "Days" | Contracted transit commitment (1 Day, 2 Days, 3 Days). |
| J | Fulfillment State | Categorical | Badge Format | Operational parcel stage: Dispatched, Staged for Dock, or Critical Hold. |
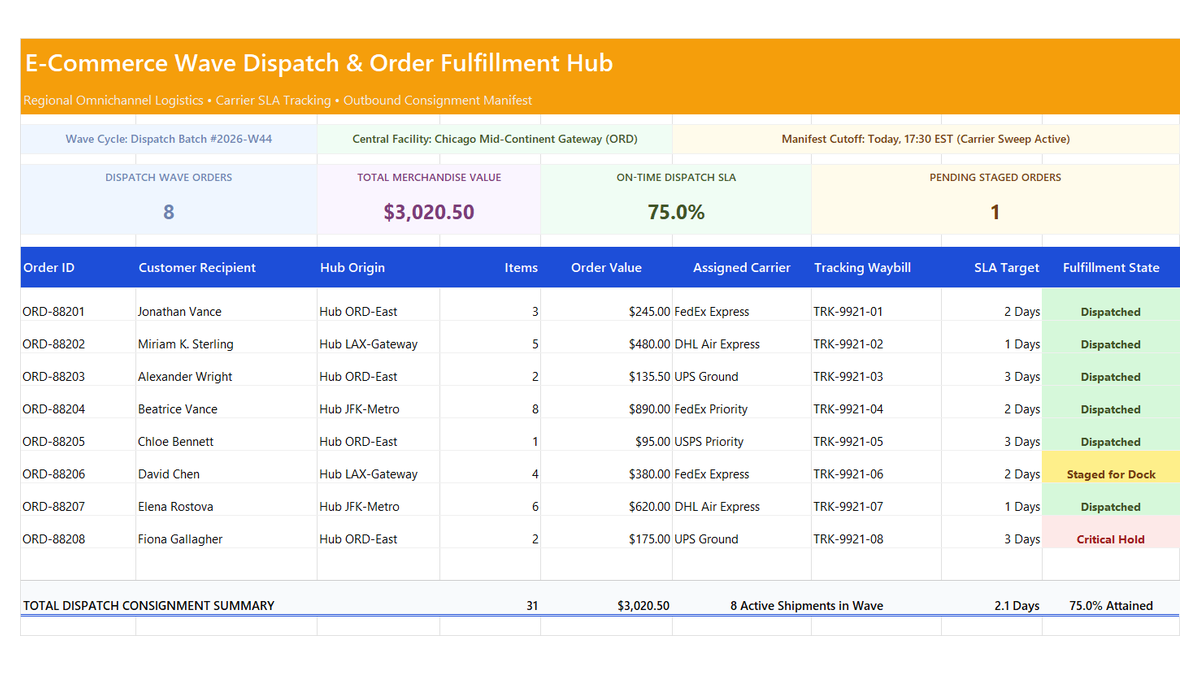
Workbook Blueprint: The E-Commerce Order Fulfillment Tracker architecture displaying wave cycle cards, hub routing metadata, and the carrier dispatch ledger.
With our schema calibrated for multi-hub parcel routing, we can implement the core calculation formulas and validation rules.
Step-by-Step Implementation: Building the Dispatch Cockpit
Follow this structured step-by-step sequence to construct the calculations, data validation dropdowns, conditional rules, and summary analytics directly inside Microsoft Excel.
1Step 1: Quantifying Wave Volume with COUNTA
Our first operational objective is establishing an accurate baseline denominator: how many total customer orders are scheduled for dispatch in Wave Batch #2026-W44?
Rather than hardcoding order counts or risking omissions, we select executive KPI card cell B8 and enter the dynamic counting formula: =COUNTA(B11:B18).
Because column B contains unique string identifiers (ORD-88201 through ORD-88208), COUNTA evaluates all non-empty entries and returns 8 Parcels. This count serves as the master denominator for wave completion benchmarks and carrier trailer volume manifests.
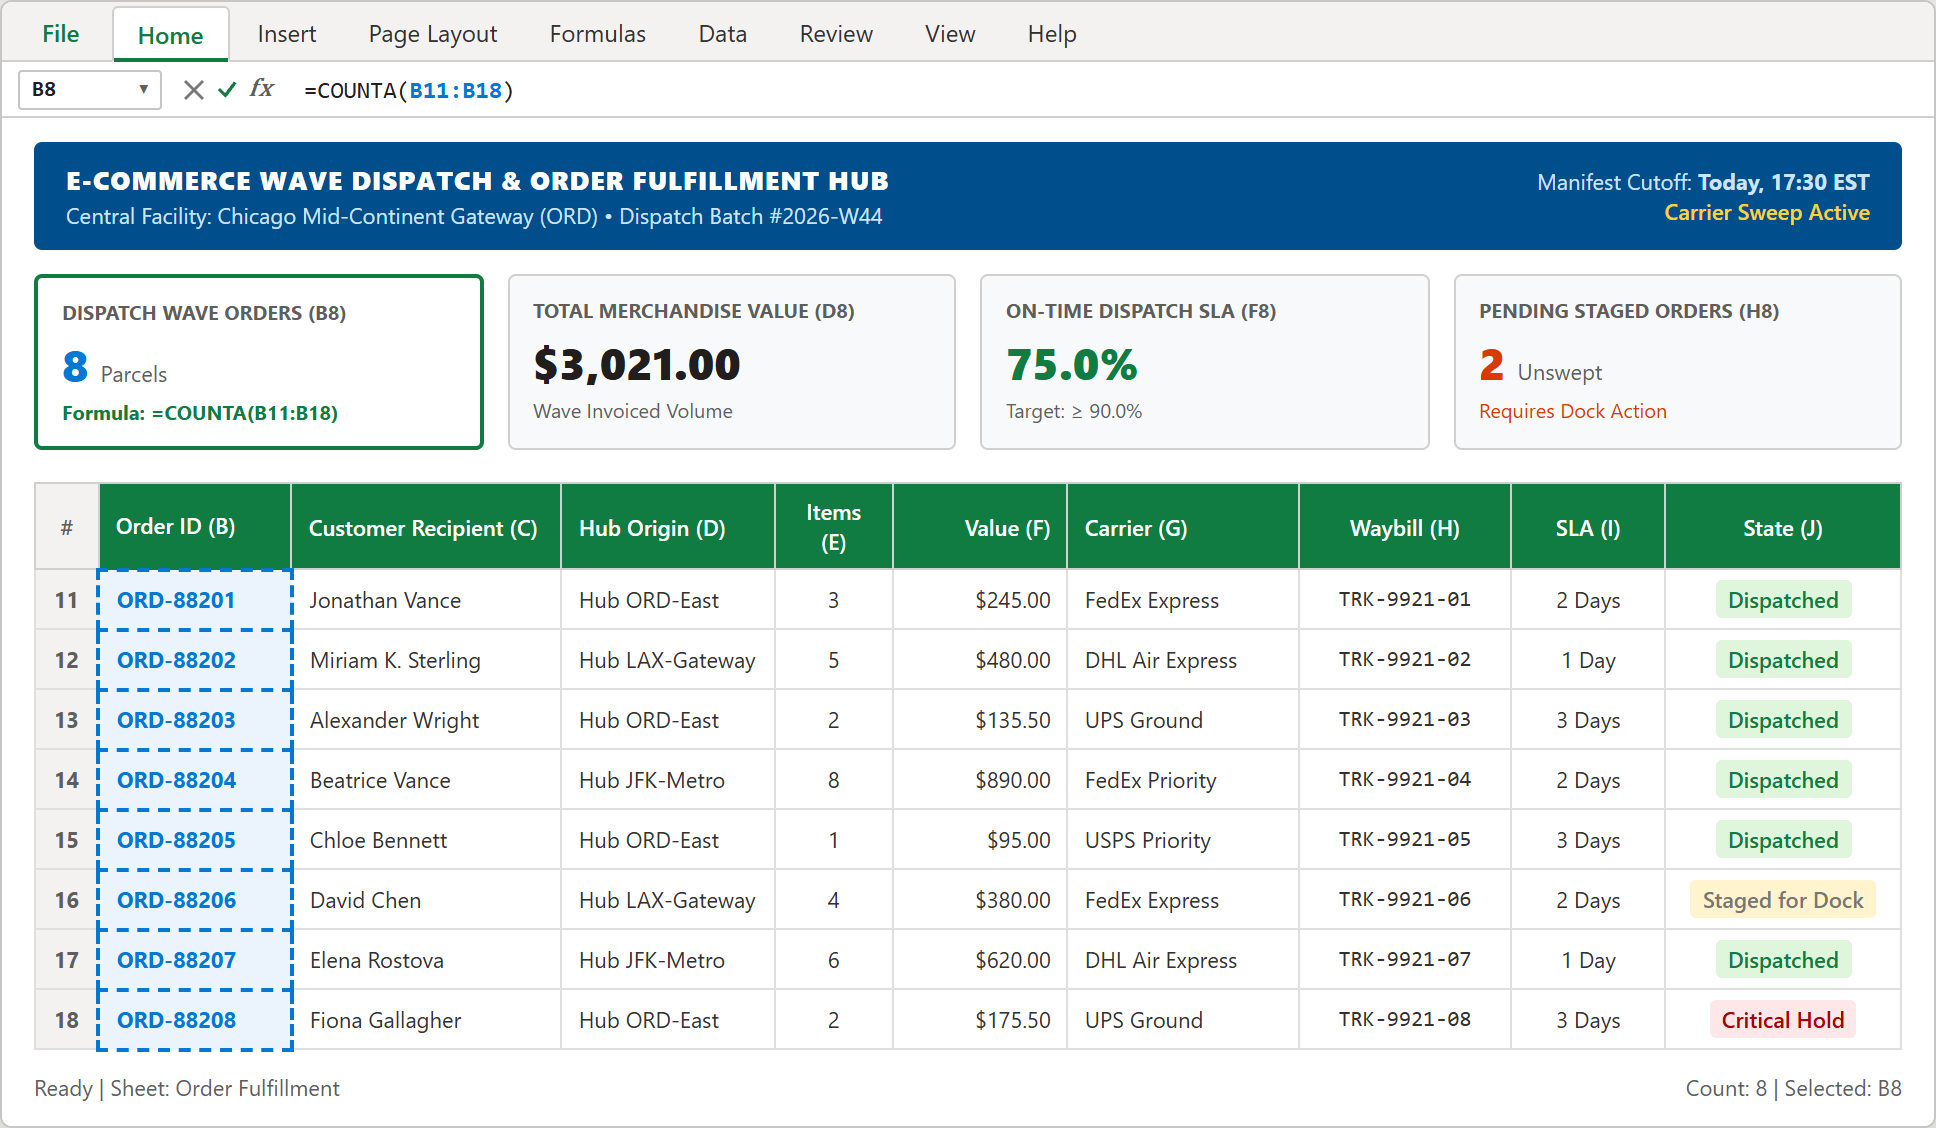
Step 1: Cell B8 formula bar displaying =COUNTA(B11:B18) establishing the total wave batch size of 8 active shipments.
2Step 2: Restricting Carrier Routing with In-Cell Data Validation
To prevent freight allocation errors and courier routing confusion, dock supervisors must prevent manual typing in the Assigned Carrier column.
Select cells G11:G18, navigate to the Data ribbon tab, and click Data Validation. In the dialog, set Allow to List, ensure In-cell dropdown is enabled, and define the approved partner list in the Source field: FedEx Express, DHL Air Express, UPS Ground, USPS Priority, FedEx Priority.
Click OK. Now, clicking any cell in column G instantly reveals a clean in-cell dropdown picker. Warehouse technicians select carriers in one click, enforcing 100% naming uniformity across all outbound documentation.
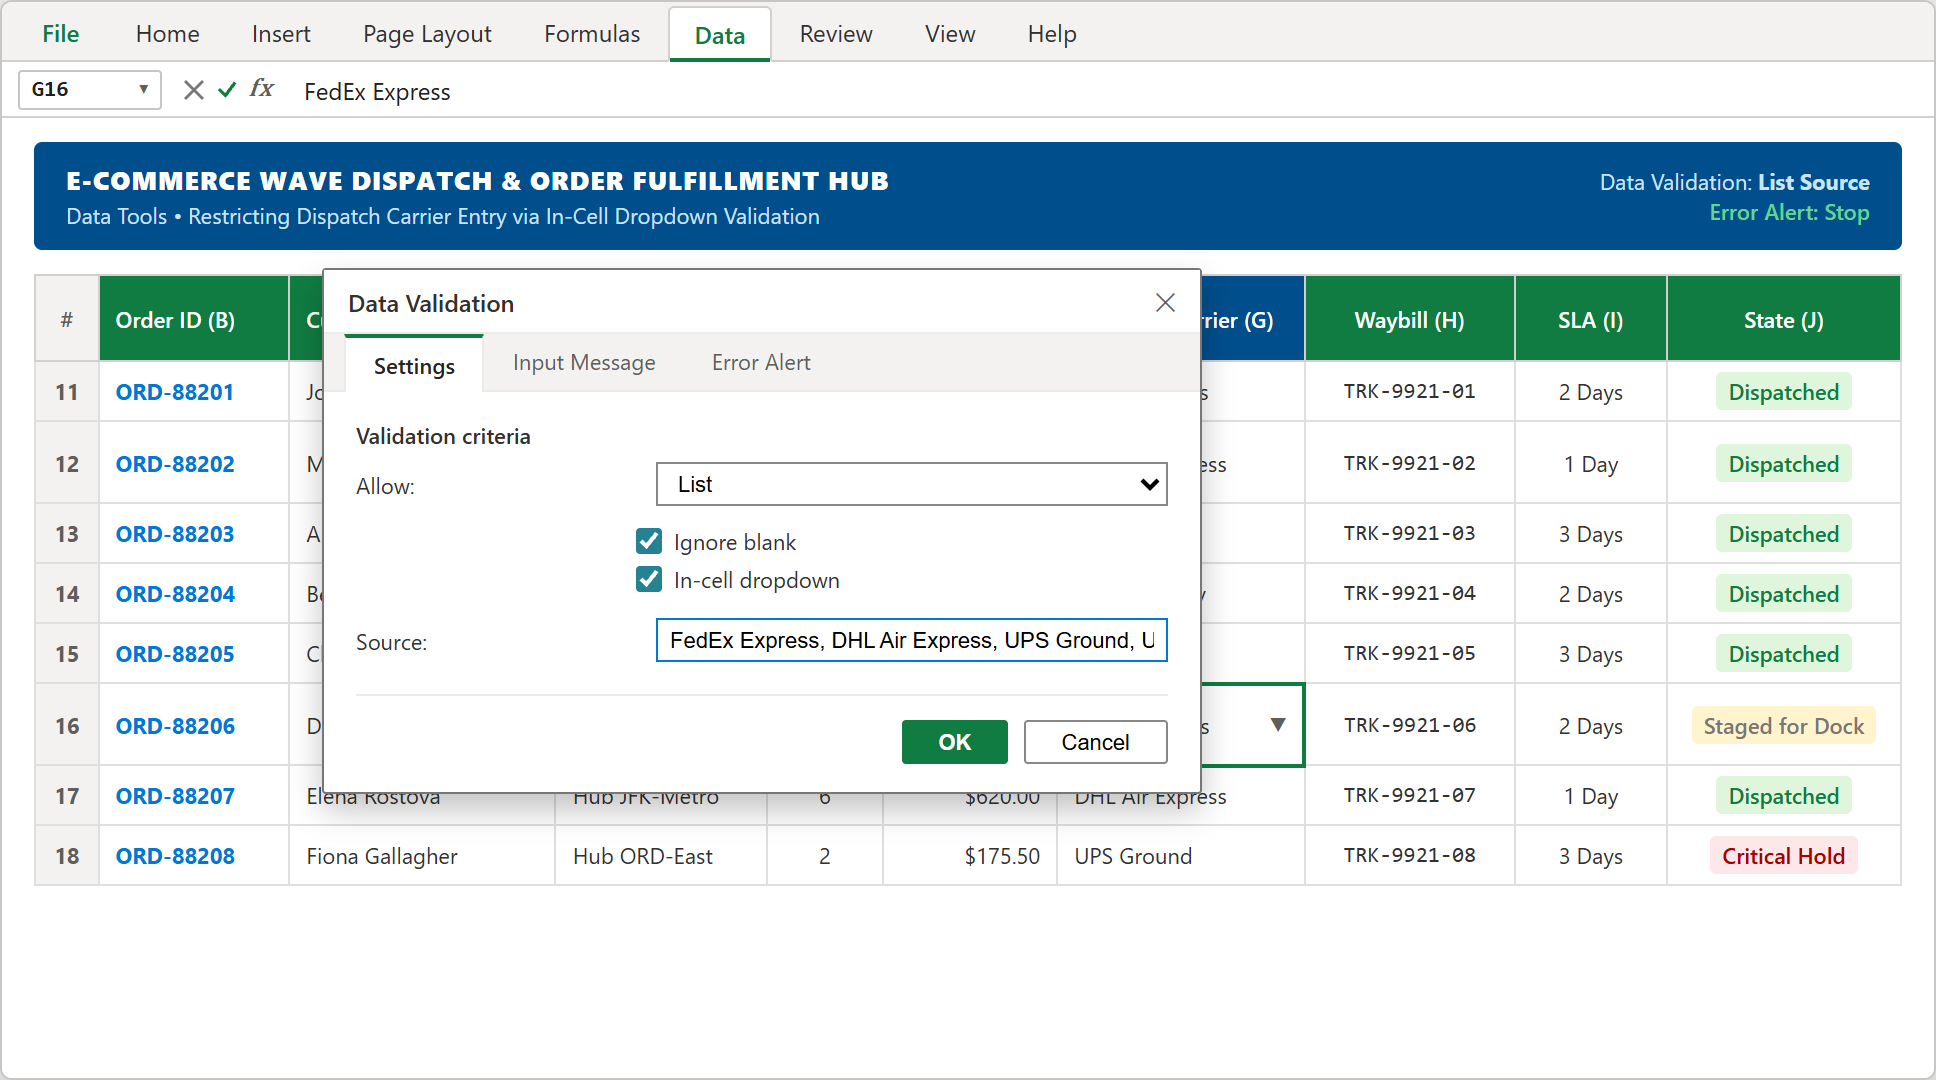
Step 2: The Data Validation settings dialog configuring in-cell carrier list selections for cells G11:G18.
3Step 3: Calculating On-Time SLA Dispatch Ratio with COUNTIF
How close is the facility to achieving its 90.0% wave completion threshold before the 17:30 cutoff window closes? We calculate real-time dispatch attainment in cell F8.
Enter the ratio formula: =COUNTIF(J11:J18, "Dispatched")/COUNTA(J11:J18).
The numerator counts every shipment successfully marked as "Dispatched" (currently 6 parcels), while the denominator dynamically verifies total wave rows (8 parcels). Cell F8 calculates exactly 0.75. Apply the Percentage format (0.0%) to display 75.0%.
With the target threshold set at 90.0%, this scorecard immediately signals dock personnel that 2 remaining parcels require urgent attention before final sweep sign-off.
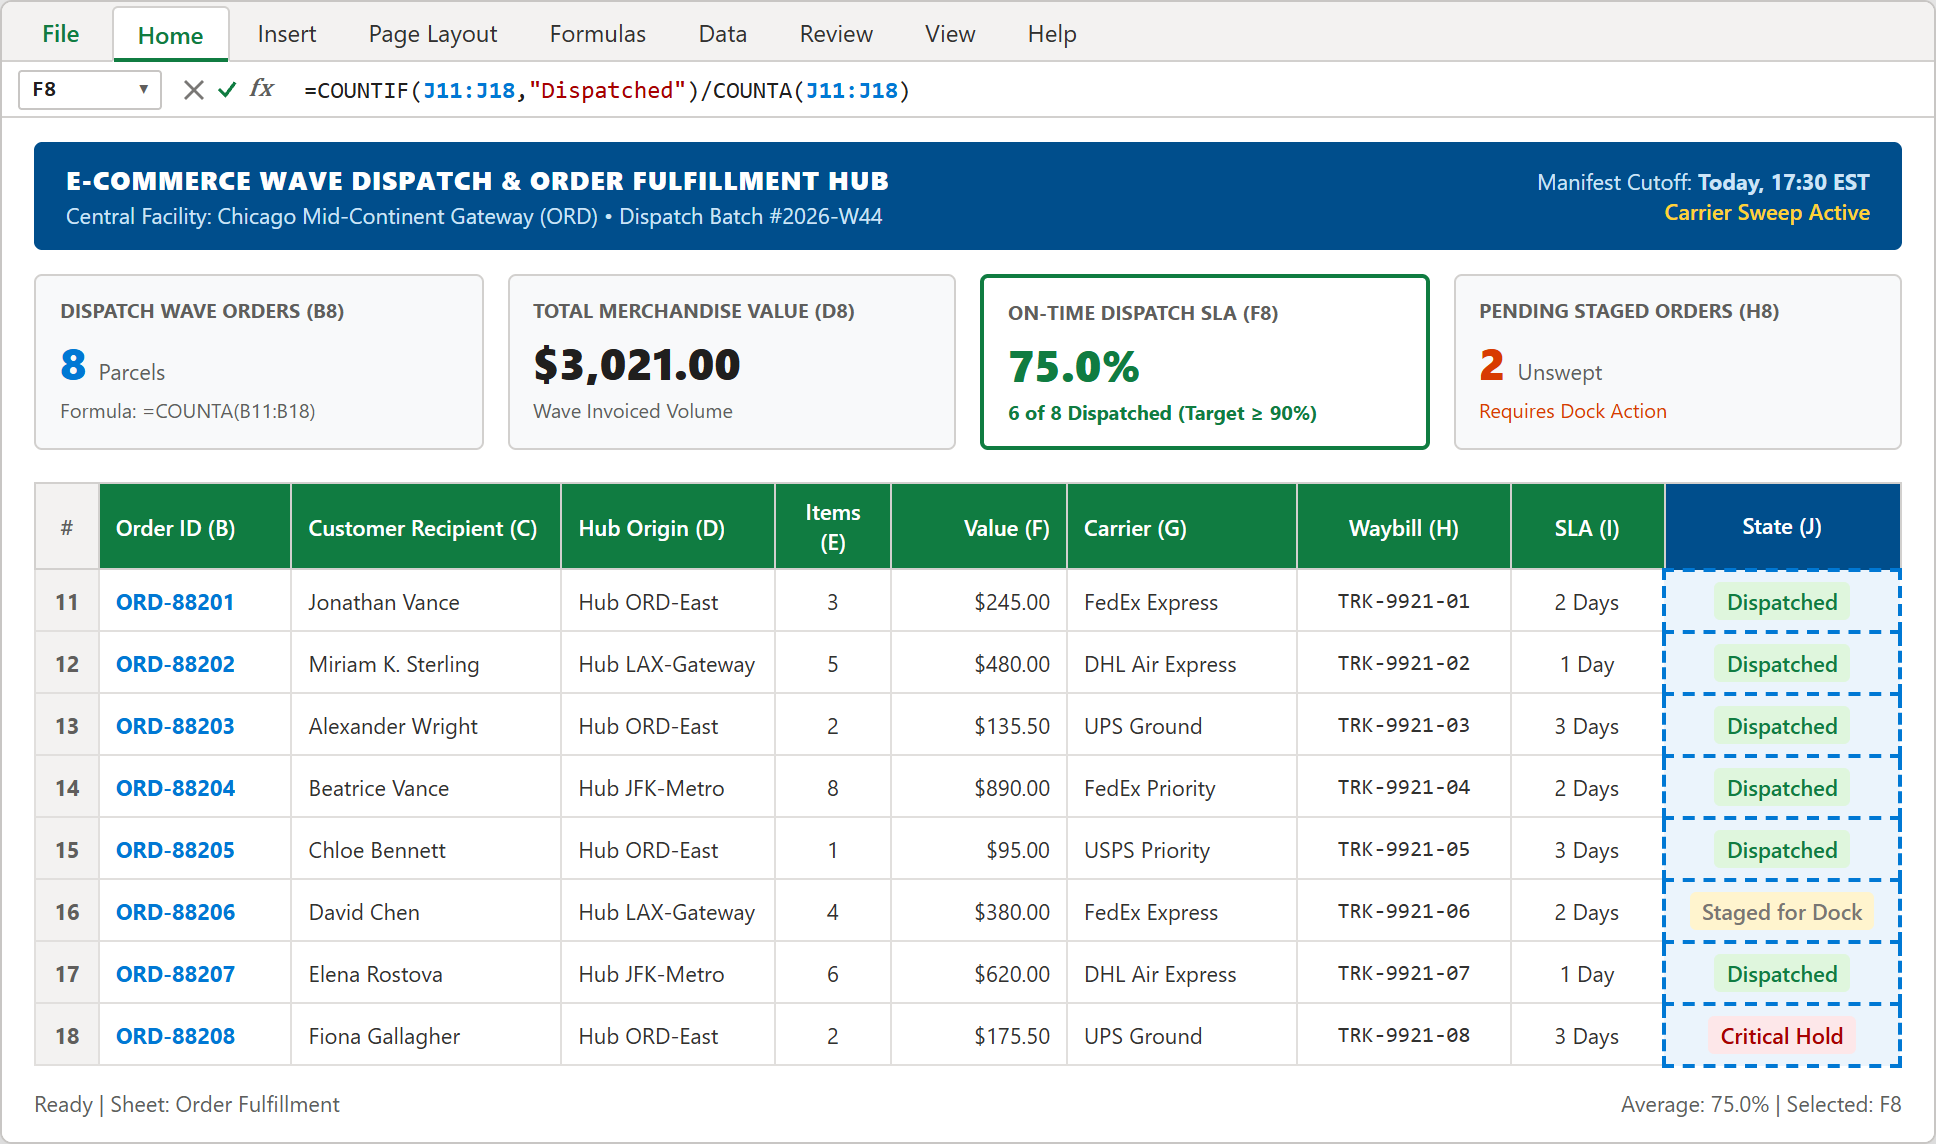
Step 3: Formula bar active with =COUNTIF(J11:J18, "Dispatched")/COUNTA(J11:J18) rendering a 75.0% dispatch completion rate.
4Step 4: Highlighting Exceptions with Three-Tier Conditional Formatting
In a busy loading dock, monochrome text fails to communicate operational urgency. By applying automated conditional formatting rules across J11:J18, warehouse controllers can spot staging delays across the floor at a glance.
Highlight the range $J$11:$J$18, navigate to Home > Conditional Formatting > Highlight Cells Rules > Equal To, and establish three distinct color-coded operational tiers:
• Dispatched: Soft green fill (#DFF6DD) with dark green text (#107C41) confirming carrier custody handoff.
• Staged for Dock: Muted amber fill (#FFF4CE) with dark gray text (#797673) flagging parcels packed and awaiting trailer loading.
• Critical Hold: Soft rose fill (#FDE7E9) with bold crimson text (#A80000) indicating security holds, hazardous goods checks, or address discrepancies requiring supervisor triage.
As technicians update parcel statuses, cells instantly adapt their styling, eliminating dockside ambiguity.
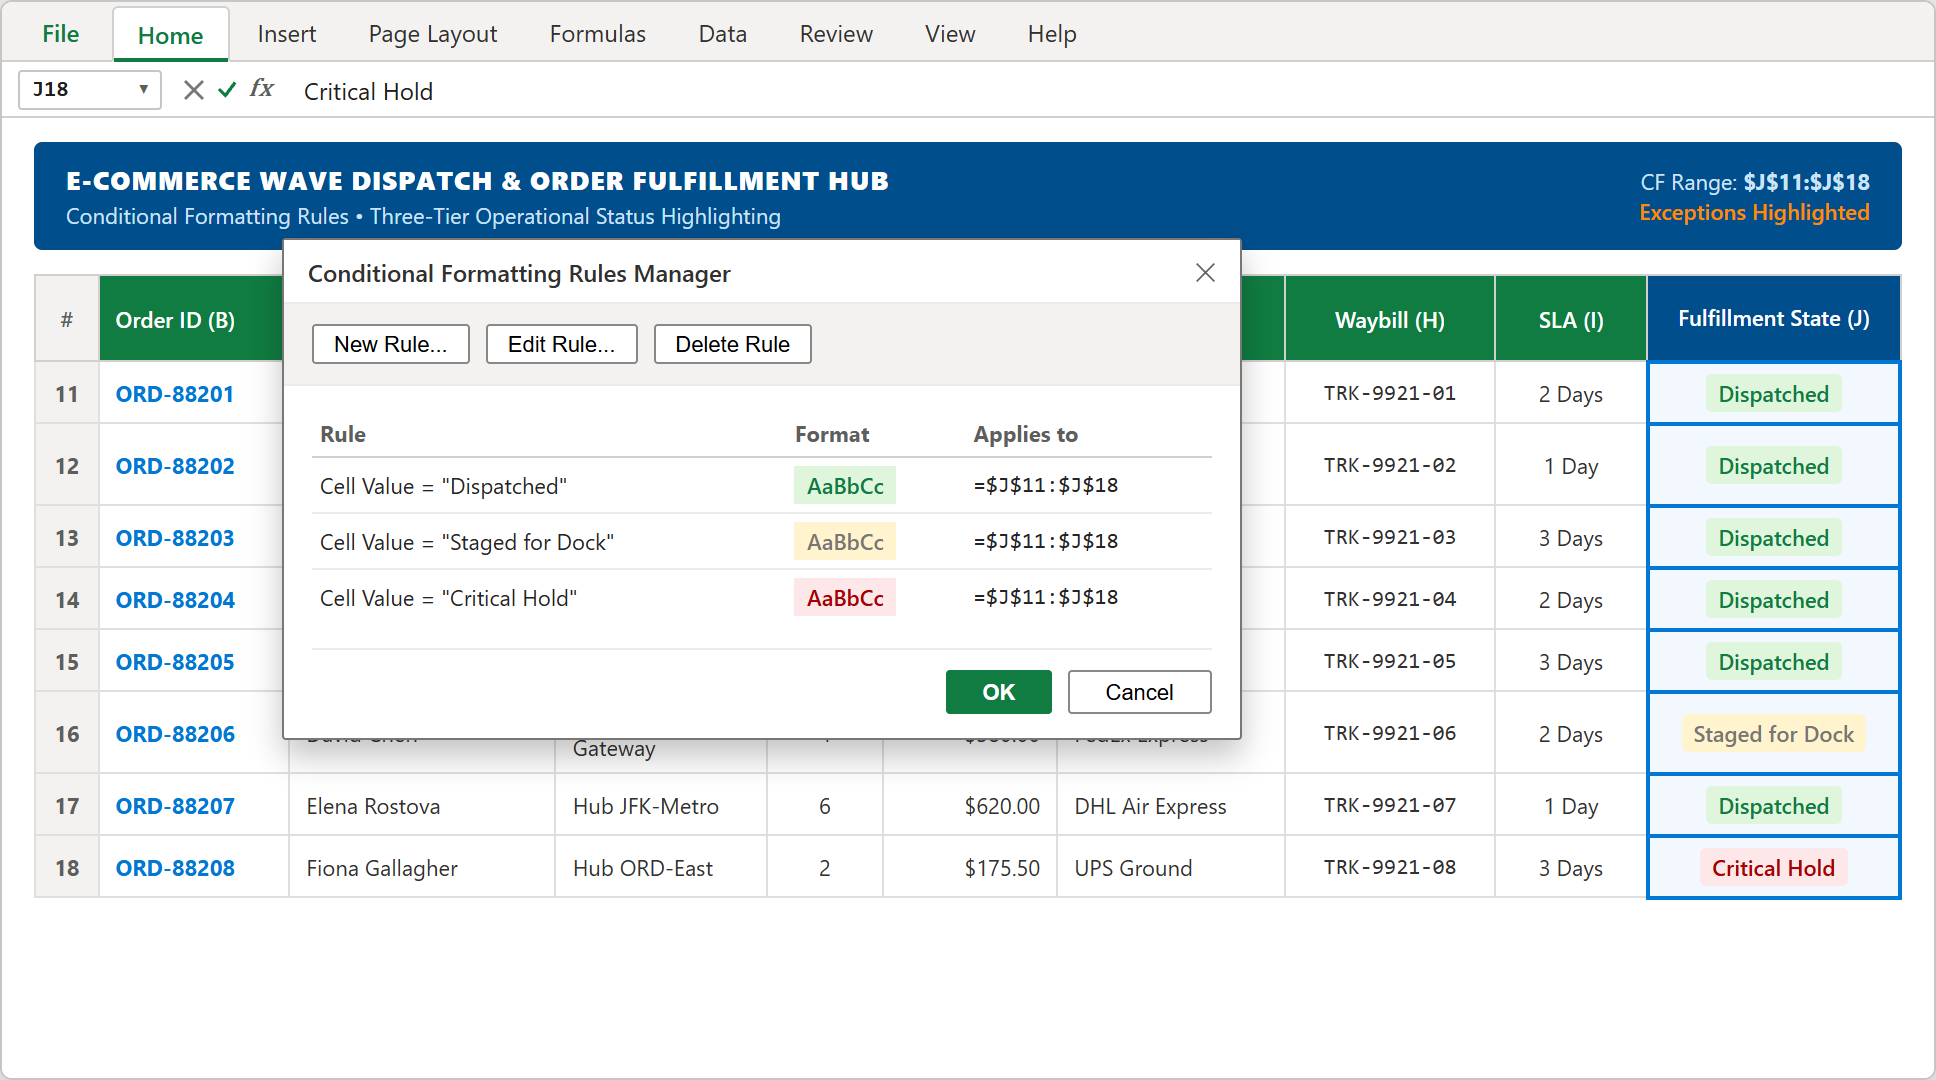
Step 4: The Conditional Formatting Rules Manager displaying the three distinct color logic tiers for cells J11:J18.
5Step 5: Consolidating Manifest Totals & Visualizing Carrier Volume Share
Our final implementation step closes out the consignment manifest and provides visual partner share analytics.
In total row cell E20, tally aggregate packed merchandise items: =SUM(E11:E18), totaling 31 Units. In cell F20, calculate total consignment commercial value: =SUM(F11:F18), totaling $3,021.00. Format cell F20 with double bottom accounting borders to mark batch closure.
To evaluate carrier dependency, select carrier summary aggregates and insert an authentic Excel Doughnut Chart. The resulting breakdown reveals FedEx at 37.5% (3 parcels), DHL Air at 25.0% (2 parcels), UPS Ground at 25.0% (2 parcels), and USPS Priority at 12.5% (1 parcel).
This visualization allows fulfillment directors to balance freight volume, negotiate volume rebates, and avoid over-reliance on a single transport partner.
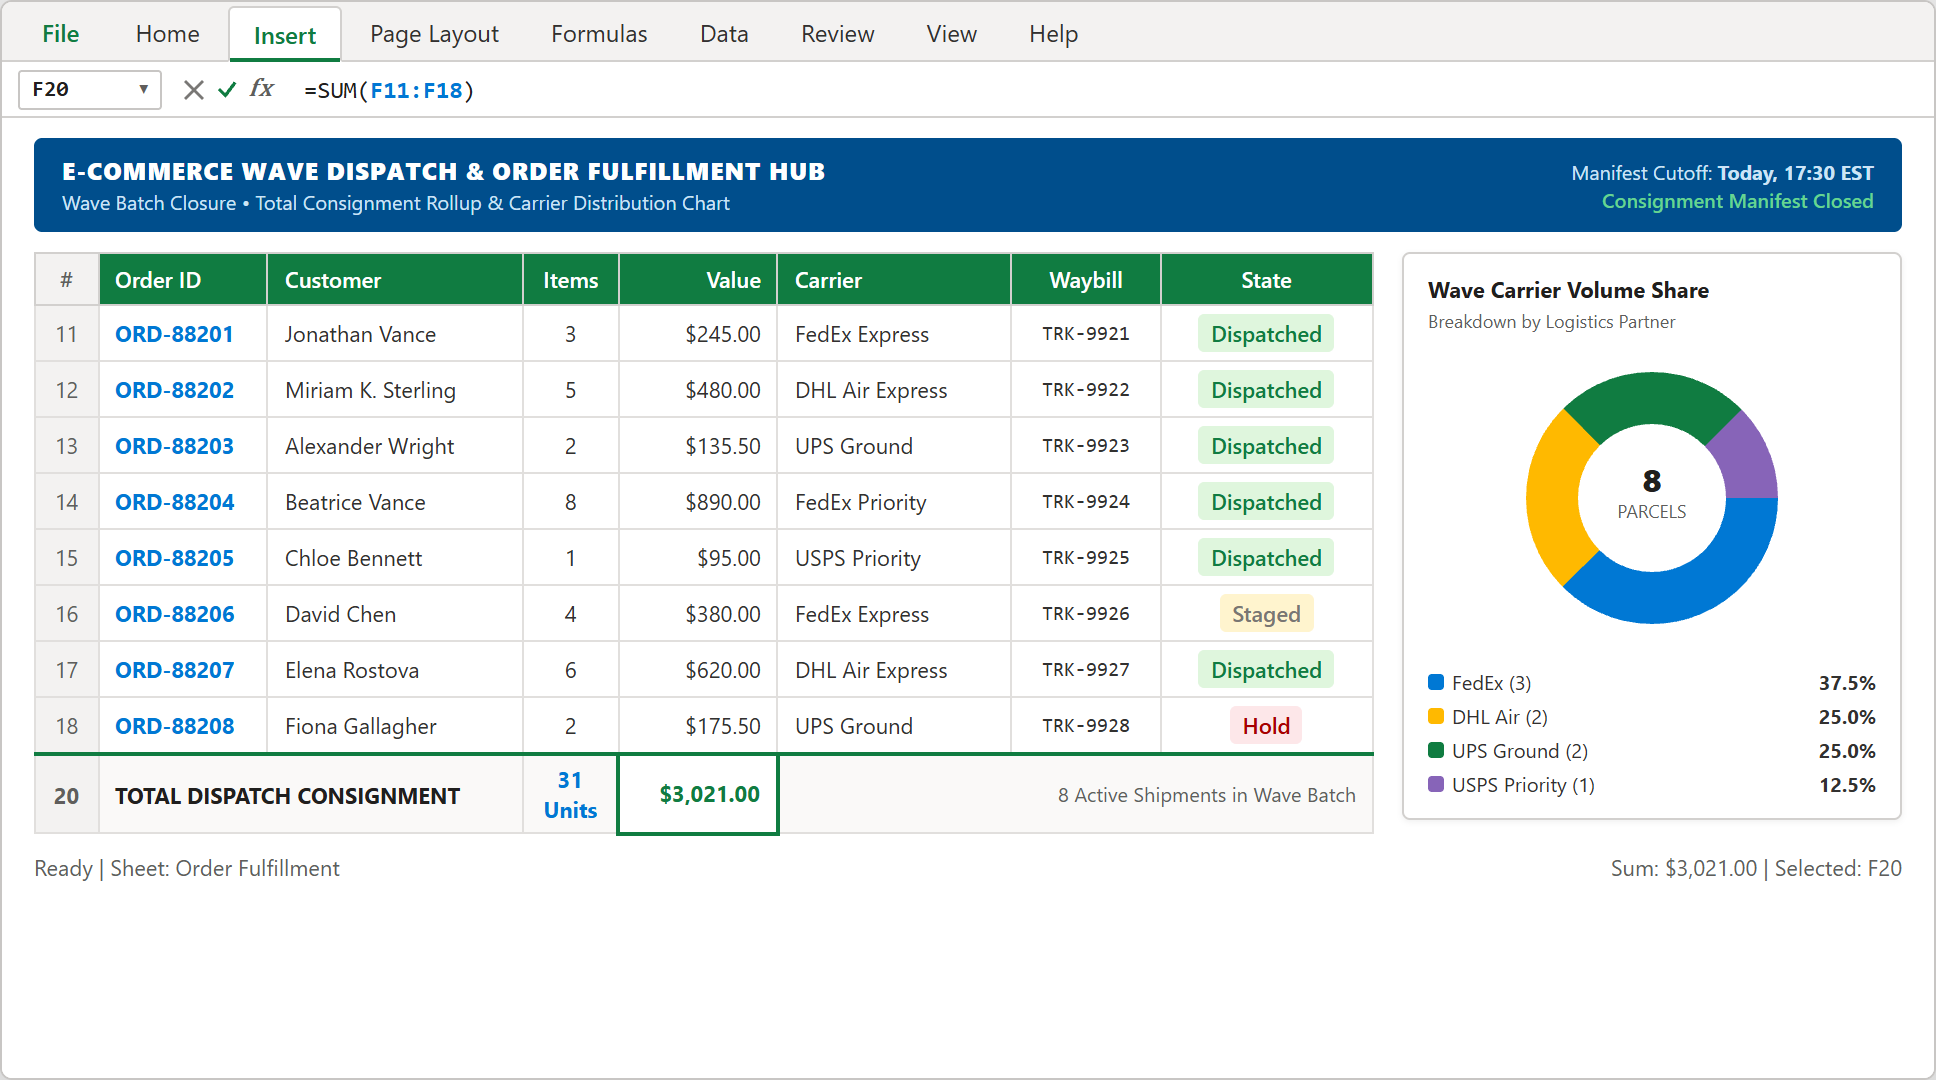
Step 5: Completed wave consignment summary featuring $3,021.00 total cargo value and companion carrier share doughnut chart.
Operational Logistics Playbook: Daily Wave Audits & Cutoff Discipline
An Excel fulfillment tracker is only as valuable as the warehouse discipline supporting it. Implement these four operational protocols to maintain 98%+ on-time dispatch execution across daily shift changes:
1. The T-30 Dock Sweep Rule: All wave picking and packing must conclude 30 minutes before carrier sweep times (17:00 cutoff for a 17:30 sweep). Any parcel remaining in "Staged for Dock" status at T-15 triggers an immediate floor escalation.
2. Critical Hold Quarantine Bench: Parcels marked with "Critical Hold" must physically move to a designated QA quarantine table. Never allow unverified cartons to sit on active pallet wrap lines where they might be accidentally loaded into outbound trailers.
3. Digital Bill of Lading (BOL) Cross-Check: Before freight drivers sign bill-of-lading receipts, warehouse team leads verify that the physical pallet parcel count matches cell B8 (8 parcels) and total manifested item units match cell E20 (31 units).
4. Multi-Carrier Load Balancing: Review the carrier volume share chart weekly. If a single carrier approaches 60%+ volume share, redistribute standard-speed routes to regional alternatives to protect delivery SLAs against localized courier network disruptions.
By integrating these procedural habits with your Microsoft Excel fulfillment tracker, your distribution operation gains the resilience, accuracy, and velocity demanded by modern e-commerce customers.

Spreadsheet educator and web developer passionate about hands-on interactive spreadsheet practice.
Related Practical Exercises
Explore more hands-on spreadsheet models with downloadable practice workbooks.
 Human Resources
Employee Attendance Tracker Excel Template
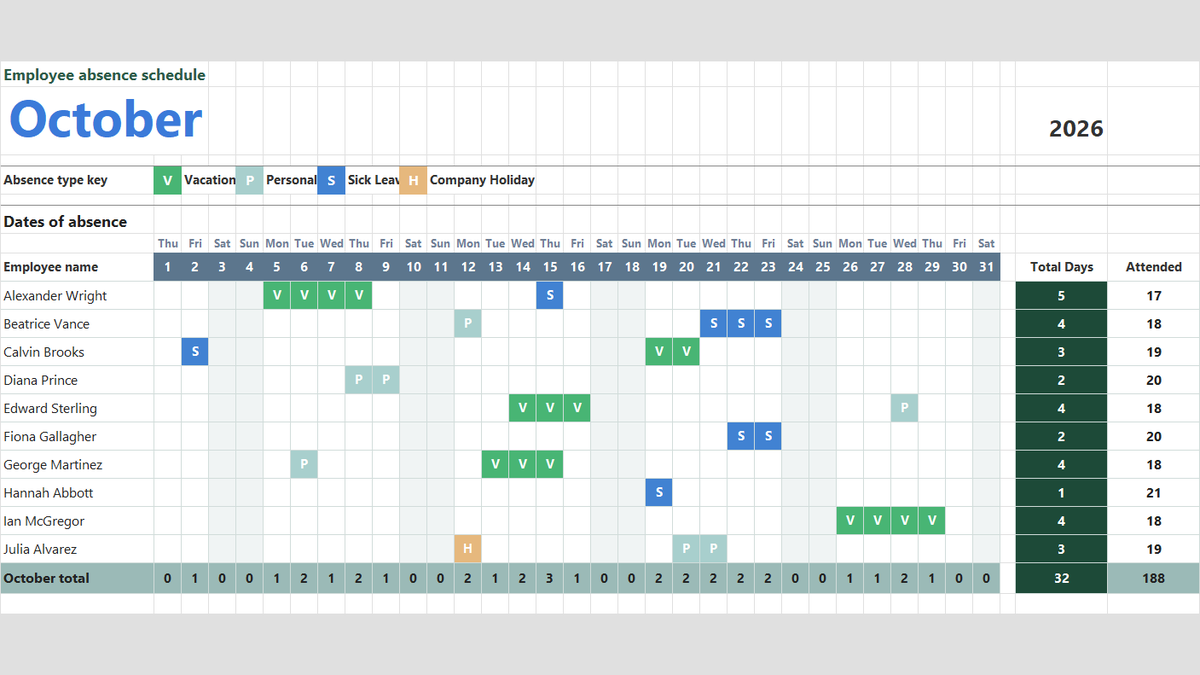
Manage team attendance, vacation days, and sick leave in Microsoft Excel. Build a clean monthly absence schedule featuring dropdown absence keys with Data Validation, automatic color-coded badges via Conditional Formatting, and dynamic attendance totals with COUNTA.
 Human Resources
Employee Payroll Calculator Excel Template
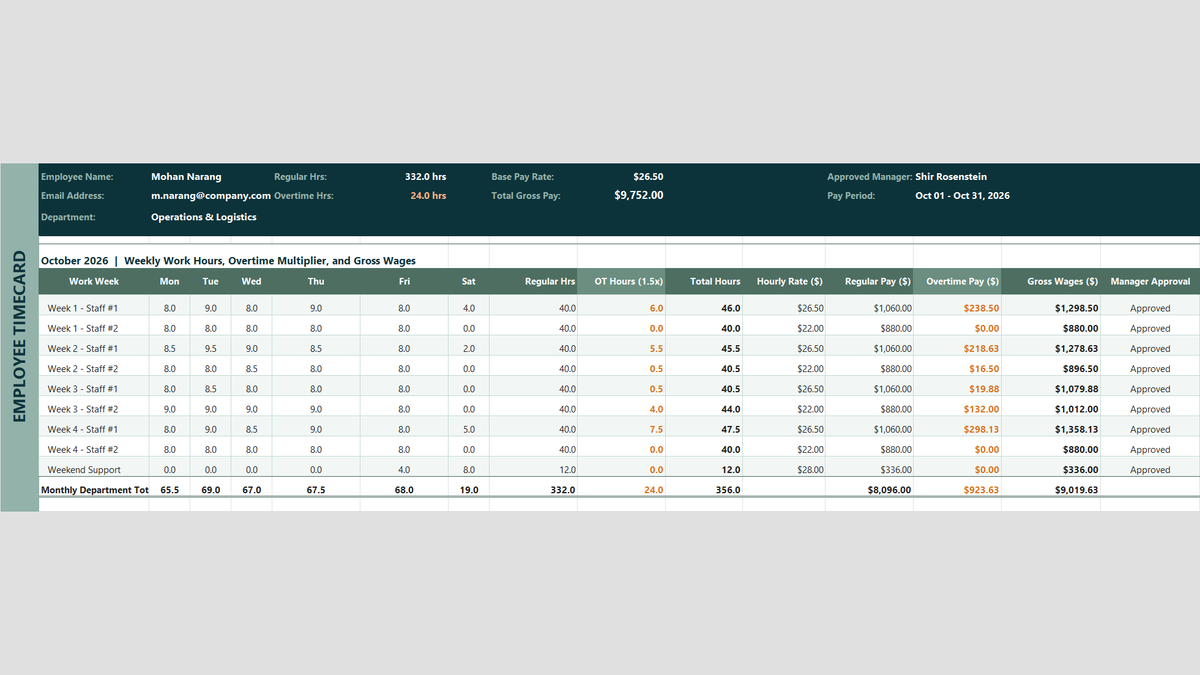
Payroll Friday should not be stressful. Learn how to build an employee payroll calculator in Microsoft Excel that automatically tallies timecards, caps regular hours at 40 with MIN, computes 1.5x overtime with MAX, and locks penny-perfect wages with ROUND.
 Human Resources
Weekly Employee Shift Schedule and Roster Excel Template
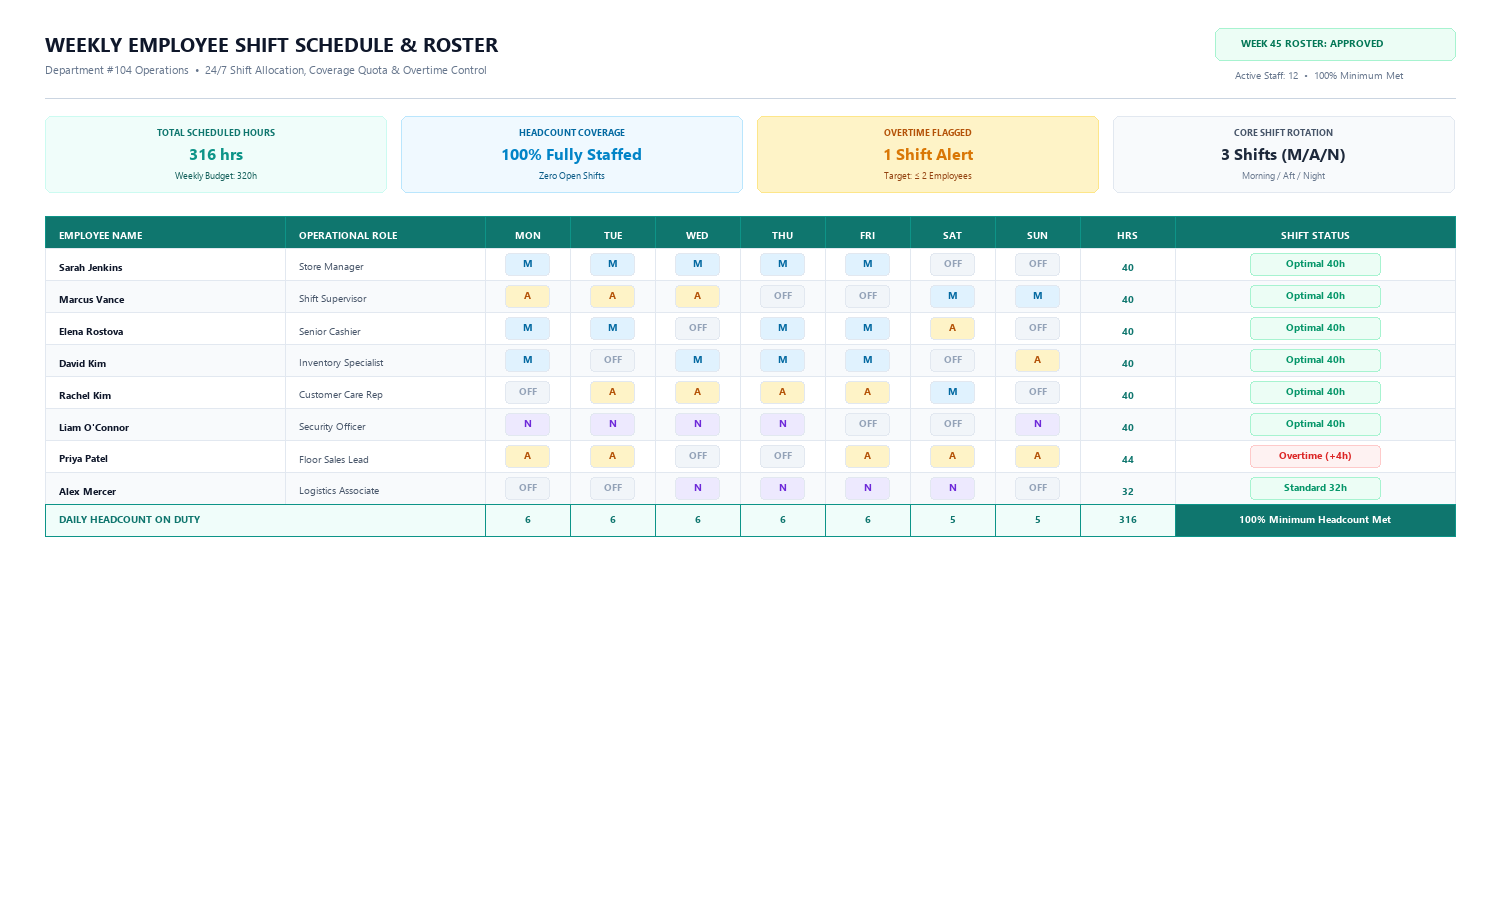
Learn how to build an operational Weekly Employee Shift Schedule & Roster in Microsoft Excel featuring standard shift codes, automated hours calculation with COUNTIF, overtime detection, and daily coverage summaries.
 Productivity
Emergency Fund Planner Excel Template
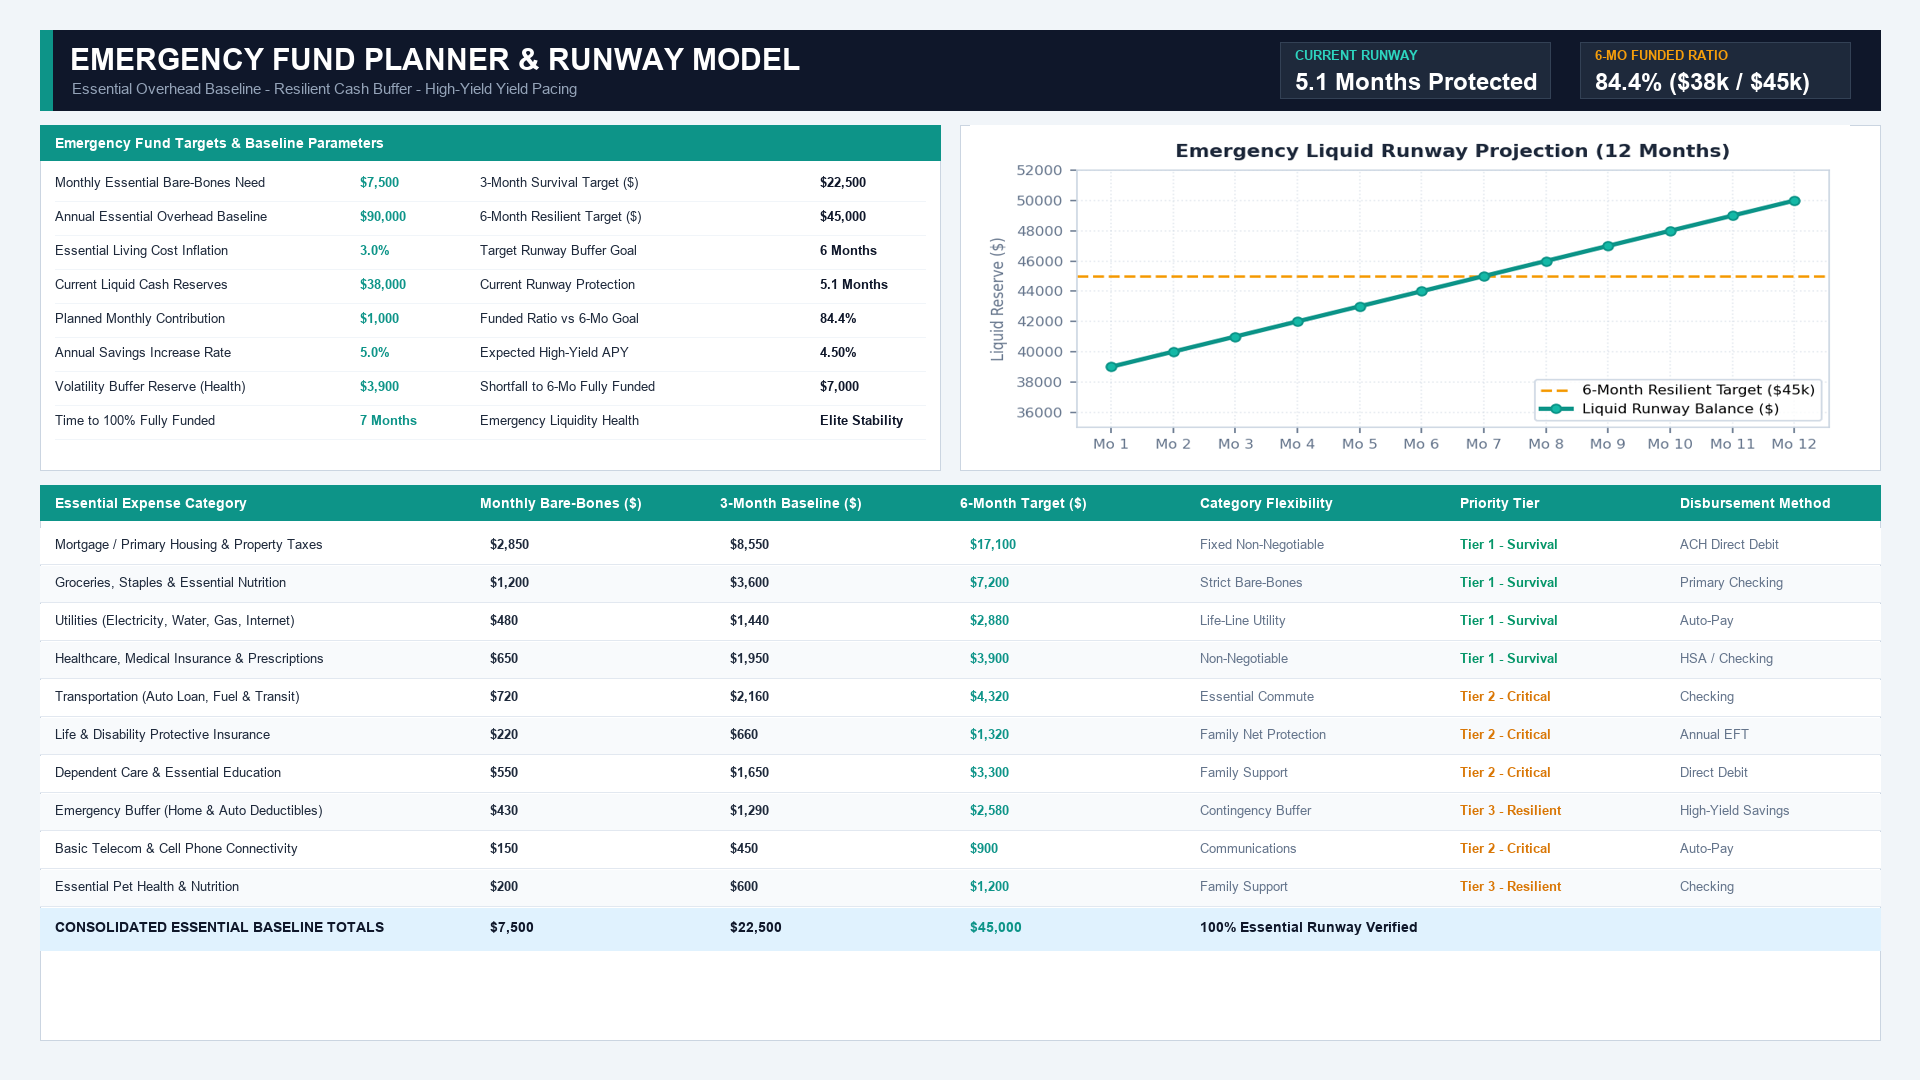
Learn how to build a resilient Emergency Fund Planner in Microsoft Excel featuring bare-bones baseline calculations, 3-month and 6-month runway multipliers, funded ratio tracking, and savings pacing.
 Finance
Fixed-Rate Loan Amortization Schedule Excel Template
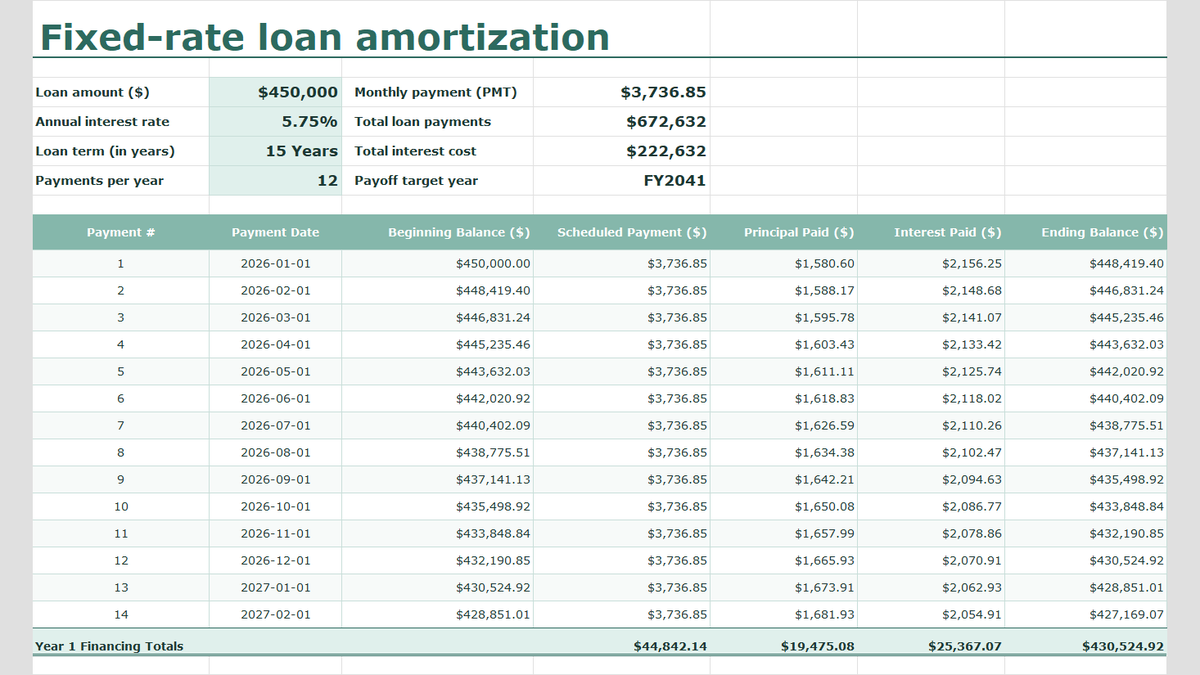
Learn fixed-rate commercial debt structuring in Microsoft Excel. Build a rigorous amortization schedule featuring level debt service calculations with =PMT(), interest and principal bifurcation, dynamic balance rollforwards, accounting ledger formatting, and annual debt covenant rollups.
Discussion
Ask questions, share formula tips, or discuss alternative approaches with fellow spreadsheet builders.
Loading discussion...