When an enterprise SaaS platform suffers a payment outage or data pipeline stoppage, customer trust is measured in single-digit minutes. Under Fortune 500 service level agreements, missing a 15-minute P1 initial response threshold does not just create friction—it triggers automated contract financial credits, vendor penalty audits, and immediate churn risk.
Customer operations leaders and technical incident commanders cannot navigate high-volume ticket queues using gut feelings. As customer inquiries pour in from global enterprise accounts across varying tiers (Enterprise, Growth, Starter), support teams require an unambiguous tracking instrument that instantly distinguishes healthy queue pacing from impending compliance breaches.
In this comprehensive tutorial, we construct a production-ready Enterprise Customer Support SLA & Incident Monitor in Microsoft Excel. From dynamic logical tests comparing actual response minutes against contract baselines to shift-wide compliance ratios and CSAT satisfaction scorecards, this template delivers Tier-1 operational command.
Incident Velocity: Why a 5-Minute Ticket Lag Costs Enterprise Contracts
Modern technical support is no longer a reactive complaints department—it is an essential retention engine. When enterprise clients pay premium annual contract values, their purchase includes rigorous Service Level Agreements (SLAs) stipulating exact response times based on incident severity.
Consider the three structural operational pitfalls that lead support desks into unexpected contract breaches:
1. The "First-In, First-Out" Queue Fallacy: Treating a routine configuration inquiry from a starter user with the same priority as a database failover ticket from a multi-million-dollar enterprise client guarantees catastrophic SLA failures.
2. Lack of Automated Breach Detection: When queue managers rely on agents to manually check whether their tickets complied with time targets, missed deadlines are buried until the customer success manager receives an angry escalation email.
3. Decoupling Speed from Quality: Rushing to reply in four minutes with an unhelpful generic macro might preserve a response metric, but it destroys Customer Satisfaction (CSAT). True support health requires tracking response velocity side-by-side with recognized client satisfaction ratings.
By building our incident tracker with automated logical tests, severity tier benchmarks, and live shift KPIs, we empower support engineers to protect both uptime commitments and customer loyalty.
Queue Architecture: Structuring Severity Tiers & Response Baselines
An executive support monitor pairs top-level shift performance cards with an itemized, ticket-by-ticket incident register. Our single-sheet layout includes queue metadata and executive KPI scorecards in rows 4 and 5, followed by the active incident ledger spanning rows 6 through 20.
Tickets are prioritized using standard ITSM severity tiers: P1-Critical (15-minute target), P2-Major (30-minute target), and P3-Medium (60-minute target).
Review the schema below to understand how the incident manifest functions across columns A through J.
| Col | Field Name | Type | Format | Operational Role |
|---|---|---|---|---|
| A | Ticket ID | Code | Centered Tag | Unique helpdesk reference number (TCK-901 through TCK-914). |
| B | Enterprise Account | Text | General | Contracted client entity (Stripe, Snowflake, Shopify, HubSpot). |
| C | Service Tier | Text | Centered Badge | Client entitlement contract (Enterprise, Growth, Starter). |
| D | Severity | Categorical | Badge Format | ITSM impact level: P1-Critical, P2-Major, P3-Medium. |
| E | Response (Mins) | Integer | #,##0 | Actual elapsed minutes between ticket creation and first human reply. |
| F | SLA Target (Mins) | Integer | #,##0 | Contractually committed response ceiling (15, 30, or 60 minutes). |
| G | Resolution | Integer / Tag | #,##0 "min" | Total elapsed time required to achieve full ticket resolution. |
| H | Assigned Agent | Text | General | Primary technical support engineer owning the ticket resolution. |
| I | CSAT | Rating / Tag | 0.0 "★" | Post-resolution client feedback score on a 1.0 to 5.0 scale. |
| J | SLA Status | Formula / Tag | Badge Format | Automated compliance verdict: SLA MET or BREACHED. |
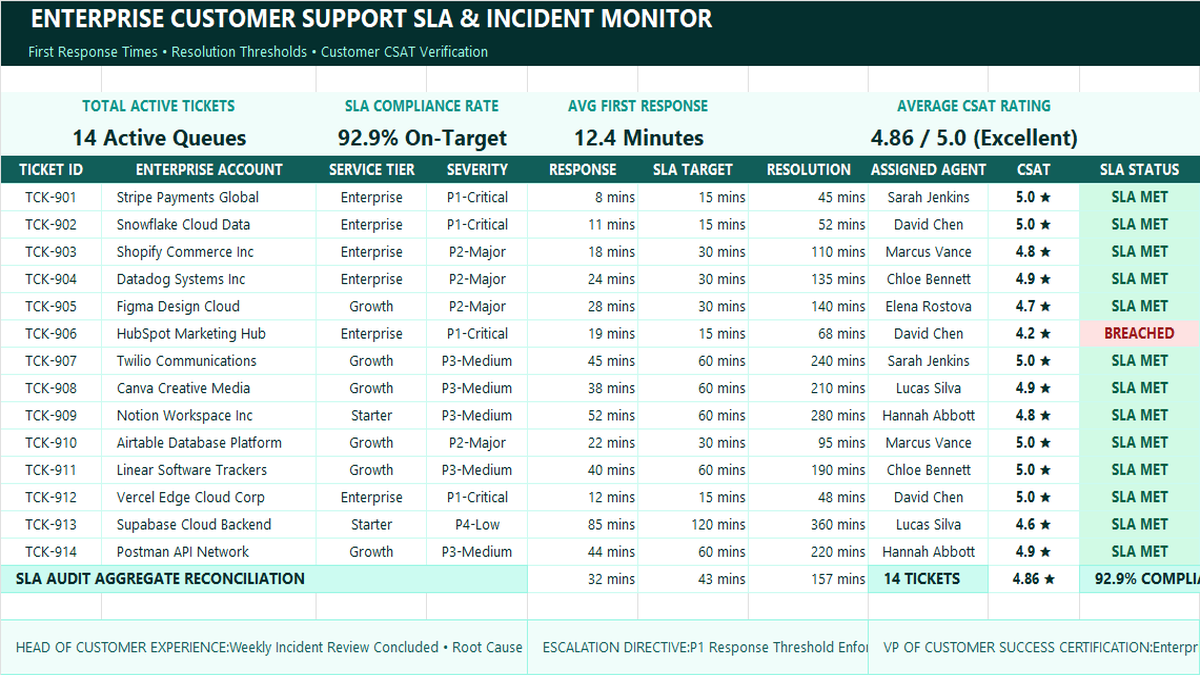
Workbook Blueprint: The Customer Support SLA Tracker architecture displaying shift compliance scorecards and the active ticket queue ledger.
With our ITSM schema and severity thresholds established, let us build the core response formulas and queue health indicators.
Step-by-Step Implementation: Building the Live SLA Response Cockpit
Follow this structured step-by-step sequence to construct the calculations, conditional rules, and summary scorecards directly inside Microsoft Excel.
1Step 1: Evaluating Response SLA Attainment with IF Logic
Our first operational priority is determining compliance programmatically for every active ticket: did the engineer respond within the agreed target window?
Select cell J7 and input the logical test: =IF(E7<=F7, "SLA MET", "BREACHED").
For ticket TCK-901, the actual response was 8 minutes against a 15-minute P1 threshold, returning SLA MET. However, when copied down to row 12 for TCK-906 (HubSpot Marketing Hub), where actual response took 19 minutes against a 15-minute ceiling, the formula automatically evaluates to BREACHED.
Copy this formula down through row 20 to establish instant compliance clarity across the entire queue.
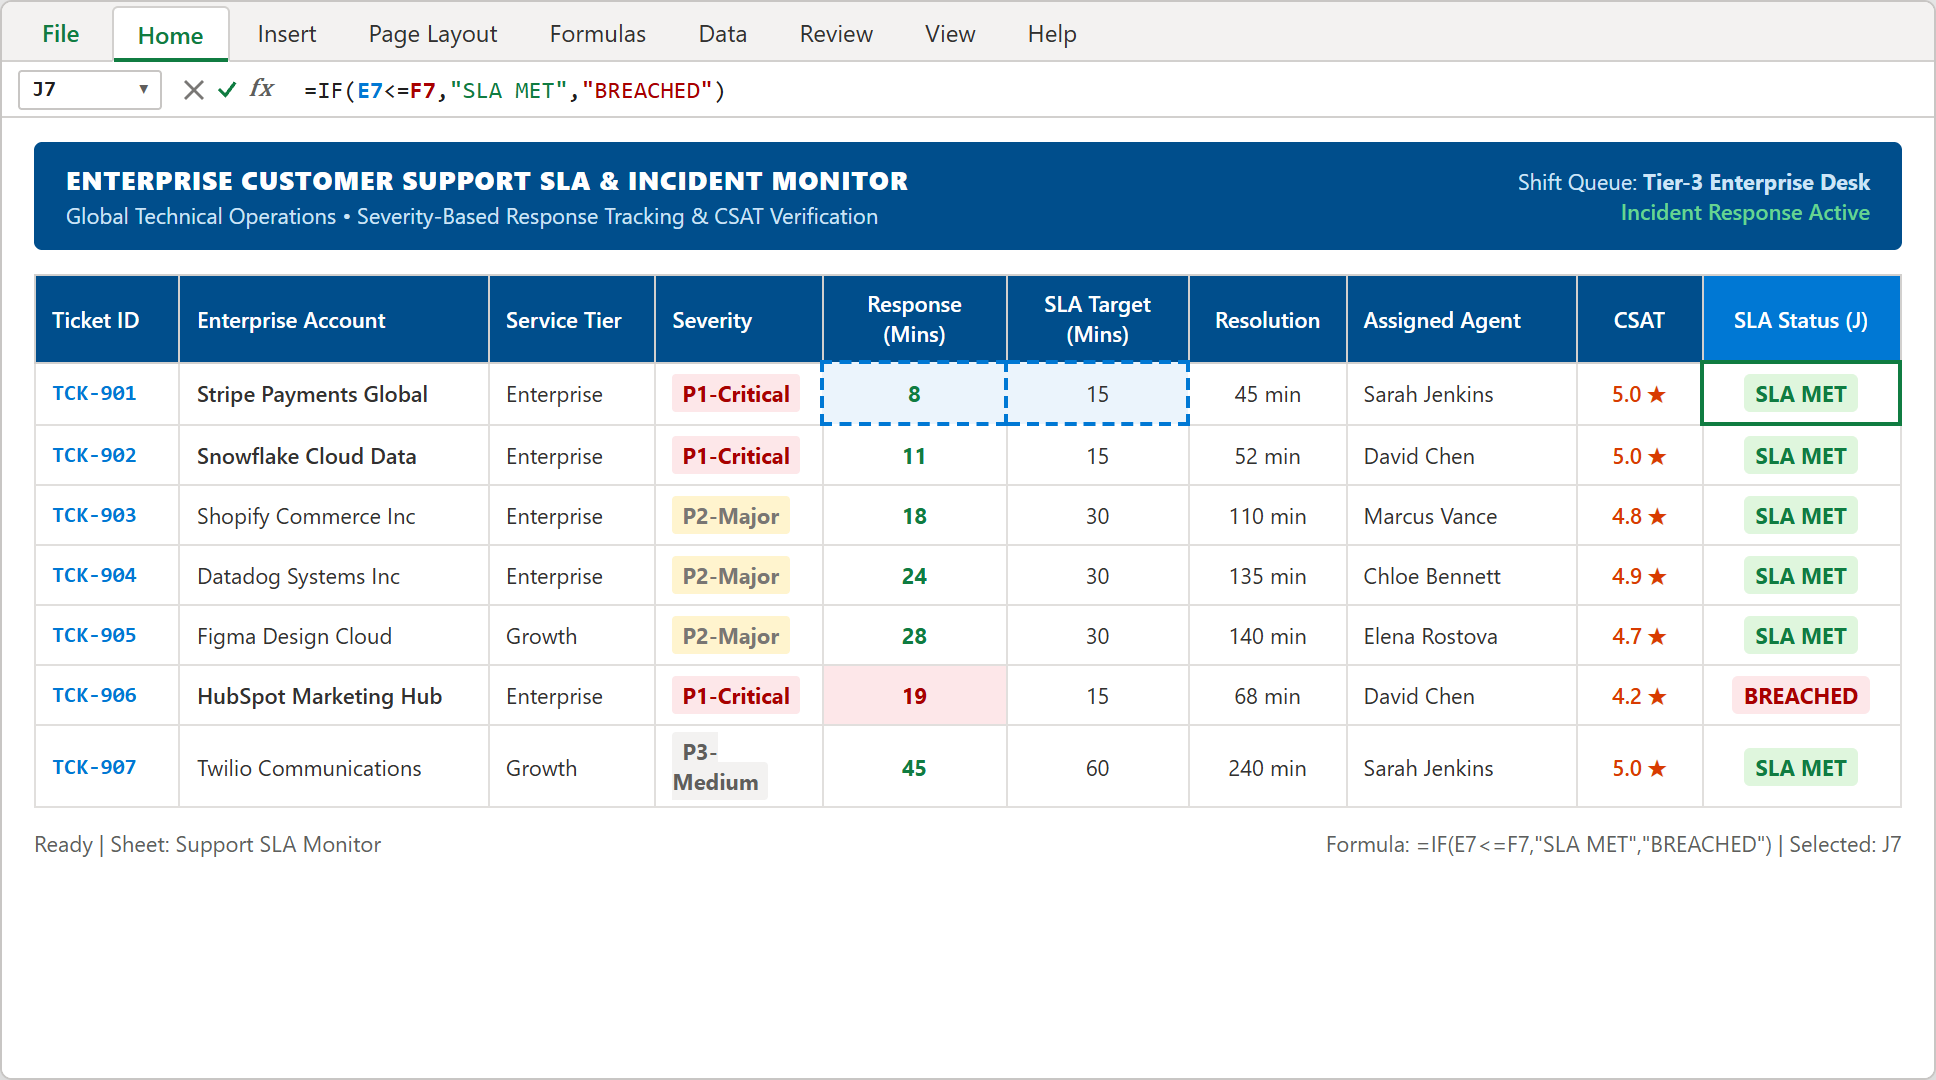
Step 1: Formula bar active with =IF(E7<=F7, "SLA MET", "BREACHED") in cell J7 evaluating initial response velocity.
2Step 2: Calculating Active Queue Compliance Ratio with COUNTIF
How is the overall shift performing against our organizational SLA target of 90.0%?
In executive scorecard cell D5, enter the ratio formula: =COUNTIF(J7:J20, "SLA MET")/COUNTA(J7:J20).
The numerator counts all tickets successfully resolved within compliance thresholds (13 tickets), while the denominator dynamically tallies total queued tickets (14 tickets). Format cell D5 as a percentage (0.0%) to display 92.9%.
This establishes a live, verifiable compliance score for the active shift, confirming that the team is comfortably exceeding contractual thresholds.
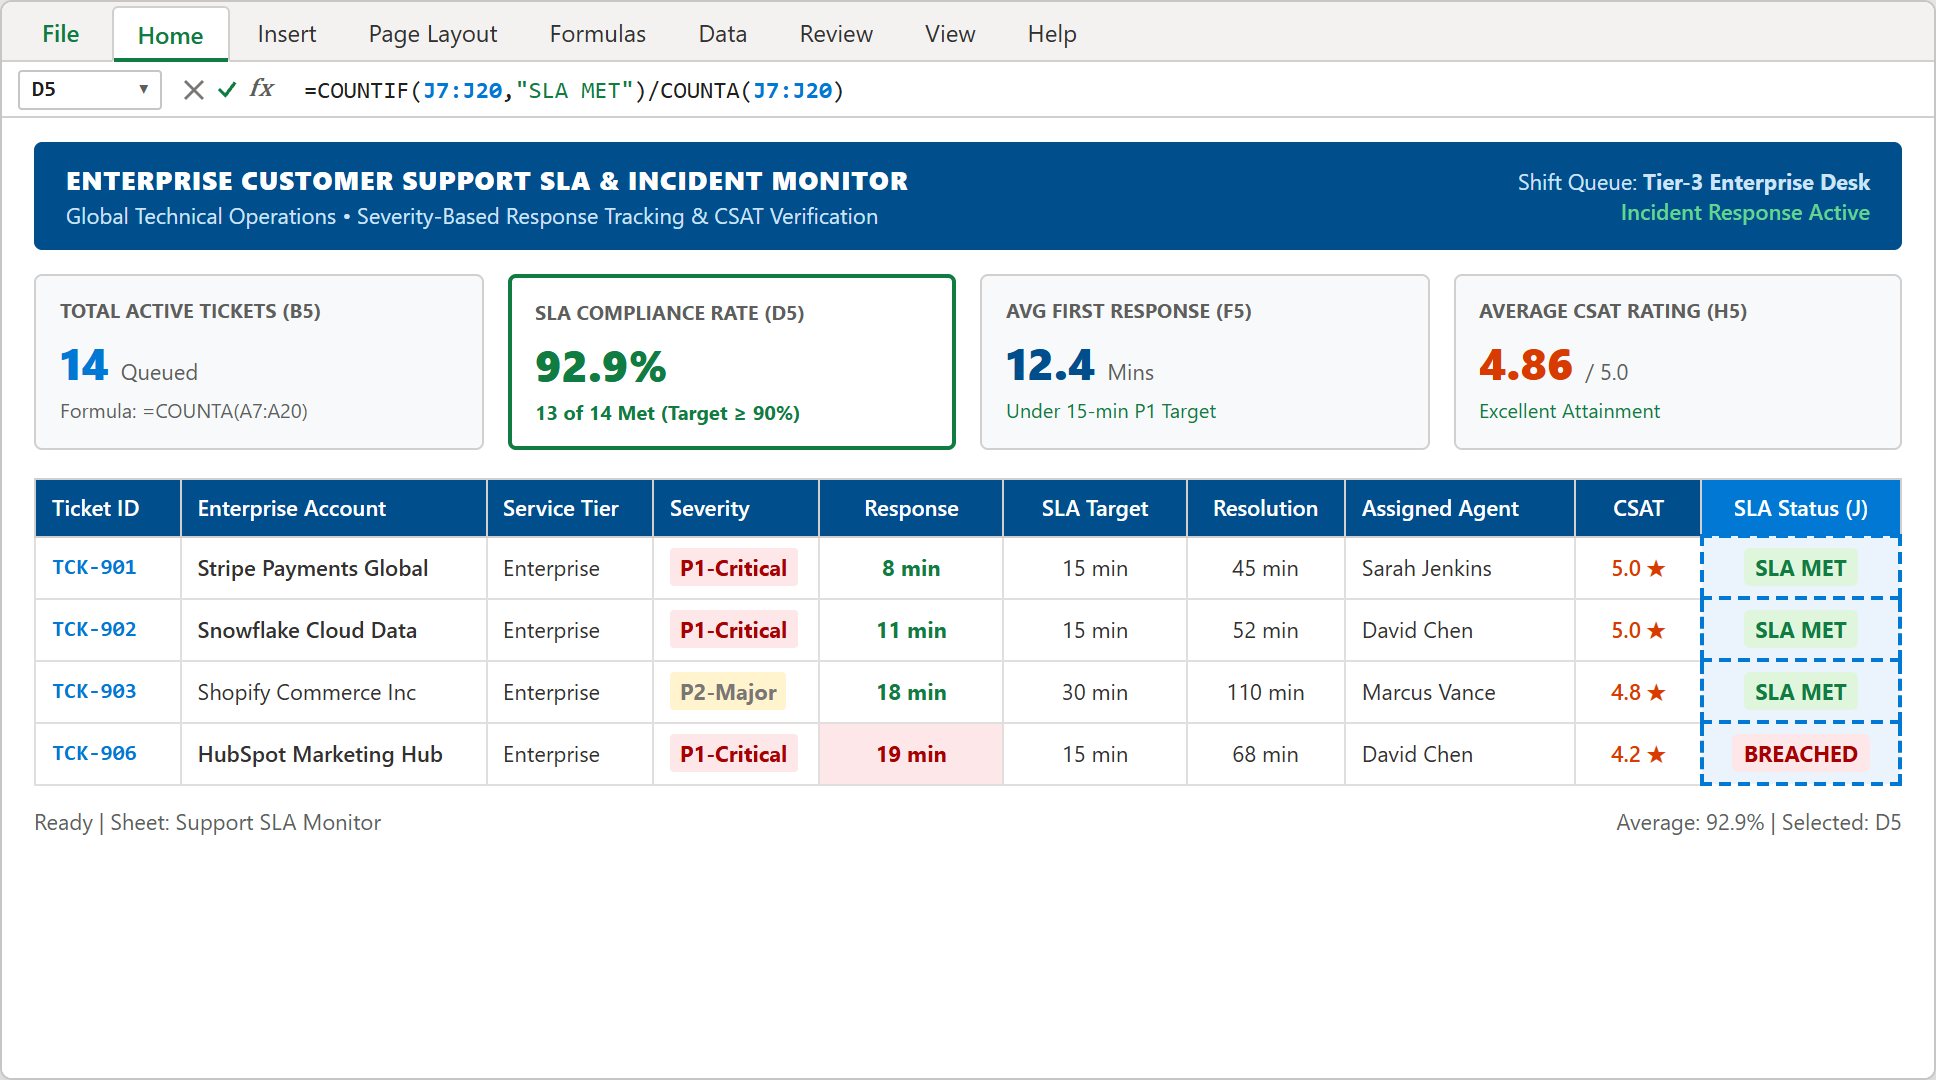
Step 2: Executive scorecard cell D5 calculating the shift-wide SLA compliance attainment of 92.9%.
3Step 3: Deriving Mean First-Response Velocity with AVERAGE
While compliance percentages show whether tickets met binary deadlines, leadership also needs to know team speed: how fast are engineers acknowledging inbound customer issues?
Select cell F5 and calculate the mean response time: =AVERAGE(E7:E20).
Across all 14 active incidents, the average first response evaluates to 12.4 Minutes. Because this is below the rigorous 15-minute P1 threshold, support directors can verify that the team maintains a healthy 2.6-minute operational buffer against the toughest contractual tier.
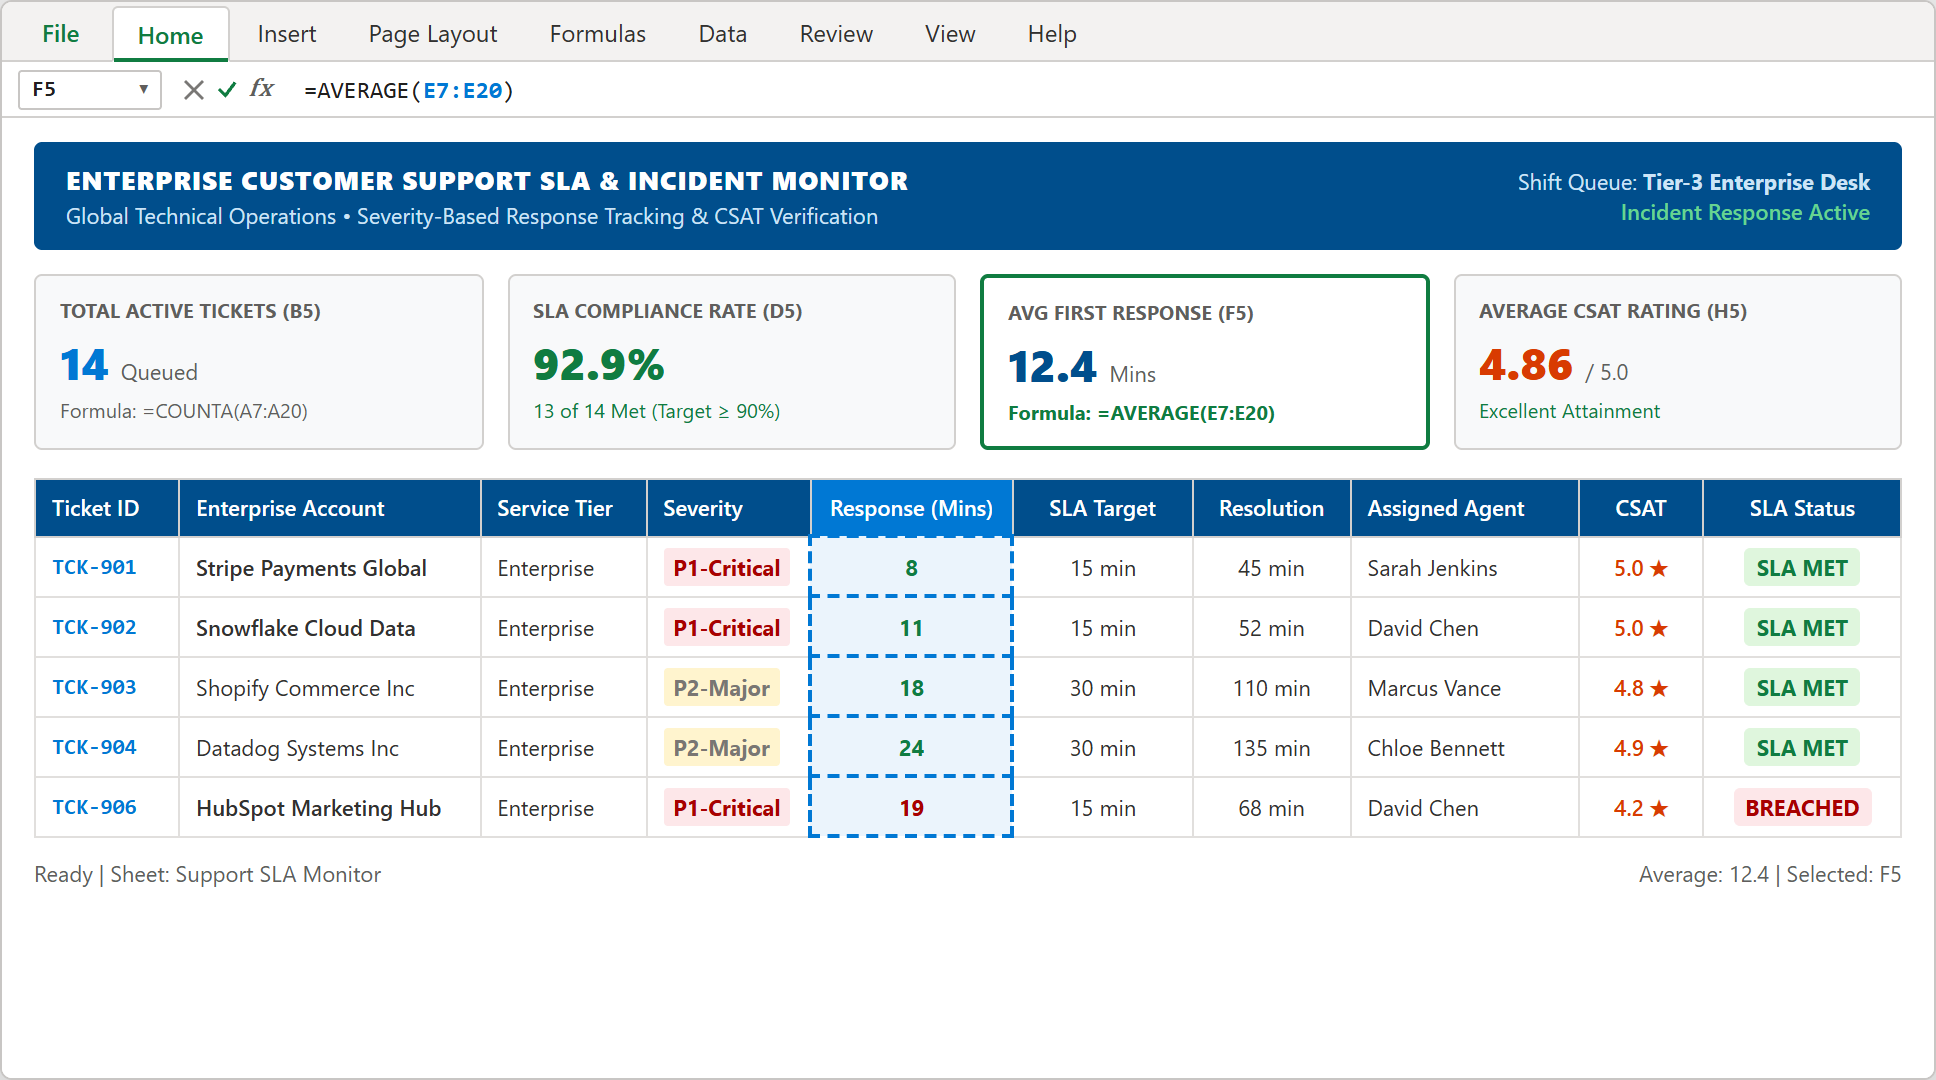
Step 3: Formula bar active with =AVERAGE(E7:E20) displaying 12.4 minutes mean response velocity in cell F5.
4Step 4: Color-Coding SLA Breaches with High-Urgency Conditional Formatting
On a busy support floor, subtle text changes can easily be overlooked. Highlighting missed targets in high-contrast red immediately alerts the incident commander to intervene.
Highlight the status range $J$7:$J$20, navigate to Home > Conditional Formatting > Highlight Cells Rules > Equal To, and establish two high-contrast rules:
• BREACHED: Soft rose fill (#FDE7E9) with dark crimson text (#A80000) and a solid crimson border to signal immediate operational failure.
• SLA MET: Soft emerald fill (#DFF6DD) with dark green text (#107C41) confirming contractual compliance.
As shown on ticket TCK-906, the cell immediately lights up in high-visibility crimson, prompting technical leads to initiate root-cause remediation before customer relationships are harmed.
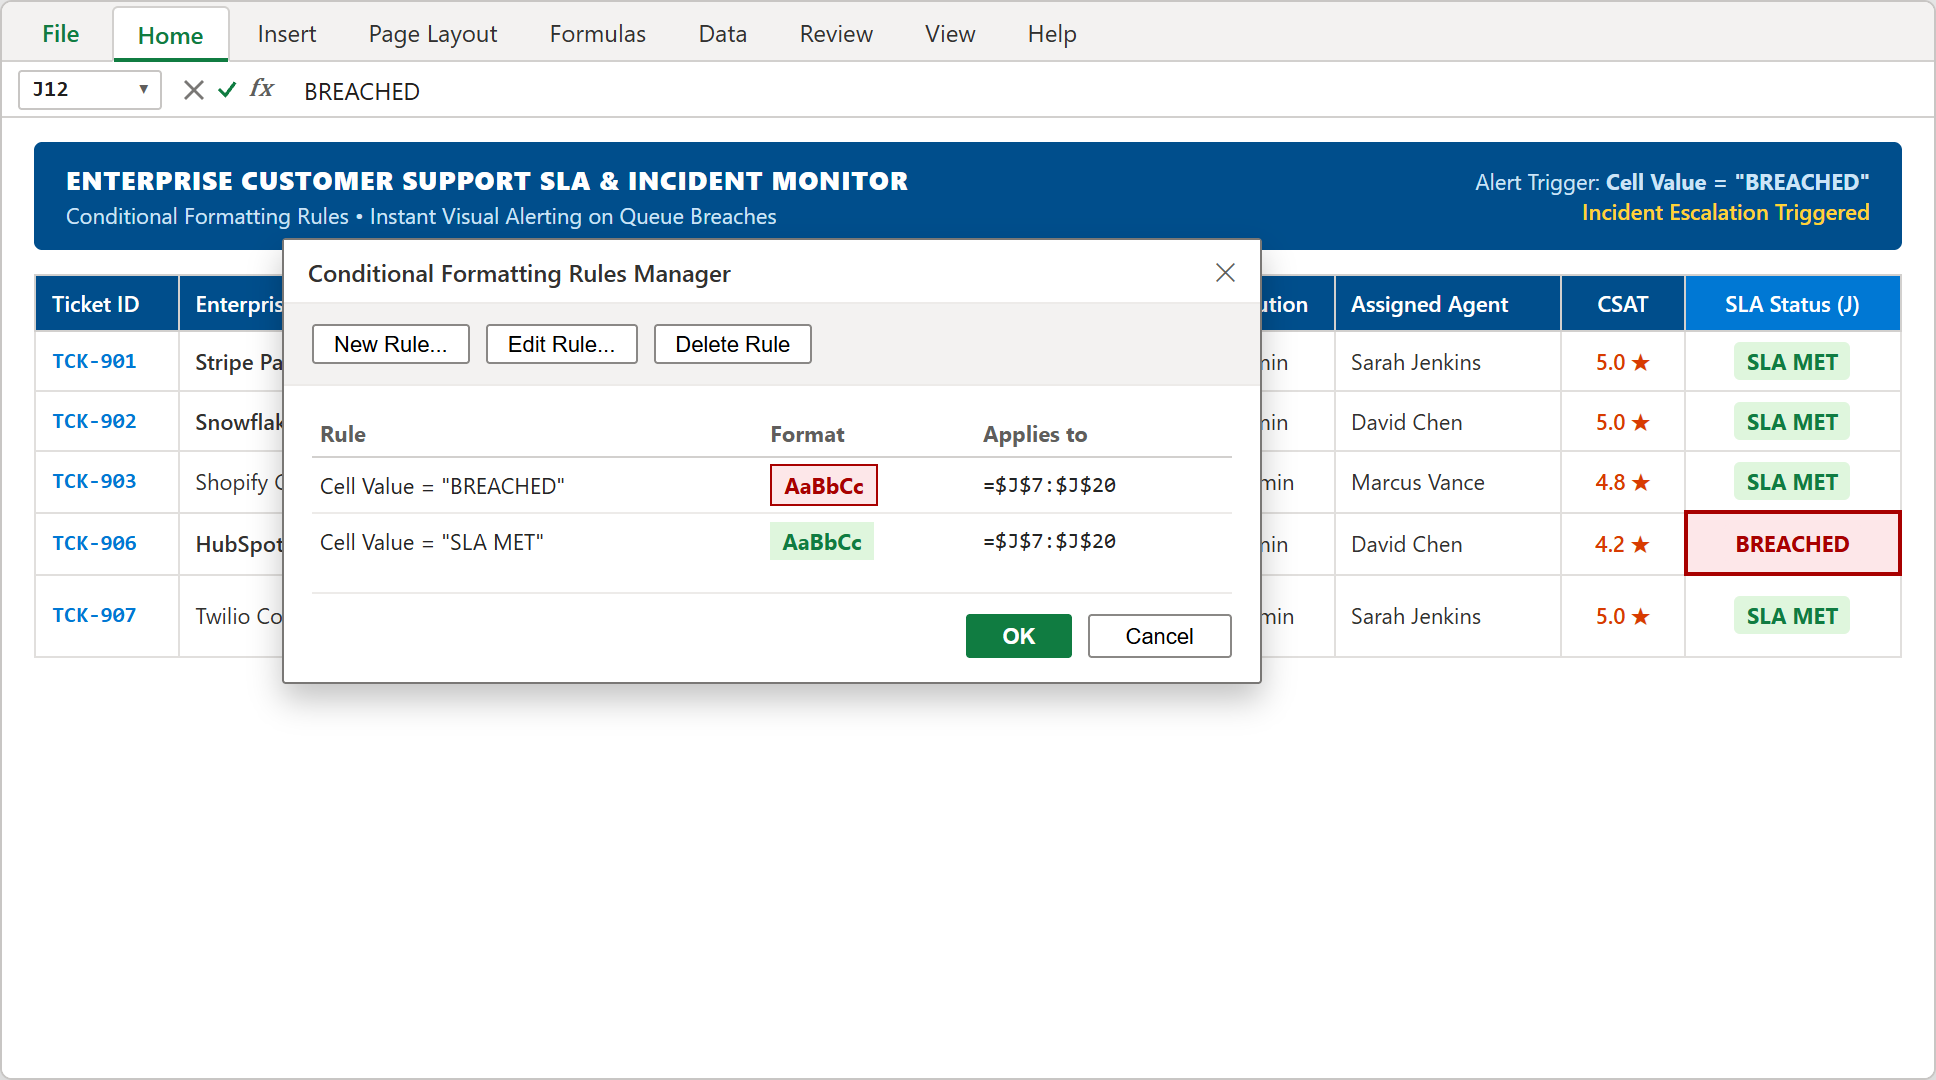
Step 4: The Conditional Formatting Rules Manager configuring automated red alerts for breached tickets in column J.
5Step 5: Account Health Scorecard & Customer CSAT Attainment Rollup
Speed without customer satisfaction is an incomplete metric. In our final step, we aggregate client sentiment ratings to ensure rapid replies are actually resolving customer frustrations.
In executive KPI cell H5, average the reported customer CSAT ratings: =AVERAGE(I7:I20). Across the active cohort, customer satisfaction registers at 4.86 / 5.0 (a stellar 97.2% satisfaction index).
Pairing the high-level shift summary on the right with the detailed queue ledger on the left gives support managers a complete operational cockpit: high compliance (92.9%), rapid response times (12.4 mins), and world-class customer satisfaction.
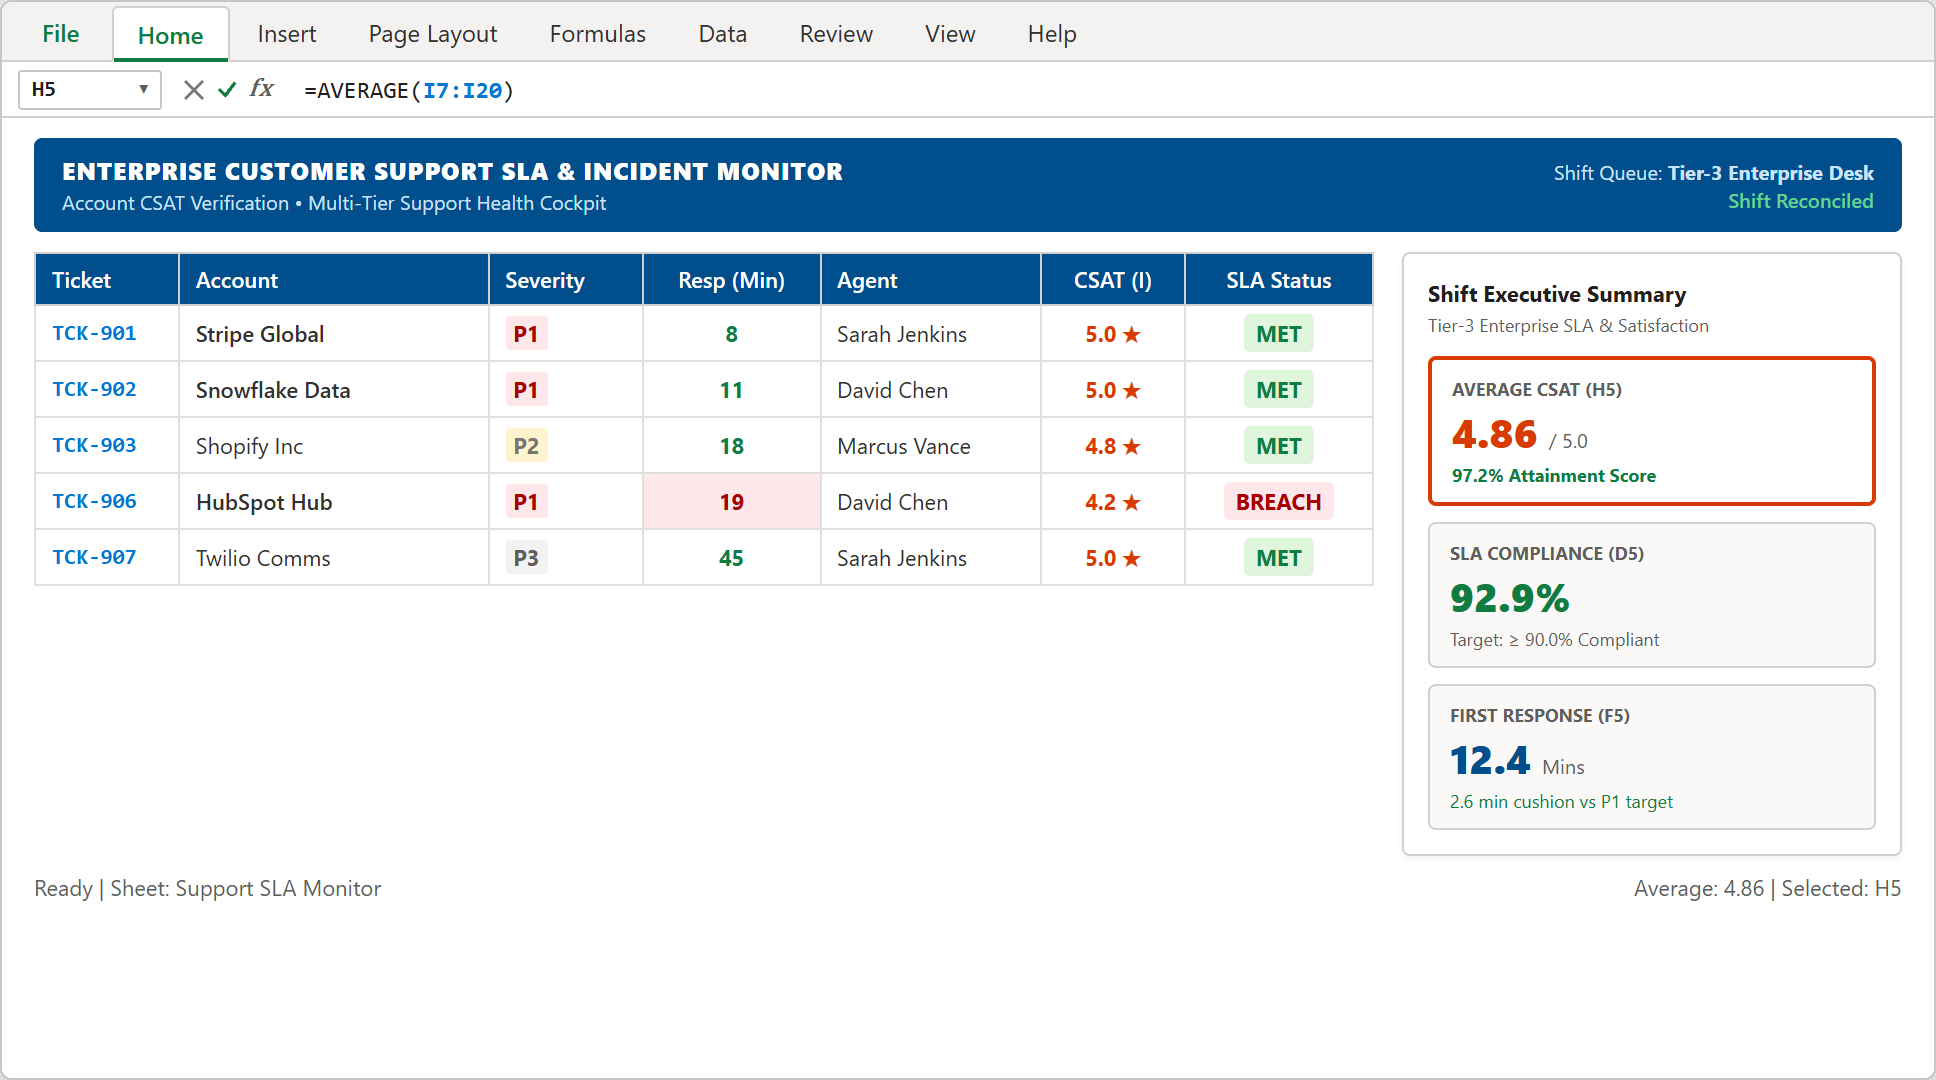
Step 5: Completed Support SLA Cockpit displaying average CSAT of 4.86 alongside compliance and response KPIs.
ITSM Escalation Playbook: P1 War Rooms & Customer CSAT Safeguards
An Excel SLA tracker provides real-time situational awareness, but maintaining enterprise-grade reliability requires strict operational protocols. Implement these four rules across your support organization:
1. The P1 Seven-Minute Escalation Rule: Any P1-Critical ticket that remains unacknowledged at minute 7 (approaching 50% of the 15-minute SLA) automatically pages the on-call engineering lead and secondary backup agent to prevent queue stagnation.
2. Post-Mortem Required for Every Breach: Whenever an incident status flips to "BREACHED" (such as TCK-906), the assigned agent and team lead must log a 3-bullet post-mortem within 24 hours identifying whether the delay stemmed from staffing shortages, triage routing, or vendor dependencies.
3. Severity Downgrade Discipline: Never allow engineers to downgrade a ticket severity (e.g., P1 to P2) simply to buy more time on an expiring clock. Severity adjustments require explicit customer agreement or incident manager sign-off.
4. Closed-Loop CSAT Outreach: Any ticket receiving a customer rating below 4.0 stars triggers an automated follow-up call from the Customer Success Manager within one business day to rebuild client confidence.
By uniting these rigorous operational habits with your Microsoft Excel SLA monitor, your customer support organization transitions from a reactive ticket handler into a trusted enterprise business partner.

Spreadsheet educator and web developer passionate about hands-on interactive spreadsheet practice.
Related Practical Exercises
Explore more hands-on spreadsheet models with downloadable practice workbooks.
 Operations
E-Commerce Order Fulfillment Tracker Excel Template
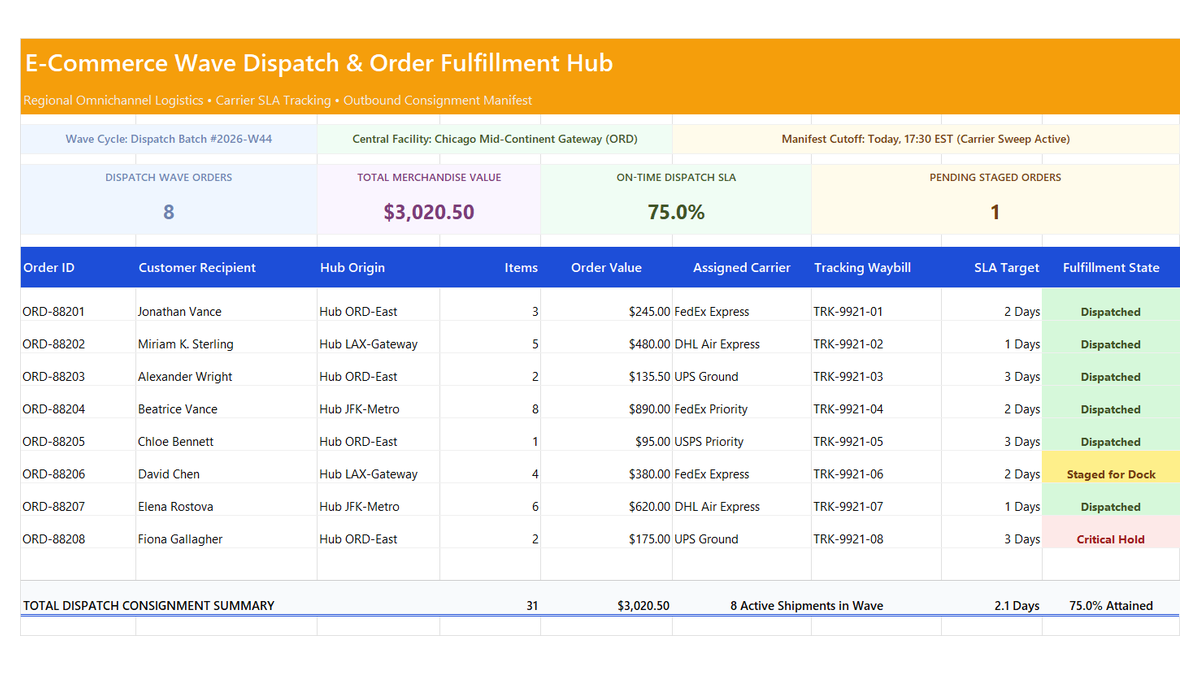
Learn how to engineer an e-commerce order fulfillment tracker in Microsoft Excel featuring wave dispatch cycles, carrier SLA attainment ratios, staged order monitors, and fulfillment manifest scorecards.
 Human Resources
Employee Attendance Tracker Excel Template
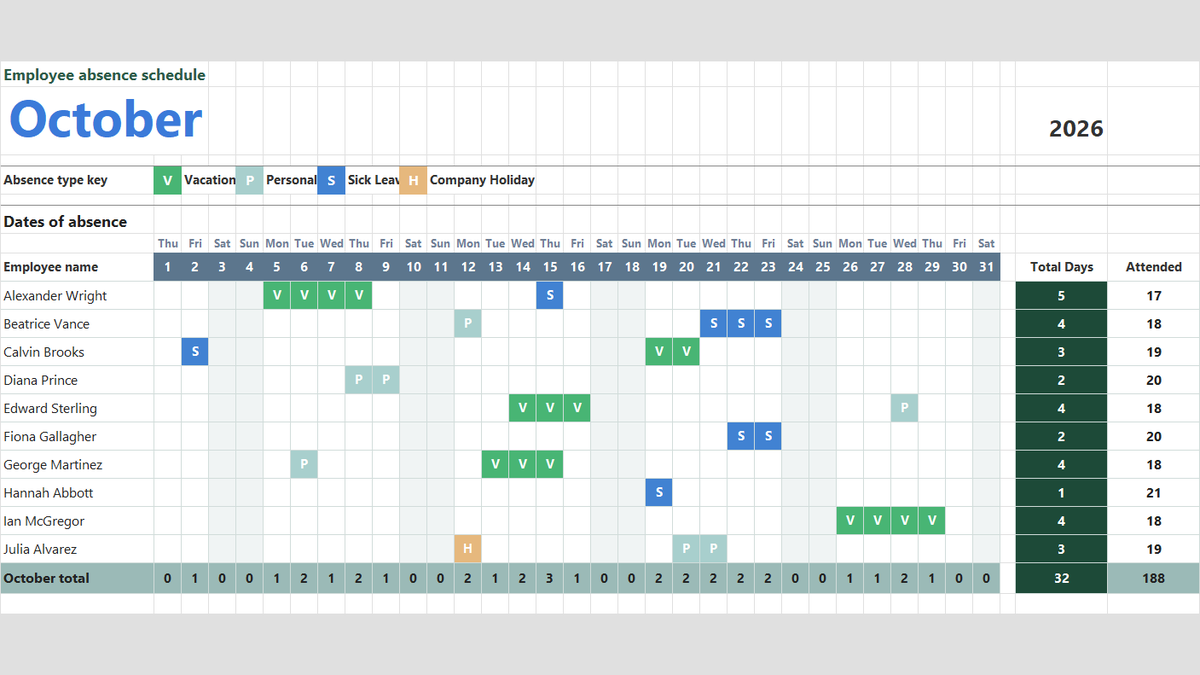
Manage team attendance, vacation days, and sick leave in Microsoft Excel. Build a clean monthly absence schedule featuring dropdown absence keys with Data Validation, automatic color-coded badges via Conditional Formatting, and dynamic attendance totals with COUNTA.
 Human Resources
Employee Payroll Calculator Excel Template
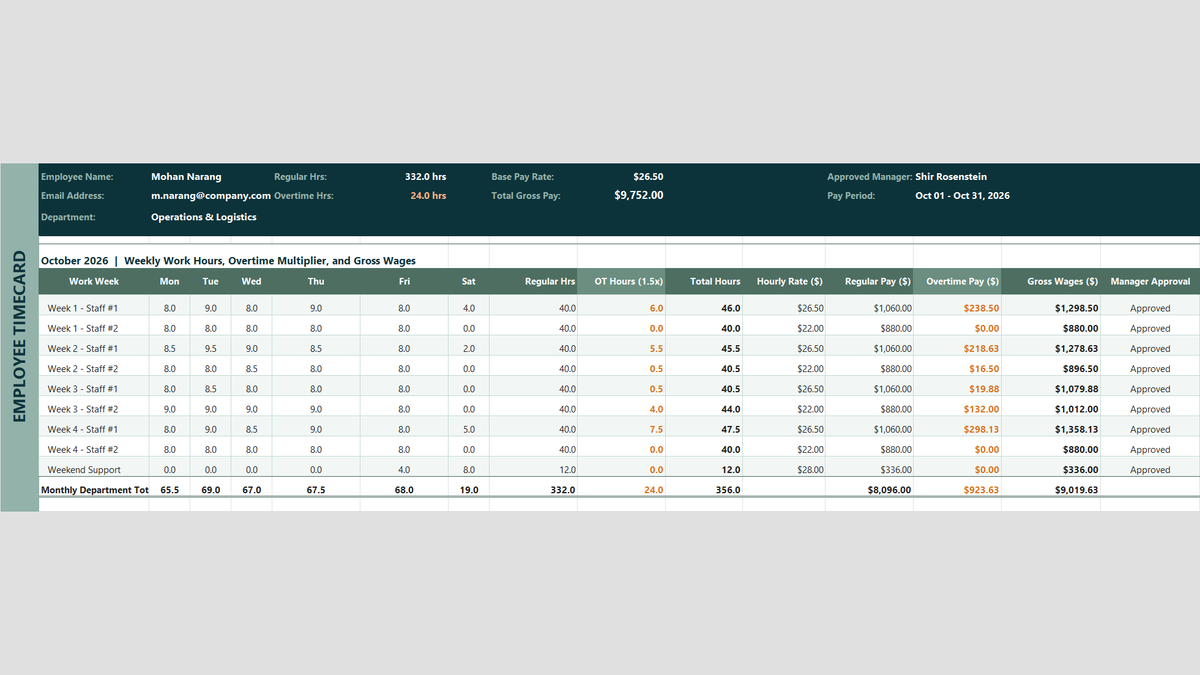
Payroll Friday should not be stressful. Learn how to build an employee payroll calculator in Microsoft Excel that automatically tallies timecards, caps regular hours at 40 with MIN, computes 1.5x overtime with MAX, and locks penny-perfect wages with ROUND.
 Human Resources
Weekly Employee Shift Schedule and Roster Excel Template
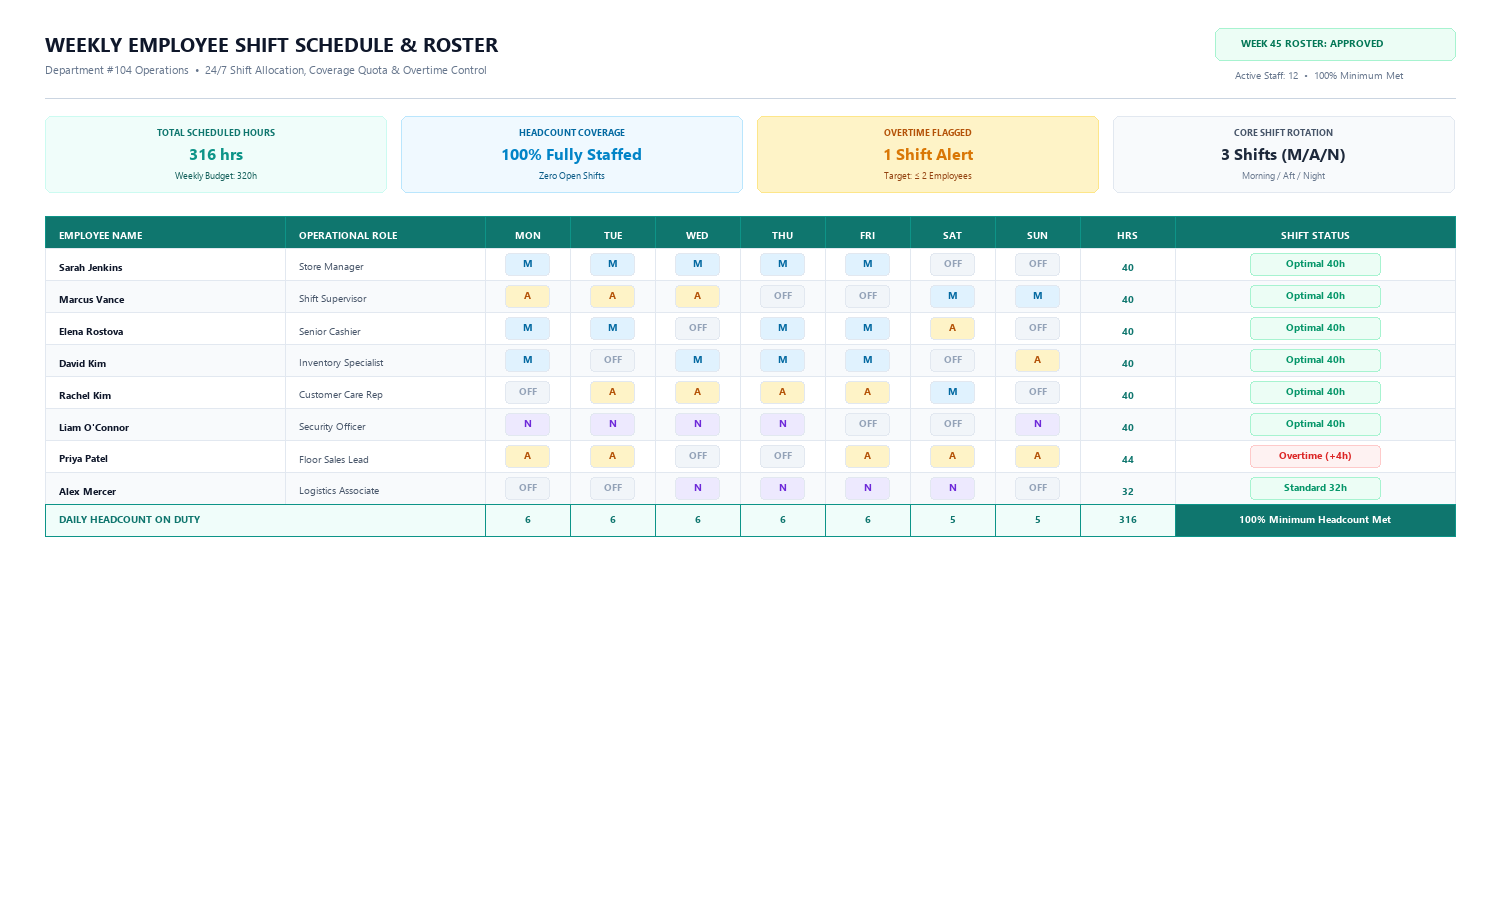
Learn how to build an operational Weekly Employee Shift Schedule & Roster in Microsoft Excel featuring standard shift codes, automated hours calculation with COUNTIF, overtime detection, and daily coverage summaries.
 Productivity
Emergency Fund Planner Excel Template
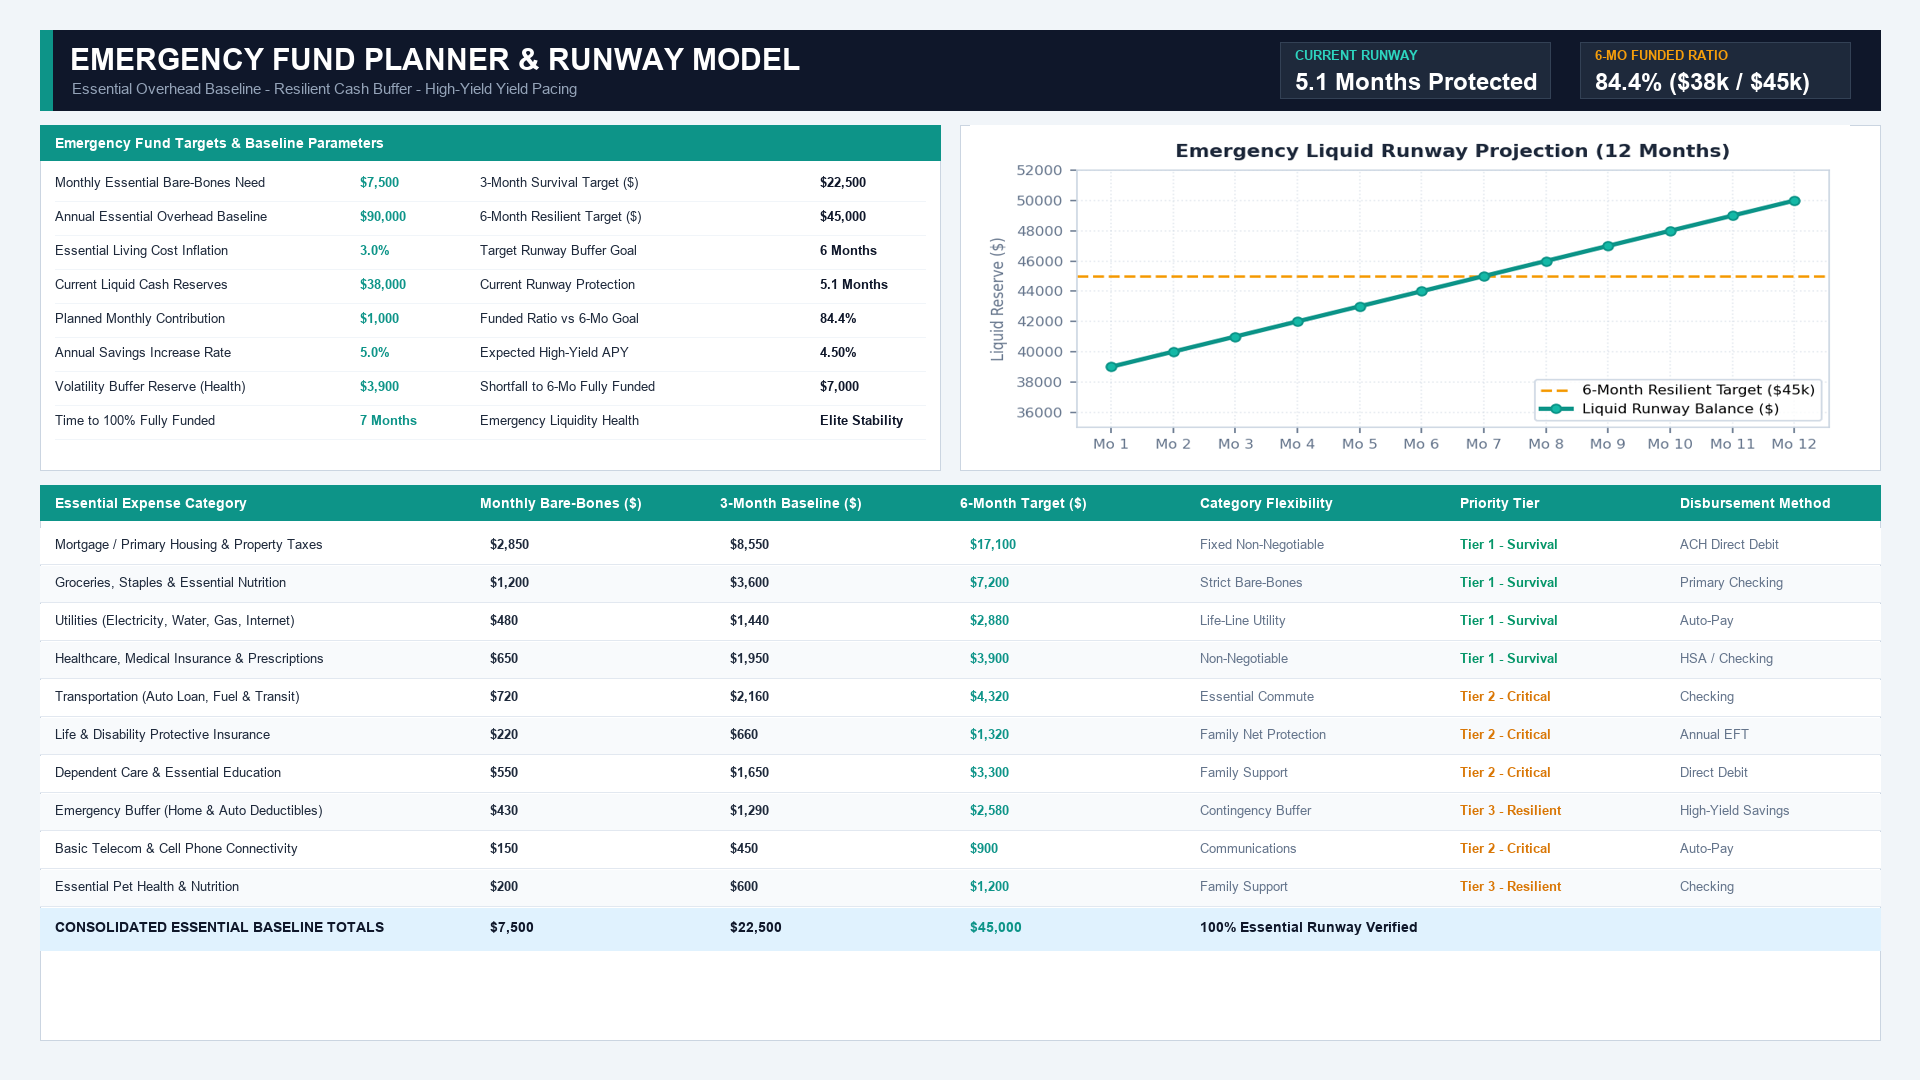
Learn how to build a resilient Emergency Fund Planner in Microsoft Excel featuring bare-bones baseline calculations, 3-month and 6-month runway multipliers, funded ratio tracking, and savings pacing.
Discussion
Ask questions, share formula tips, or discuss alternative approaches with fellow spreadsheet builders.
Loading discussion...