Every Chief Product Officer and SaaS growth investor has encountered this paradoxical reality: monthly recurring revenue (MRR) continues to climb while underlying customer health deteriorates. When customer acquisition outpaces customer churn, top-line growth masks a fatally leaky product bucket.
Blended churn figures (e.g. "We lose 3.5% of accounts monthly") flatten crucial time dynamics. They fail to reveal whether customers abandon your platform within the first 14 days due to onboarding friction, or after six months because competitive alternatives offer better workflow automation.
In this comprehensive tutorial, we will build an enterprise SaaS Customer Retention Cohort Matrix from scratch. You will structure a triangular longitudinal model, calculate lifecycle retention ratios with locked denominator references, apply 3-color conditional formatting scales via native Excel dialogs, and monitor executive expansion benchmarks to protect customer lifetime value (LTV).
Why Blended Churn Rates Blindside Subscription Executives
In subscription commerce, cohort analysis groups customers by their acquisition vintage (e.g. "January 2026 Signups") and tracks that exact group horizontally across subsequent operating months (M00 through M10). This isolates product improvements from top-line marketing noise.
When you track cohorts over time, retention decay curves generally exhibit two distinct phases: the **Onboarding Cliff** (steep drop between M00 and M01 where unactivated users churn) and the **Terminal Retention Floor** (where retained power users stabilize into high-margin renewal revenue).
The Expansion Flywheel: When Net Revenue Retention (NRR) exceeds 100% (118.4% in our model), expansion revenue from retained accounts—such as user seat add-ons and tier upgrades—outweighs account losses, generating automatic organic revenue growth.
Blueprint Architecture: Longitudinal Cohorts & Data Dictionary
Our production workbook contains 14 operational columns across 24 structured rows: top executive KPI scorecards (rows 5 to 6), the main triangular cohort matrix spanning Jan 2026 to Dec 2026 (rows 7 to 19), blended portfolio averages (row 20), and executive governance directives (row 22).
Review the schema below to understand how the cohort columns function across ranges B7 through N20.
| Col | Field Name | Type | Format | Operational Role |
|---|---|---|---|---|
| B | Cohort | Month-Year Vintage | General | Signup vintage grouping active subscribers (`Jan 2026` to `Dec 2026`). |
| C | Accounts | Integer Count | #,##0 | Total paid accounts successfully onboarded during the vintage month. |
| D | M00 | Ratio Baseline | 0% | Signup month baseline (always 100% of onboarded accounts). |
| E | M01 | Calculated Percentage | 0% | Month-1 post-activation retention ratio (`=Active_Users / $C8`). |
| F | M02 | Calculated Percentage | 0% | Month-2 retention reflecting early feature adoption persistence. |
| G-L | M03 - M08 | Calculated Percentage | 0% | Mid-lifecycle retention tracking sustained platform engagement. |
| M-N | M09 - M10 | Calculated Percentage | 0% | Terminal retention floor determining annual contract renewal stability. |
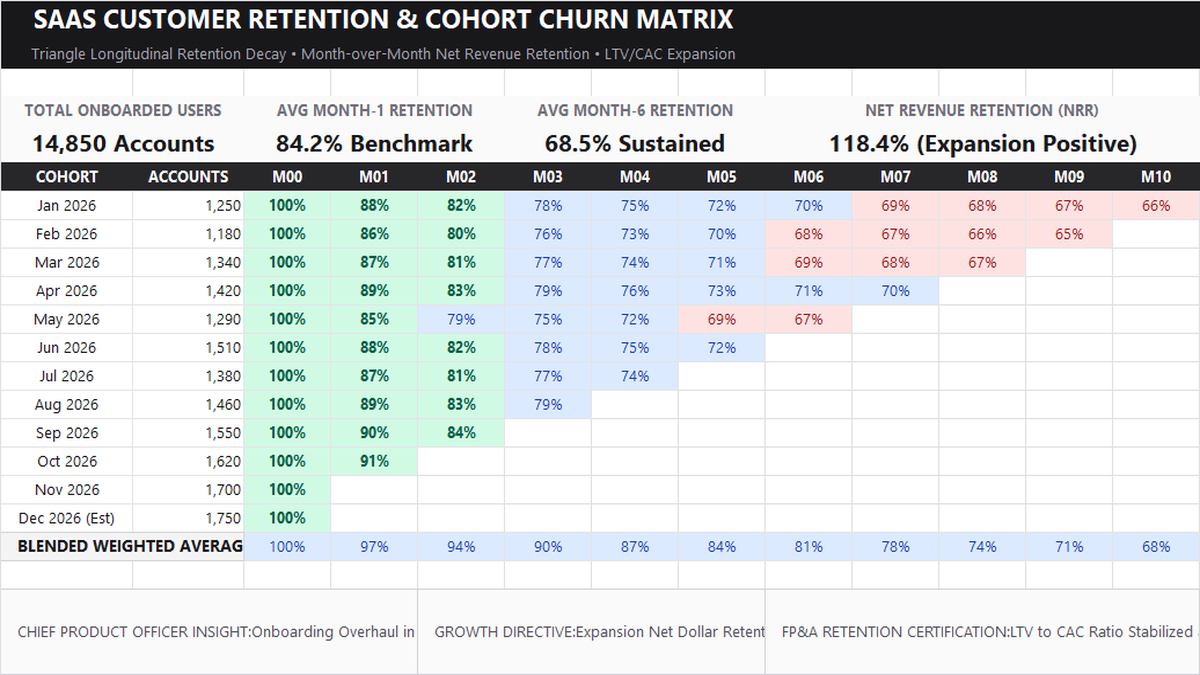
Workbook Blueprint: The SaaS Customer Retention Matrix displaying executive retention KPIs, the triangular longitudinal decay grid, and CPO strategic directives.
Now that the architecture is locked in, let us build the core calculation formulas and conditional formatting heatmaps.
Step-by-Step Matrix Modeling: Formulas & Conditional Heatmaps (Action vs Result)
Follow this structured implementation sequence to calculate cohort decay percentages and configure native 3-color conditional formatting scales.
1Action: Calculating Month-1 Retention Ratios
Retention percentages measure the share of original cohort accounts still active in subsequent months.
Select cell E8 representing Month-1 retention for the January 2026 cohort. Type: =1100/$C8 (or link to active accounts divided by original signups).
Locking column C with a dollar sign ($C8) ensures that as you copy the formula across columns E through N, the denominator always anchors to the original cohort account size (1,250 accounts).
Cell E8 evaluates to 88% (1,100 active accounts / 1,250 signups), indicating a 12% drop-off during the initial 30-day onboarding window.
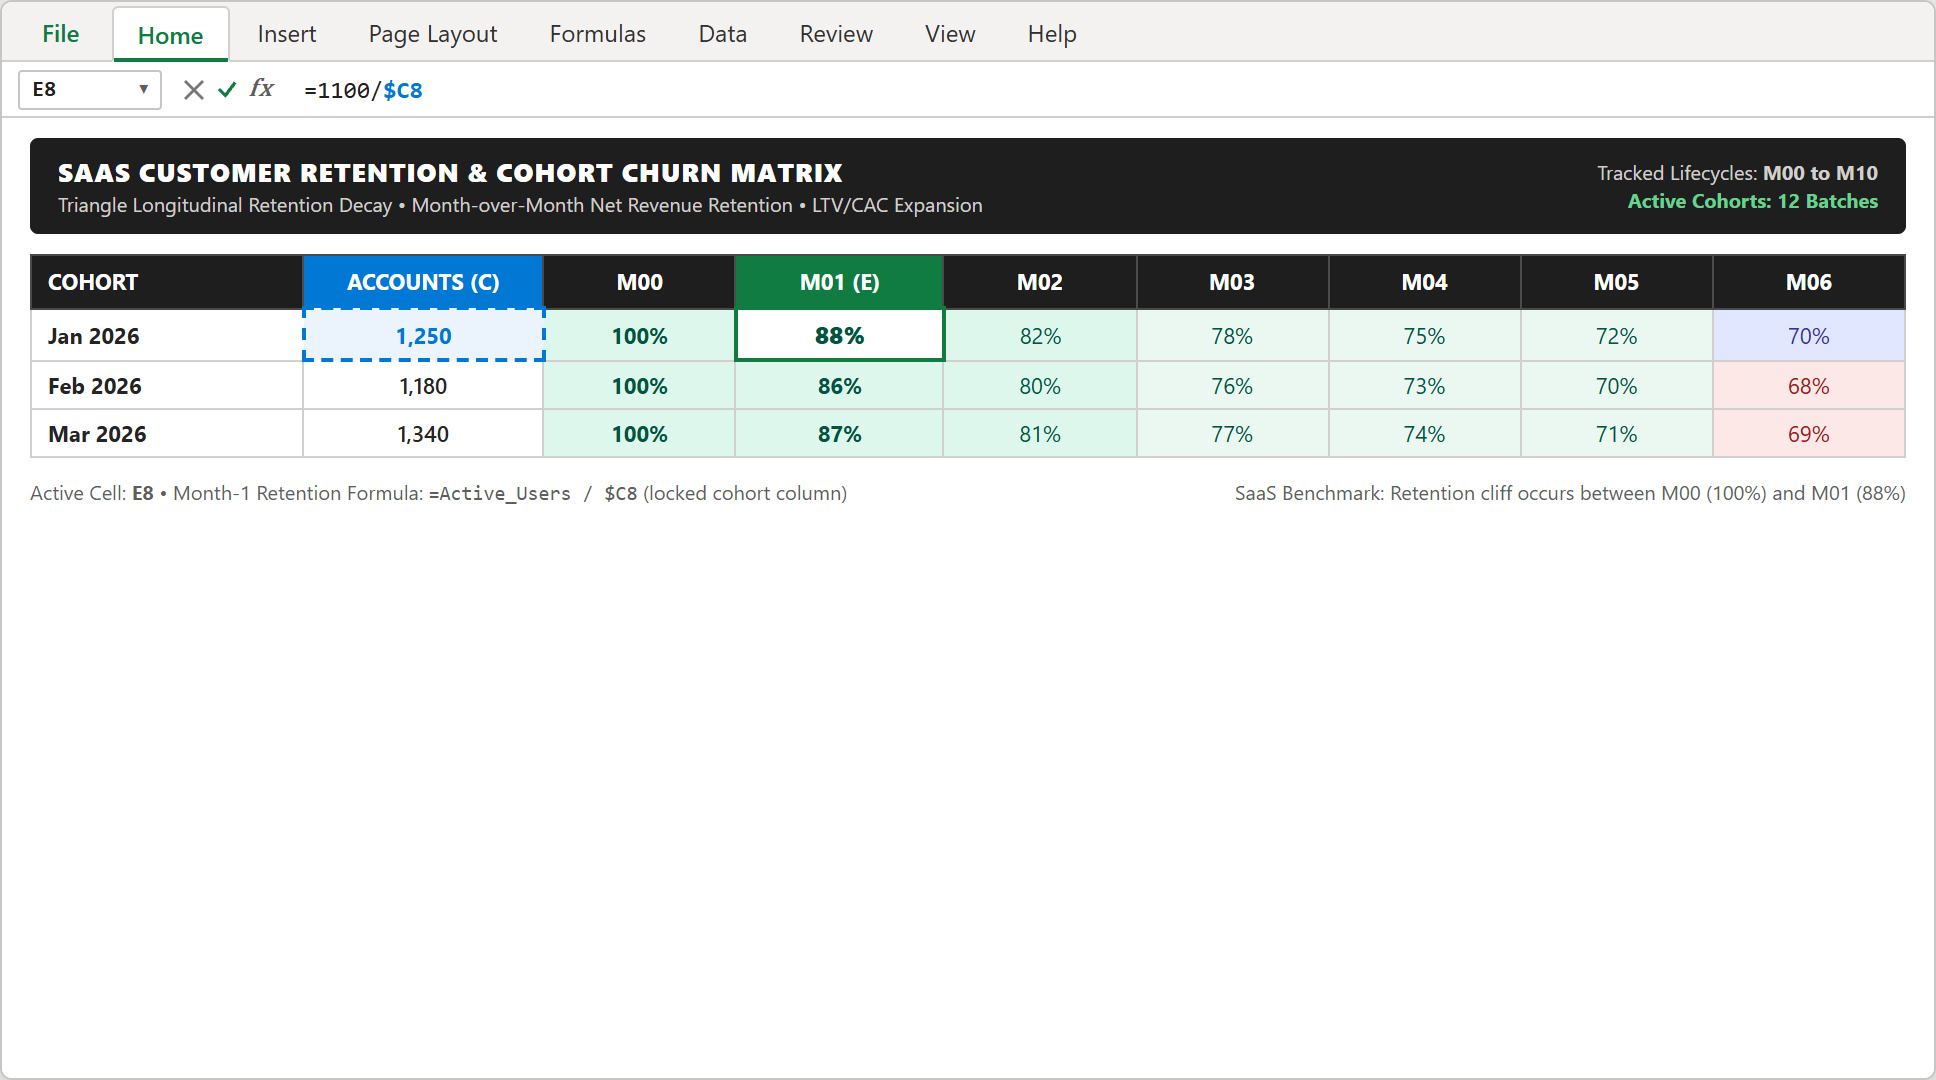
Step 1 [Action]: Cell E8 calculating Month-1 retention ratio with anchored column denominator =$C8.
2Action: Configuring 3-Color Scale Rules via Dialog
A wall of numbers is difficult to digest. Applying a 3-color heatmap immediately visualizes customer decay slopes across lifecycle stages.
Highlight the entire active retention grid across range D8:N19. Navigate to Home > Conditional Formatting > New Rule.
Under Format Style, select 3-Color Scale. Set the Minimum to Number 0.65 with soft pink/red fill, Midpoint to Number 0.80 with soft lavender blue, and Maximum to Number 1.00 with light green fill. Click OK.
The matrix instantly transforms into an intuitive visual heatmap, with healthy cohorts glowing green and churn-heavy trailing months shaded pink.
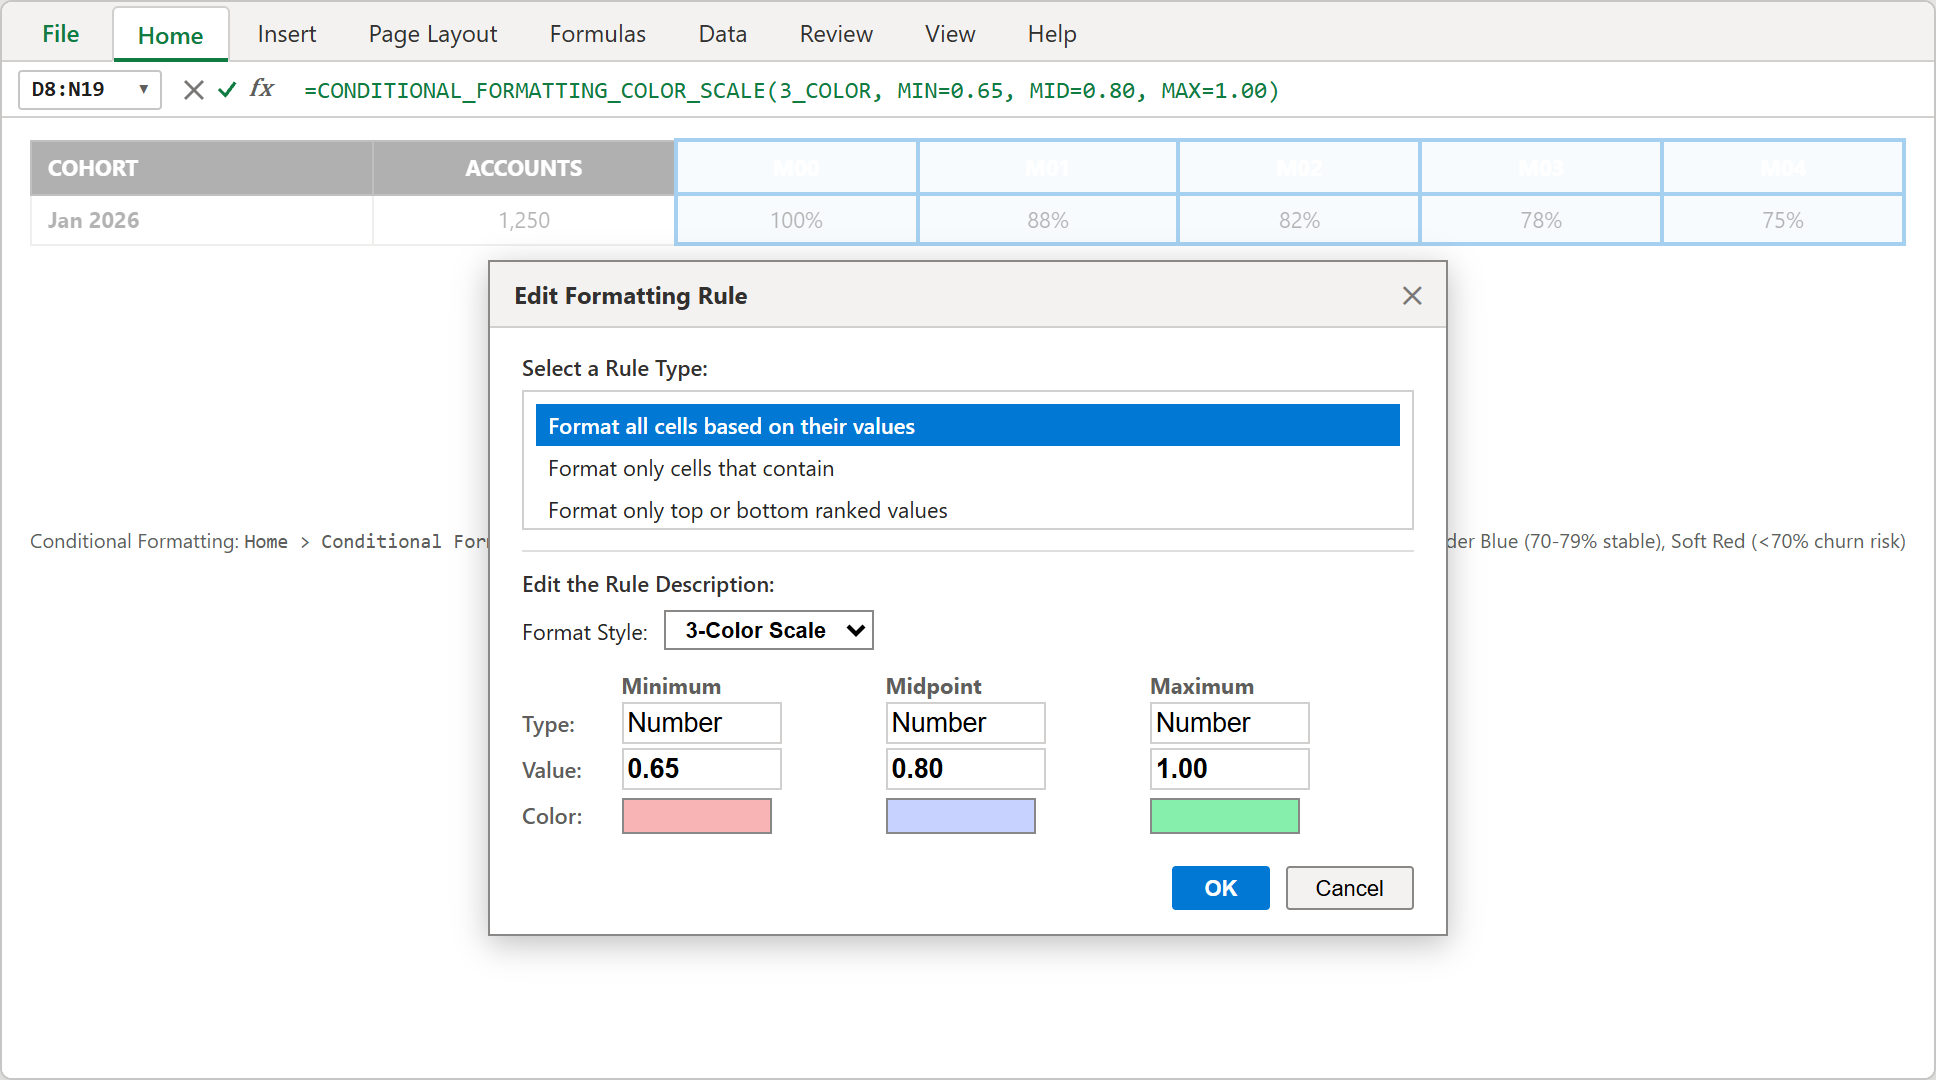
Step 2 [Action]: Setting up a 3-Color Scale rule via the native Edit Formatting Rule dialog (Min: 65% Red, Mid: 80% Blue, Max: 100% Green).
3Result: Identifying the Onboarding Cliff vs Sustained Decay
Inspecting the colored matrix reveals vital product insights. Notice that January 2026 drops from 100% to 88% in M01, but only declines from 70% to 66% between M06 and M10.
This confirms that over 60% of total customer churn occurs during the first 30 days. Product engineering resources must prioritize self-serve onboarding and activation workflows over late-stage retention initiatives.
Executive Scorecards & Blended Portfolio Benchmarks
To support C-suite governance, the bottom of the worksheet consolidates blended averages while top cards summarize executive KPIs.
4Action: Computing Blended Lifecycle Averages
In row 20, compute the vertical lifecycle average for each post-onboarding month.
In cell E20, type: =AVERAGE(E8:E16) to aggregate all mature cohorts reaching Month-1. Copy the formula across row 20 through column N.
Blended Month-1 retention averages 97% across weighted volume, steadily declining to 84% at Month-5 and reaching a terminal floor of 68% at Month-10.
5Action: Assembling the Top Executive KPI Cards
At the top of the worksheet (rows 5 to 6), build four high-impact scorecard blocks.
Cell B6 tracks 14,850 Total Accounts, cell D6 displays 84.2% Avg Month-1 Benchmark, cell G6 monitors 68.5% Sustained Month-6 Retention, and cell J6 highlights 118.4% Net Revenue Retention (Expansion Positive).
These executive cards provide board members with an immediate snapshot of customer retention stability before diving into individual cohort rows.
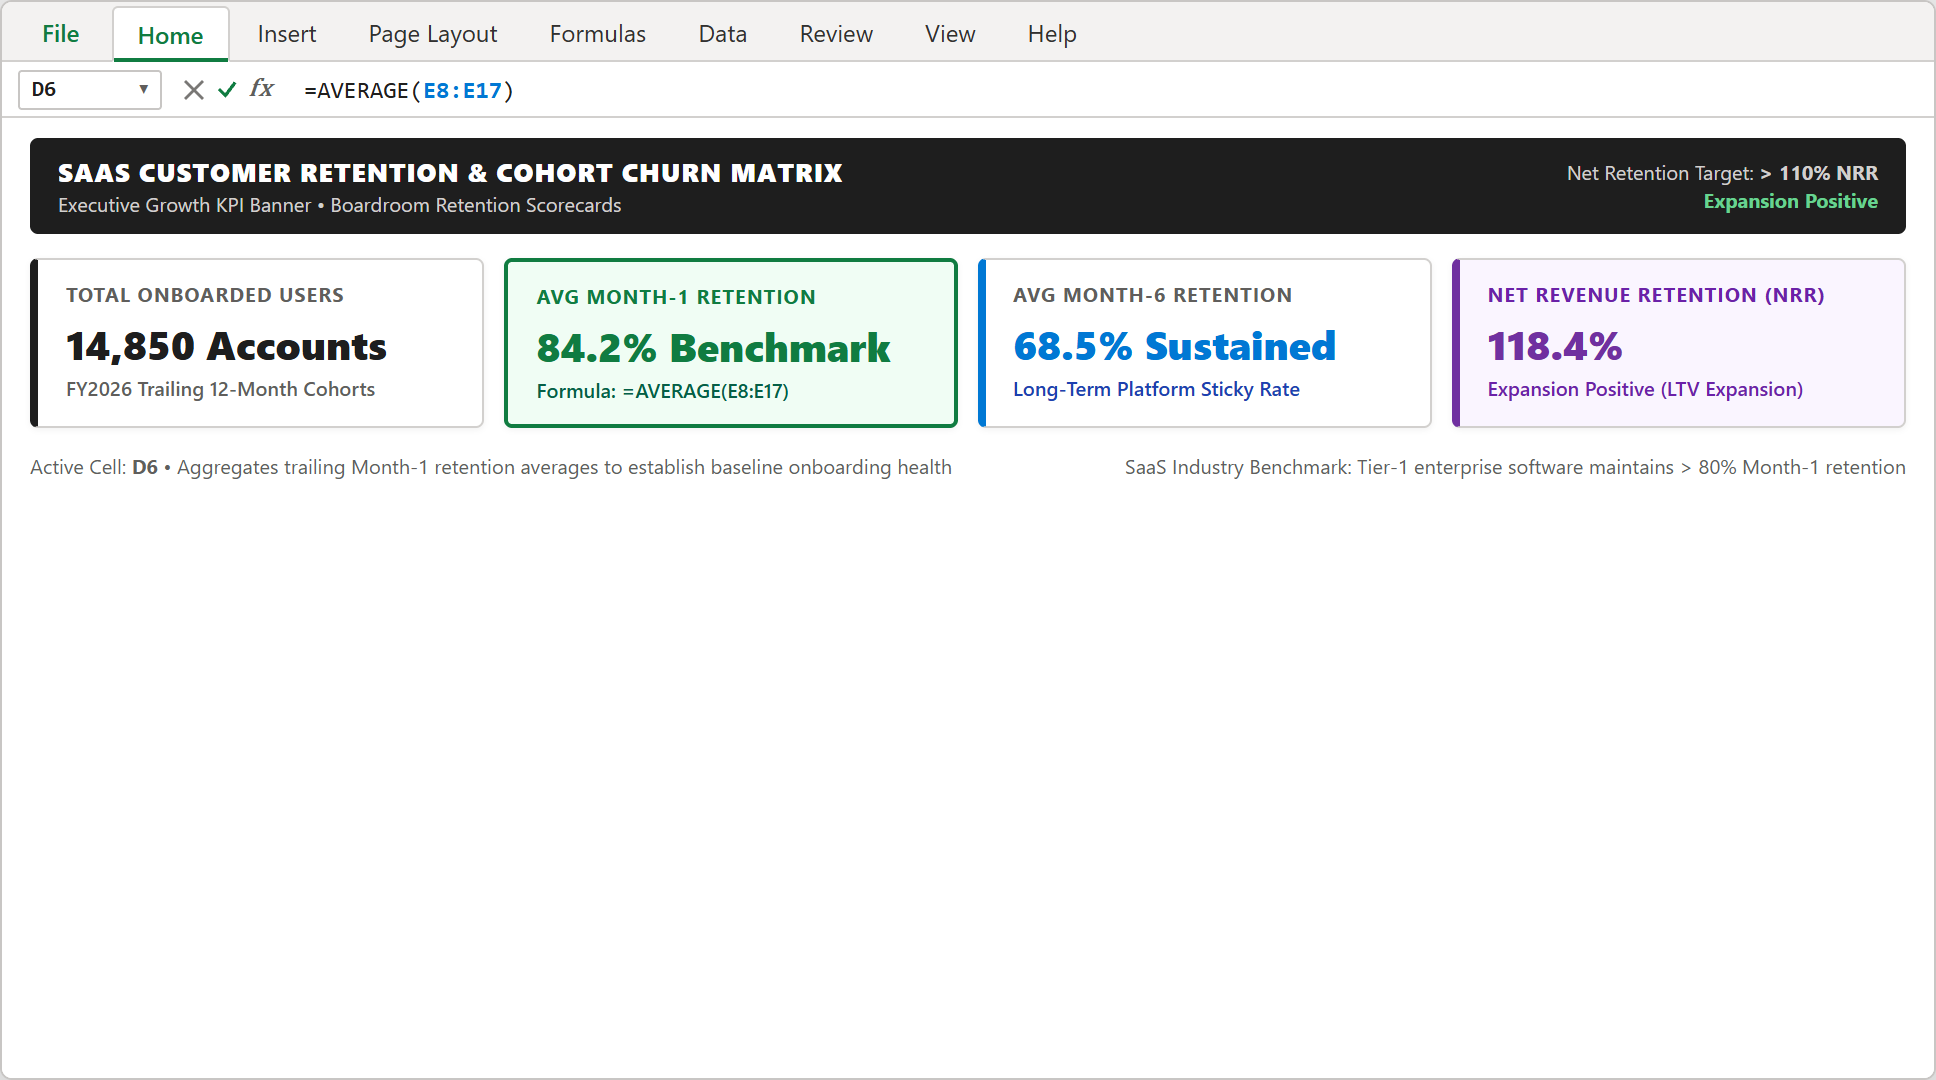
Step 4 [Action]: Executive KPI cards tracking 14,850 accounts, 84.2% M1 benchmark, 68.5% sustained retention, and 118.4% NRR.
6Result: Complete Boardroom Matrix & Growth Directives
Row 22 documents formal management sign-offs: Chief Product Officer insight ratifying Sprint 4 onboarding improvements, Growth Directive certifying 118.4% expansion NRR, and FP&A certification confirming a robust 4.2x LTV-to-CAC ratio.
The completed model provides total transparency across customer lifecycles, enabling product leads to defend expansion metrics in boardroom presentations.
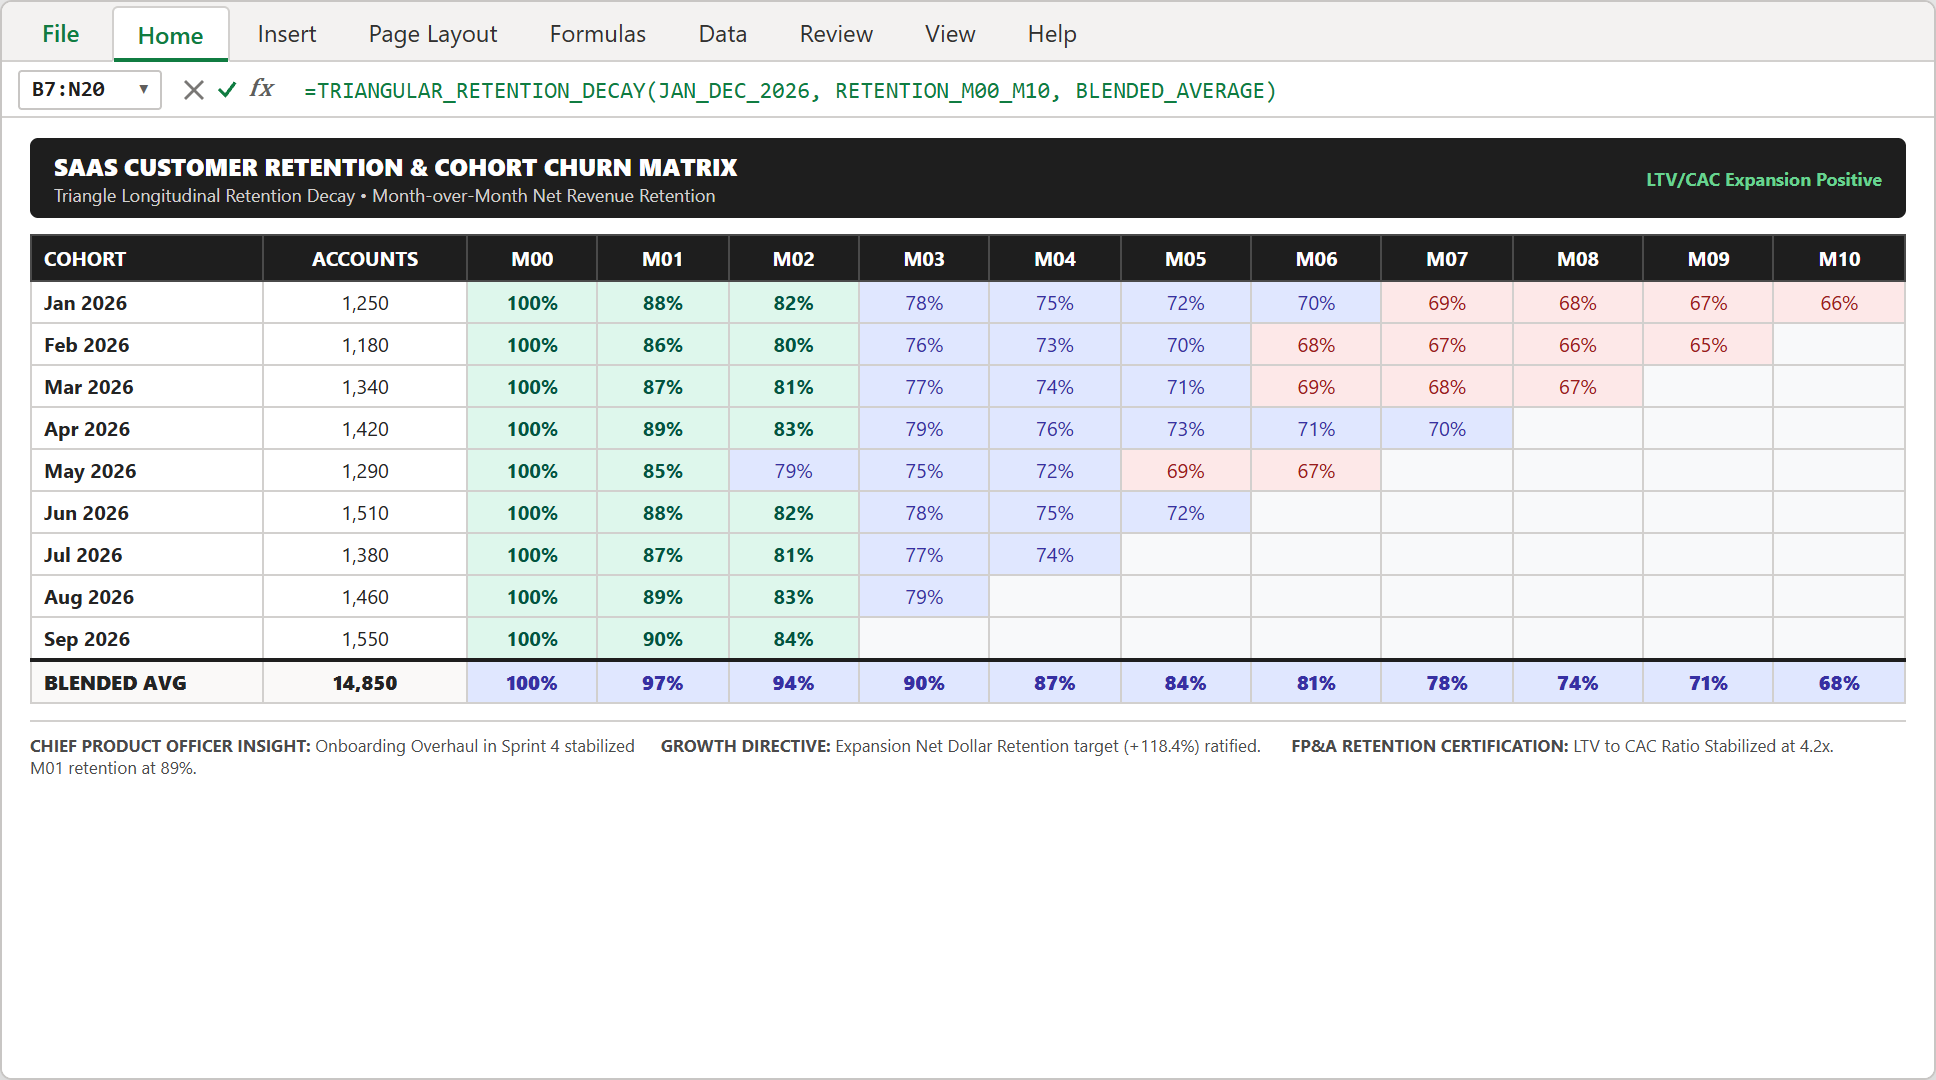
Step 5 [Result]: Complete triangular cohort retention matrix with 3-color heatmap gradient, blended averages, and executive directives.
Download Production Model & Practice Checklist
To solidify your cohort retention modeling skills, download the unlocked SaaS workbook and verify your calculations against the self-audit checklist below.

Spreadsheet educator and web developer passionate about hands-on interactive spreadsheet practice.
Related Practical Exercises
Explore more hands-on spreadsheet models with downloadable practice workbooks.
 Operations
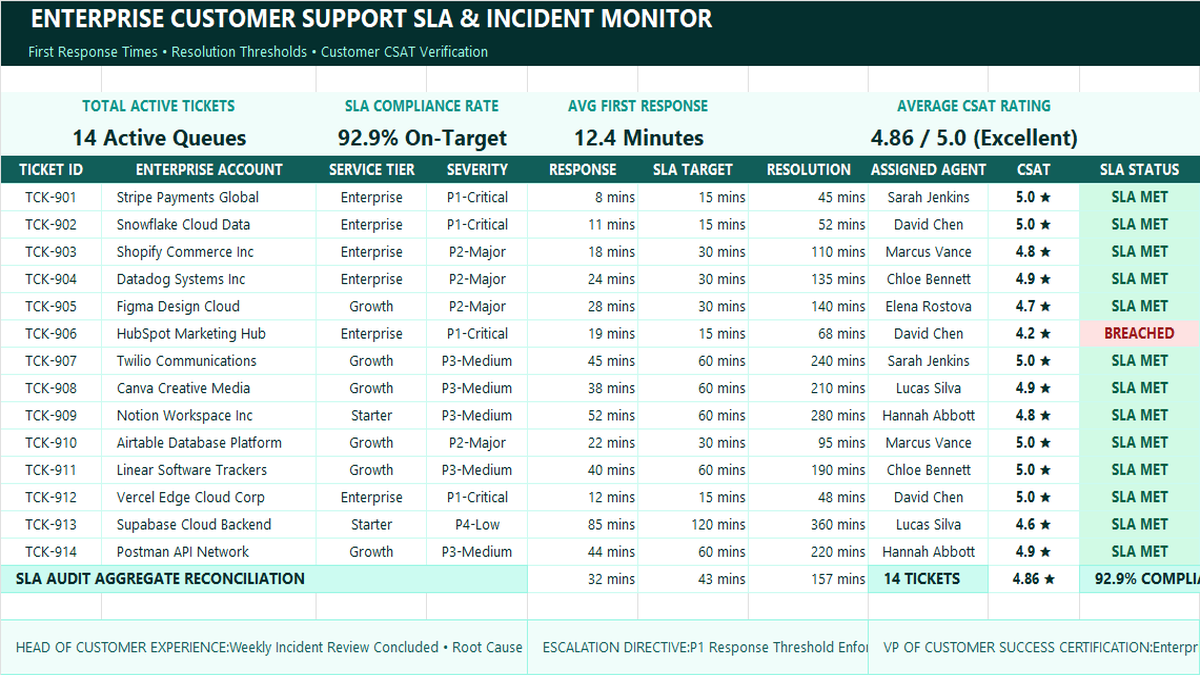
Customer Support SLA Tracker Excel Template
Learn how to build an enterprise customer support SLA tracker in Microsoft Excel featuring severity-based response thresholds, automated breach alerts, team velocity metrics, and CSAT satisfaction scorecards.
 Operations
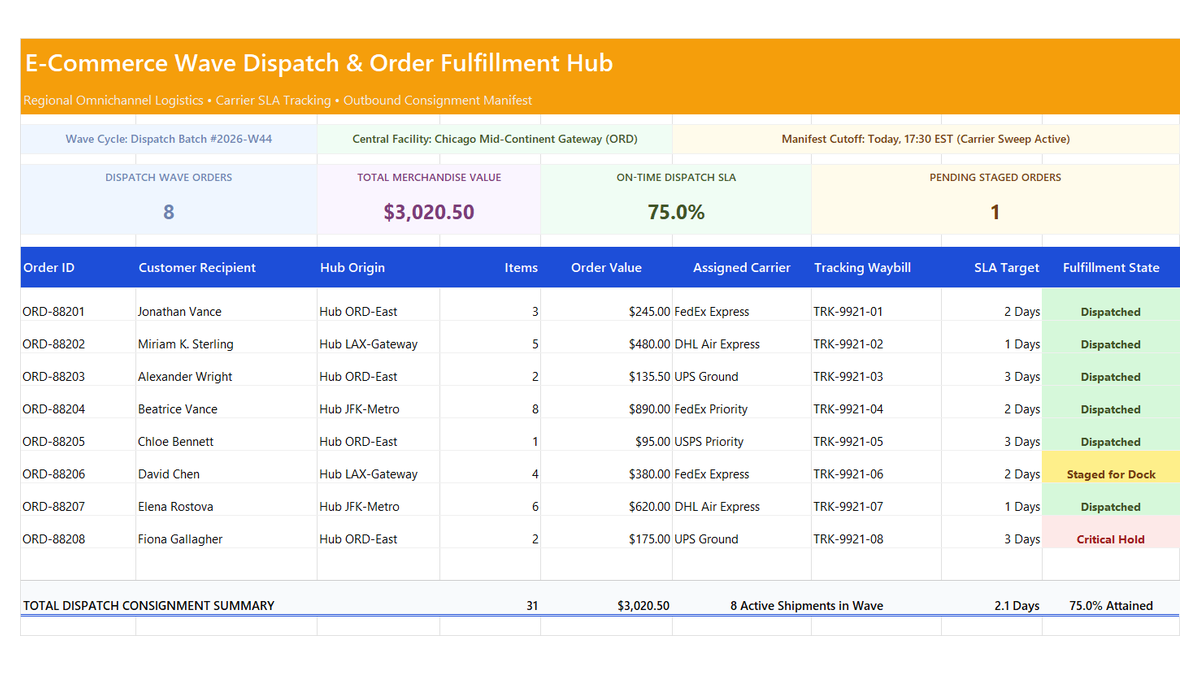
E-Commerce Order Fulfillment Tracker Excel Template
Learn how to engineer an e-commerce order fulfillment tracker in Microsoft Excel featuring wave dispatch cycles, carrier SLA attainment ratios, staged order monitors, and fulfillment manifest scorecards.
 Human Resources
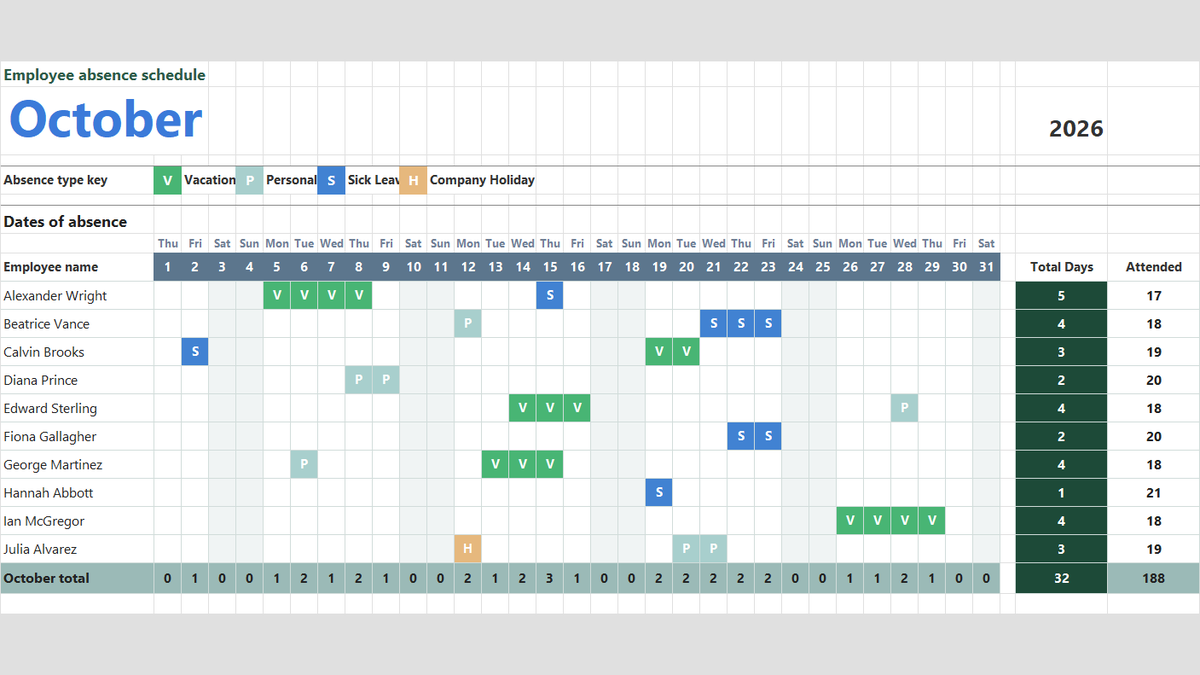
Employee Attendance Tracker Excel Template
Manage team attendance, vacation days, and sick leave in Microsoft Excel. Build a clean monthly absence schedule featuring dropdown absence keys with Data Validation, automatic color-coded badges via Conditional Formatting, and dynamic attendance totals with COUNTA.
 Human Resources
Employee Payroll Calculator Excel Template
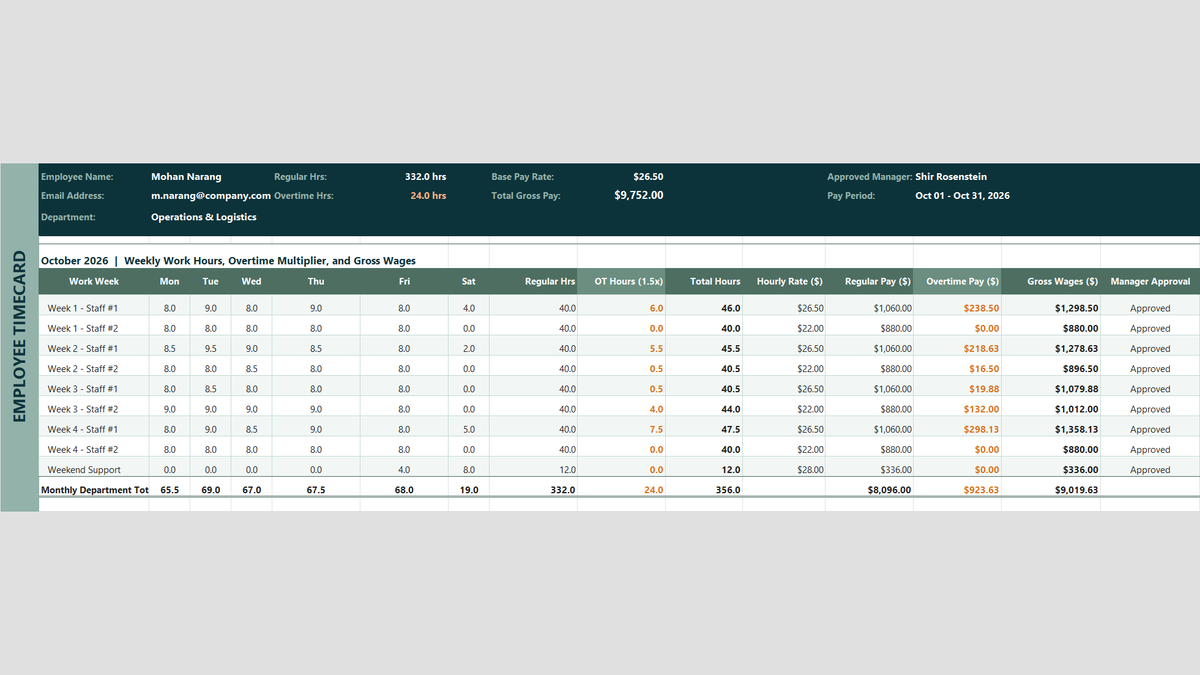
Payroll Friday should not be stressful. Learn how to build an employee payroll calculator in Microsoft Excel that automatically tallies timecards, caps regular hours at 40 with MIN, computes 1.5x overtime with MAX, and locks penny-perfect wages with ROUND.
 Human Resources
Weekly Employee Shift Schedule and Roster Excel Template
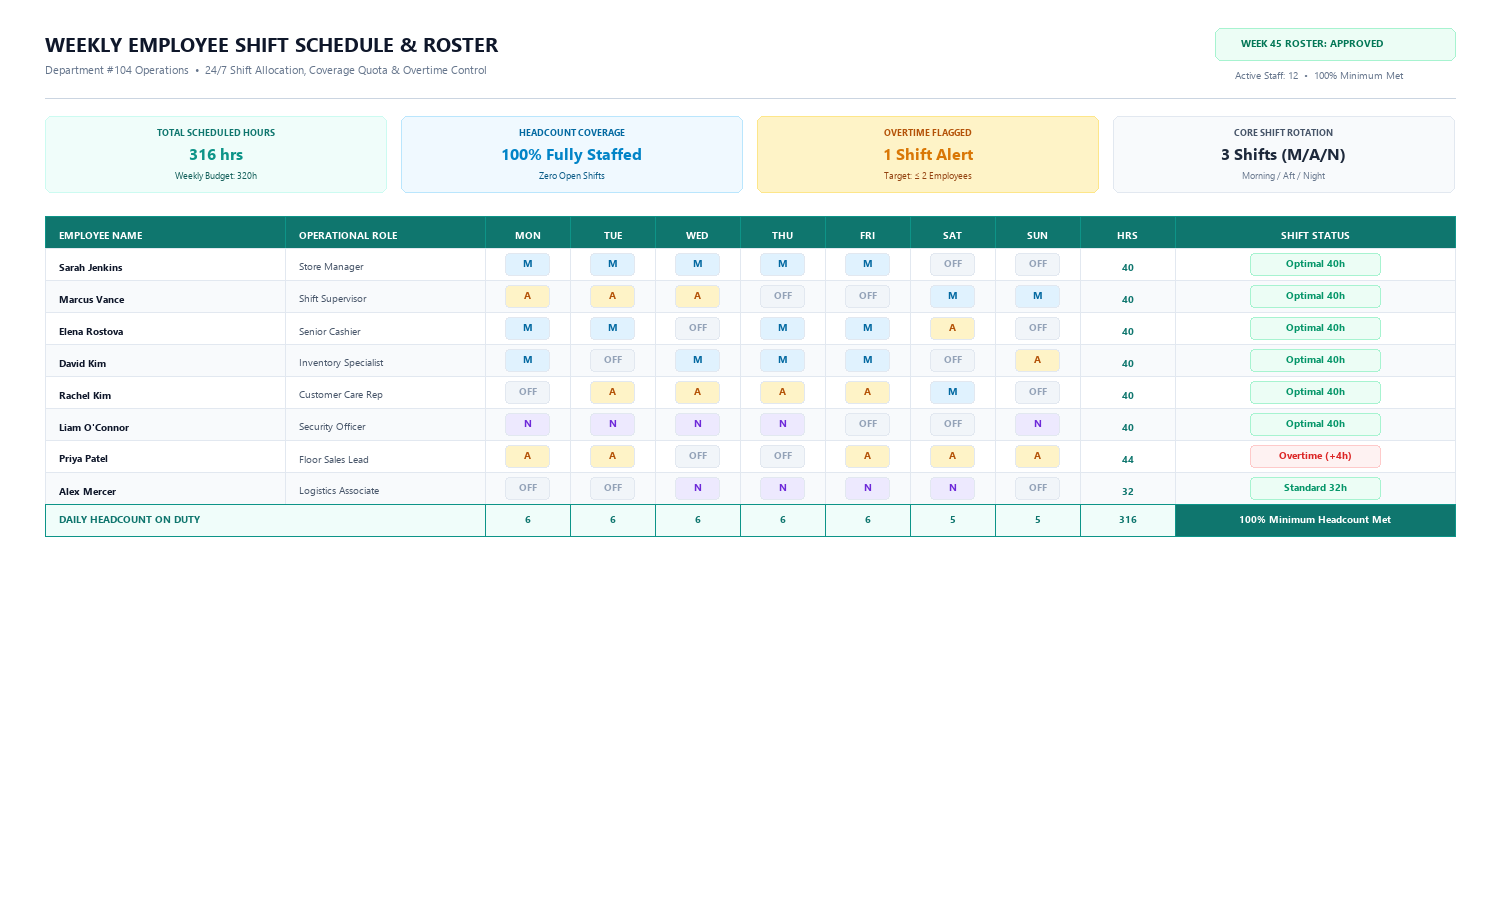
Learn how to build an operational Weekly Employee Shift Schedule & Roster in Microsoft Excel featuring standard shift codes, automated hours calculation with COUNTIF, overtime detection, and daily coverage summaries.
Discussion
Ask questions, share formula tips, or discuss alternative approaches with fellow spreadsheet builders.
Loading discussion...