Annual operating budgets represent corporate strategy translated into capital allocations. But when departmental spending runs wild across SaaS platforms, contractor benches, and digital advertising without weekly oversight, finance directors face a grim month-end surprise: emergency hiring freezes and unplanned equity draws.
True corporate governance requires active variance accounting rather than passive expense logging. When executive leadership convenes for quarterly performance reviews, they don’t just want to know how much cash left the company accounts—they want to know which cost centers stayed disciplined, which operational bets exceeded budget, and whether favorable balances reflect genuine cost efficiency or merely delayed capital expenditures.
In this comprehensive tutorial, we construct a production-ready Corporate OPEX Budget vs Actual Variance Model in Microsoft Excel. From dynamic department-level dollar variances and subtotal aggregations to executive cash flow scorecards and in-cell bi-directional data bars, this financial tool gives controllers and CFOs immediate capital clarity.
The Corporate Governance Challenge: Why Static OPEX Budgets Fail During Month-End Close
At the start of every fiscal year, leadership teams sign off on clean, balanced departmental budgets. But within forty-five days, the realities of commercial operations collide with baseline projections. Engineering accelerates cloud server migration, Marketing doubles paid social spend during product launches, and IT discovers unexpected enterprise license true-ups.
Spreadsheets often fail finance departments when they suffer from three chronic design flaws:
1. The "Single Column" Blindness: Merely tracking total actual disbursements without displaying baseline projected budgets on the exact same row leaves executives guessing whether an $80,000 monthly spend represents a planned initiative or an unbudgeted emergency.
2. Mathematical Ambiguity Around Variances: In revenue accounting, higher numbers are good (Actual - Budget). But in operational expense (OPEX) accounting, spending less than budgeted is favorable (Budget - Actual). When formulas invert this logic inconsistently, board members misinterpret dangerous cost overruns as positive savings.
3. Lack of Visual Escalation Tiers: A CFO reviewing sixty expense line items in a 15-minute executive briefing cannot read every individual dollar figure. Critical budget leaks must pop out visually before board packages are finalized.
By building structured departmental ledgers with consistent accounting math, automated category rollups, and visual data bars, we transform raw ledger exports into a disciplined capital management system.
Financial Model Architecture: Dual-Schedule Departmental Ledger Design
A professional corporate variance model organizes operational expenditures by cost center while keeping high-level executive reconciliation scorecards pinned to the top of the sheet.
Our single-sheet architecture pairs executive cash flow reconciliation (rows 4 through 16) with parallel departmental schedules for Engineering and Marketing (rows 18 through 29). Below row 30, modular expansion schedules accommodate Transport, Insurance, Taxes, and Legal retainers.
Review the schema below to understand how the operational line items operate across columns B through J.
| Col | Field Name | Type | Format | Operational Role |
|---|---|---|---|---|
| B | Engineering Expense | Text | General | Departmental spending line item (Cloud Servers, Software Licenses, CI/CD). |
| C | Projected Cost ($) | Currency | $#,##0 | Board-approved projected budget allocation baseline. |
| D | Actual Cost ($) | Currency | $#,##0 | Realized historical disbursements and recognized invoices. |
| E | Difference ($) | Formula (Currency) | +$#,##0;-$#,##0 | Spending variance calculated as Projected Cost minus Actual Cost. |
| G | Marketing Expense | Text | General | Marketing spending line item (Google Search, Paid Social, Brand PR). |
| H-J | Marketing Allocations | Currency / Formula | $#,##0 | Parallel projected, actual, and difference columns for marketing operations. |

Workbook Blueprint: The Budget vs Actual Variance Analysis layout featuring executive revenue scorecards, SOX compliance notes, and modular departmental schedules.
Now that the departmental schema is established, let us calculate individual cost variances and aggregate operational category subtotals.
Step-by-Step Implementation: Engineering the Executive FP&A Cockpit
Follow this structured step-by-step sequence to construct the calculations, category rollups, conditional rules, and custom number formatting directly inside Microsoft Excel.
1Step 1: Calculating Departmental Dollar Variance Difference
In corporate OPEX accounting, our core variance question is: did the department spend less than authorized (surplus/favorable) or more than authorized (deficit/unfavorable)?
To establish this cushion, we subtract Actual Cost from Projected Cost. Select cell E19 and enter: =C19-D19.
For Cloud Servers & AWS Hosting, with a projected baseline of $45,000 and actual recognized disbursements of $42,800, cell E19 evaluates to a favorable +$2,200 surplus. Copy this formula down through E28 and replicate it across column J (=H19-I19) for Marketing.
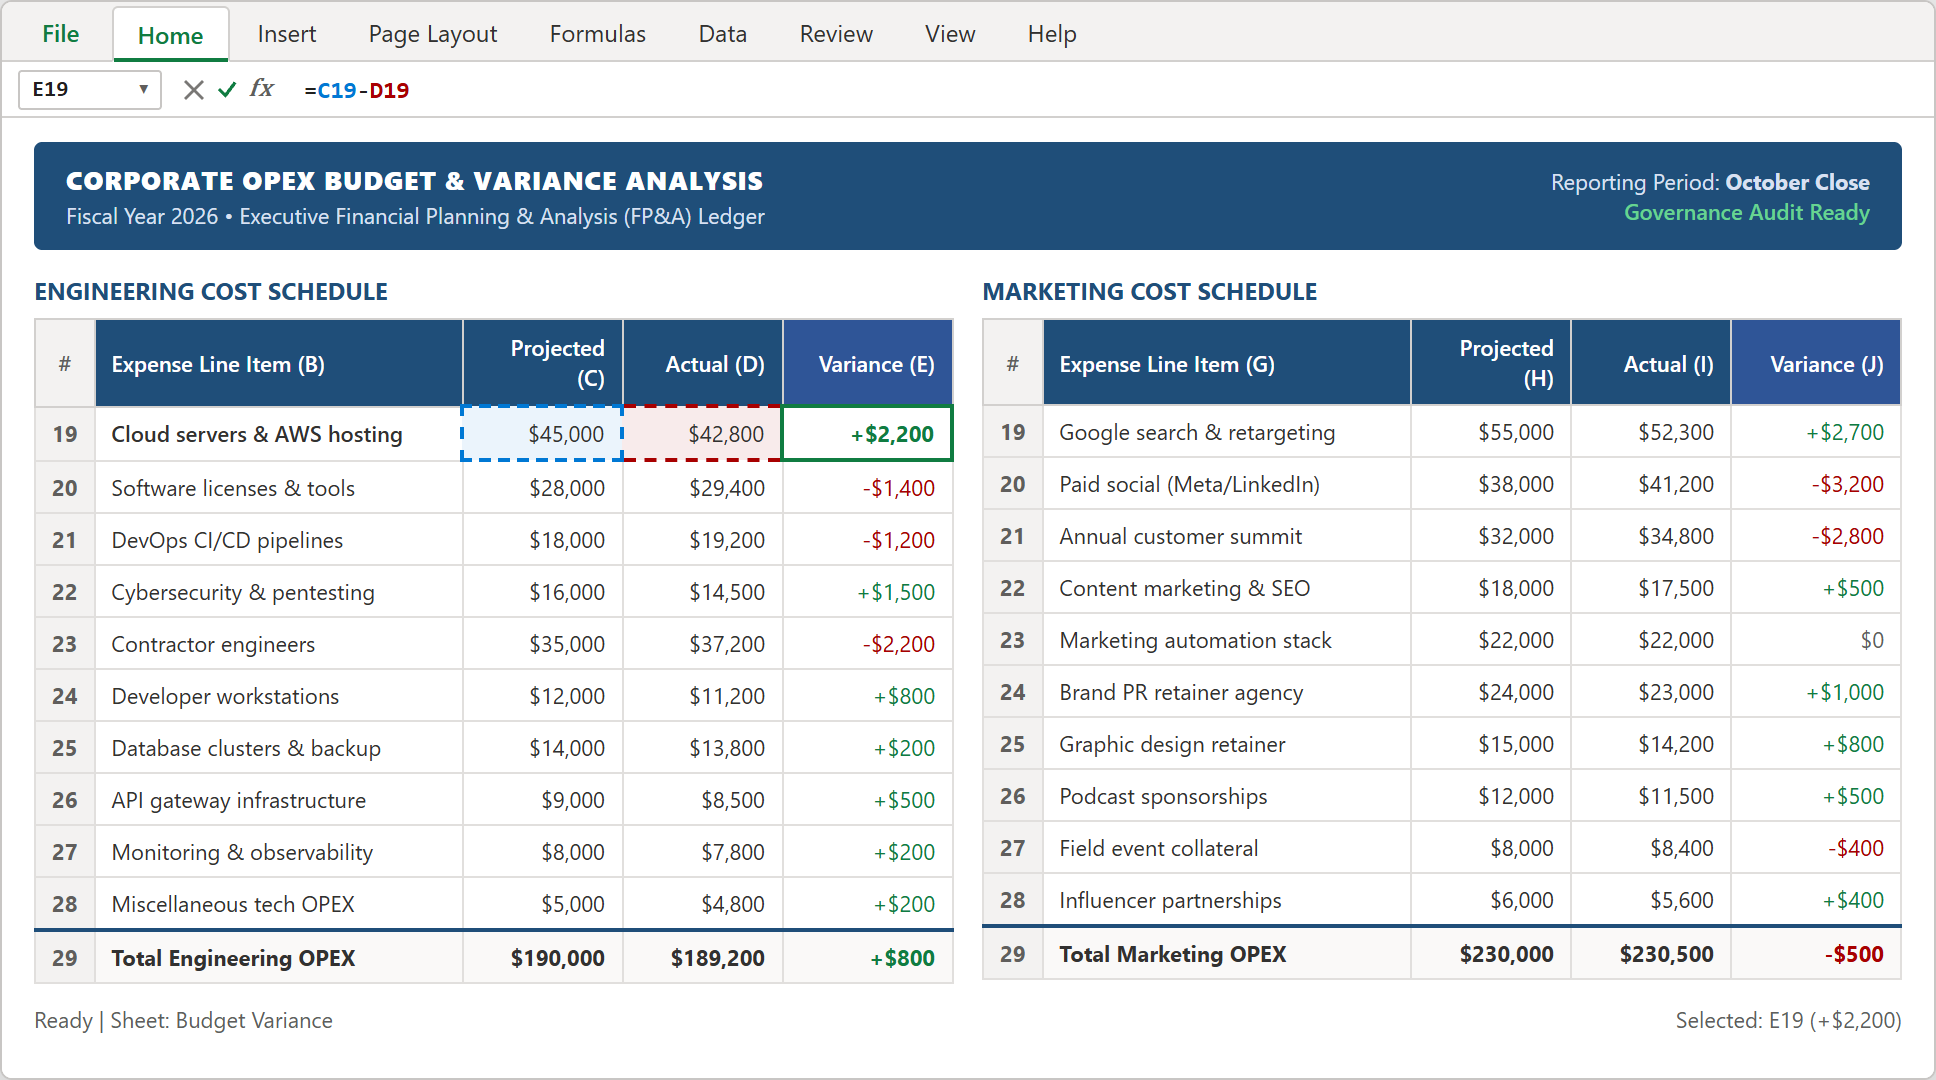
Step 1: Cell E19 formula bar active with =C19-D19 calculating a +$2,200 favorable variance on AWS infrastructure.
2Step 2: Consolidating Departmental Baselines with AutoSum
Next, we establish division-level totals to compare macroscopic spending against authorized board envelopes.
Select row 29 subtotal cell C29 and enter: =SUM(C19:C28). This formula consolidates all individual engineering line items into an approved allocation baseline of $190,000.
Drag or replicate this formula across column D (=SUM(D19:D28) yielding $189,200) and column E (=SUM(E19:E28) yielding a net department cushion of +$800). In the adjacent Marketing table, row 29 aggregates $230,000 projected vs $230,500 actual, identifying a slight -$500 departmental overrun.
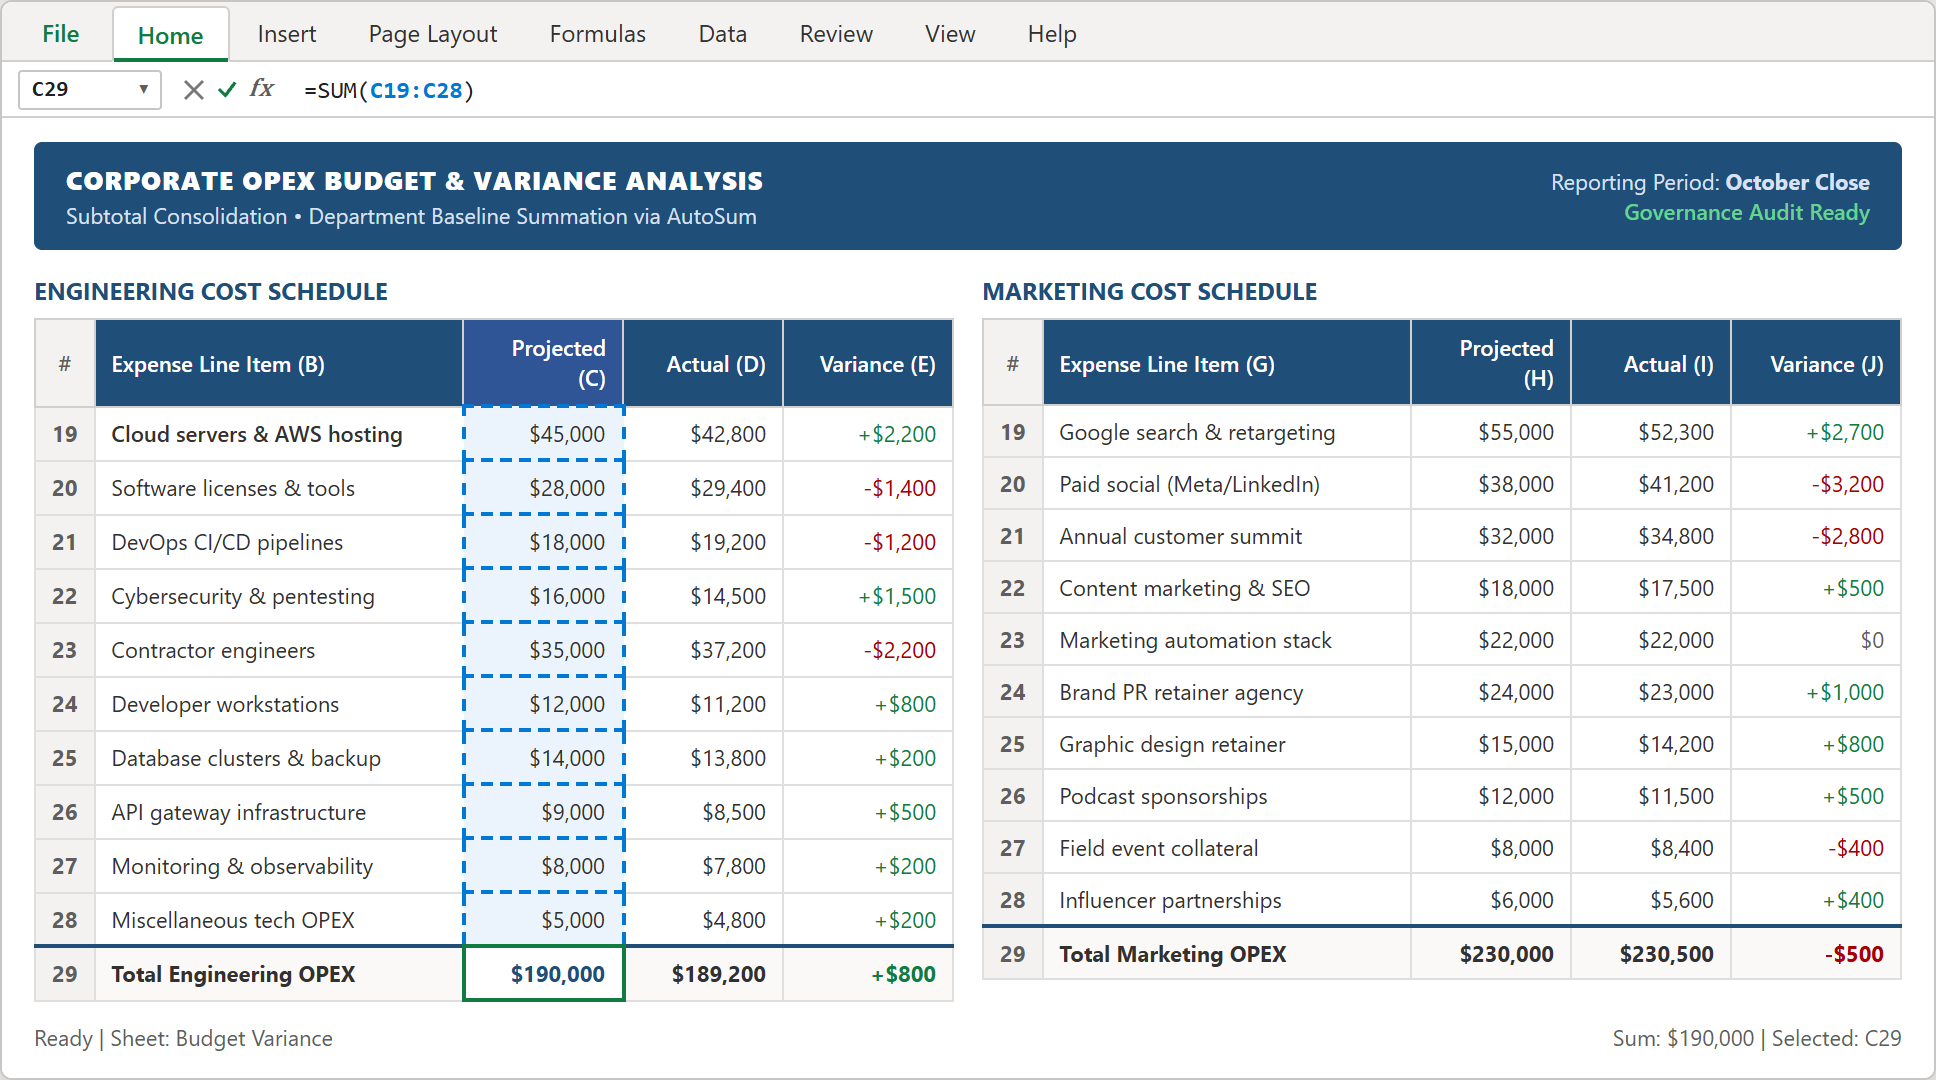
Step 2: Formula bar displaying =SUM(C19:C28) aggregating total engineering projected expenses in cell C29.
3Step 3: Reconciling Executive Net Balance & Top-Line Burn Rate
With departmental expenditures totaled, we bridge revenue and expense streams into an executive cash flow reconciliation.
In executive cell E14, calculate the Projected Net Balance by subtracting Total Projected OPEX (E11) from Total Projected Revenue (E6): =E6-E11. With $550,000 in monthly projected revenues against $514,500 in combined projected costs, cell E14 confirms a planned operational profit cushion of +$35,500.
Directly above, the executive cockpit displays top-level KPIs: Net OPEX Variance (+$1,300) confirming overall cost discipline across divisions, and Budget Burn Rate (98.9%), demonstrating precise capital deployment right within the optimal 95%-100% operational band.
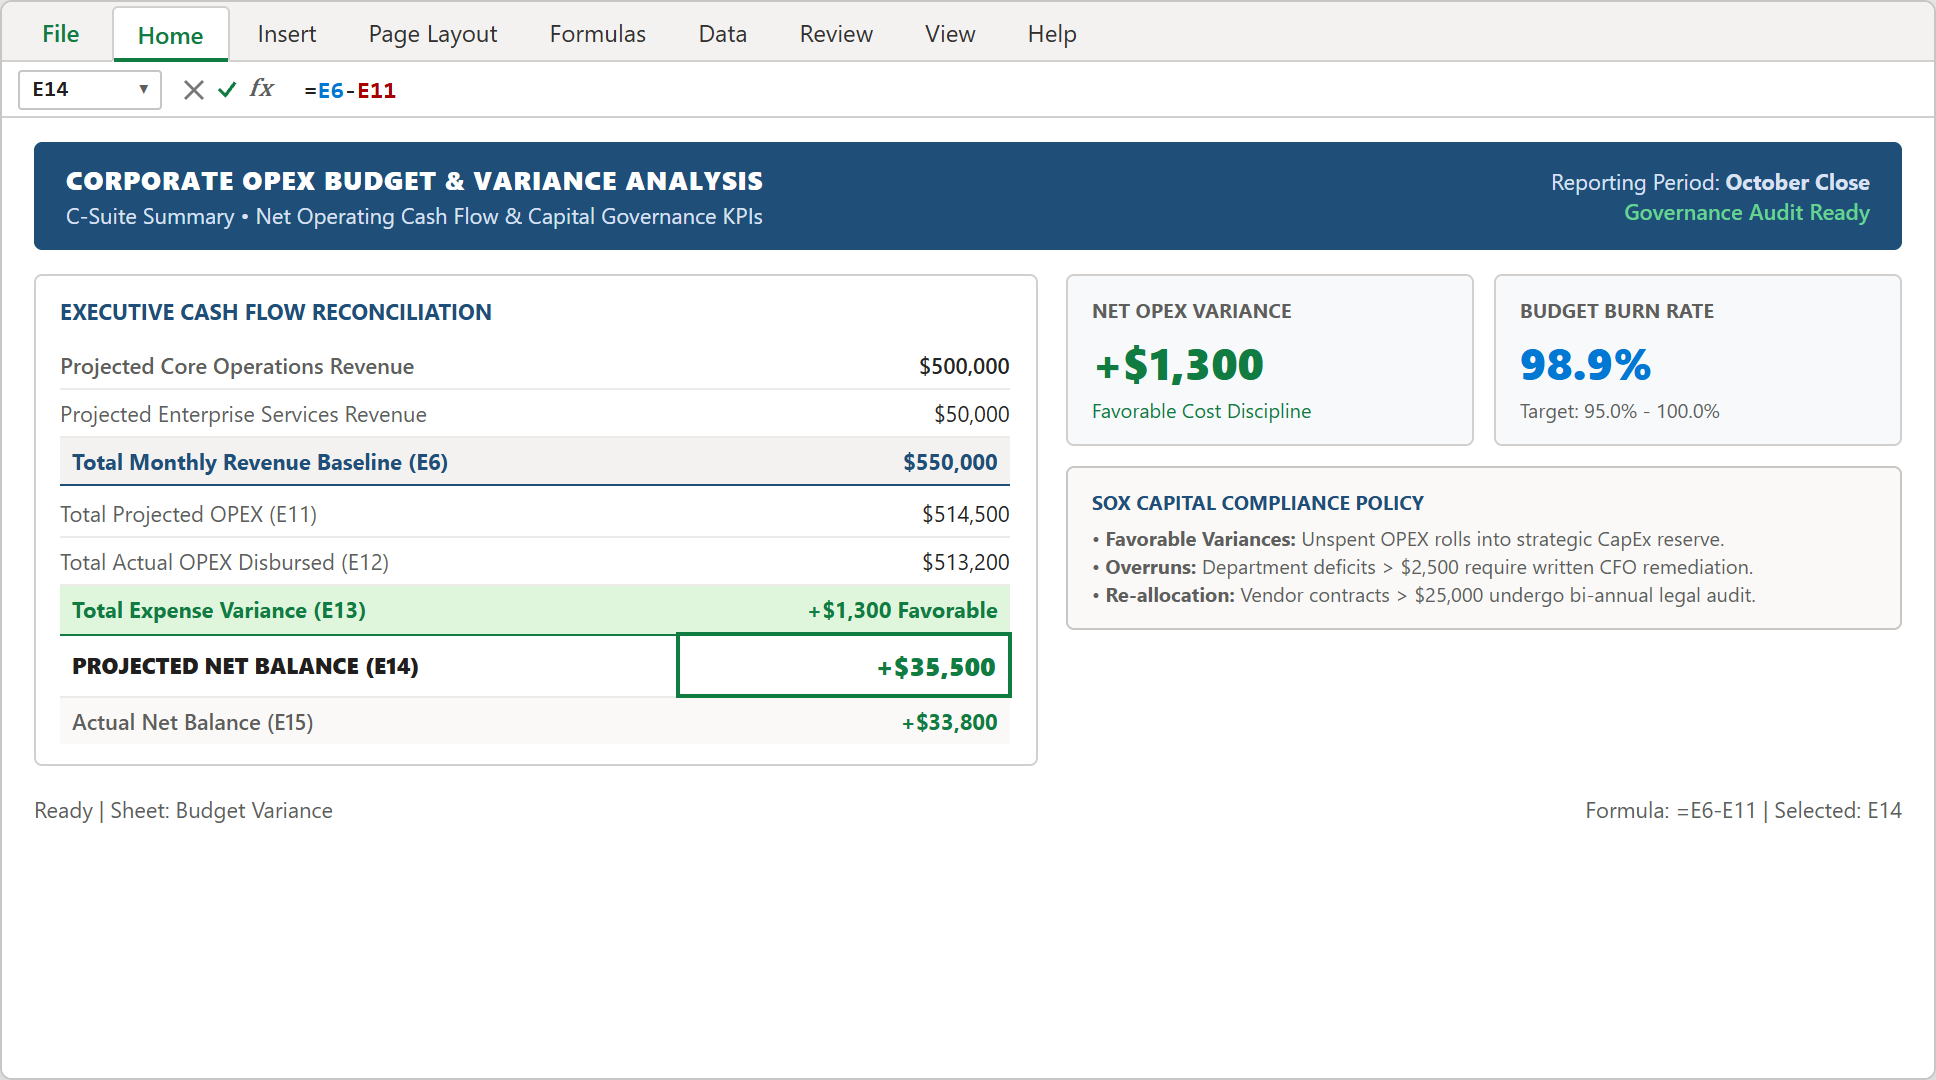
Step 3: Executive Cash Flow Reconciliation in cell E14 (=E6-E11) alongside top-line burn rate scorecards and SOX policy guidelines.
4Step 4: Visualizing Overrun Severity with In-Cell Bi-Directional Data Bars
To allow executives to digest cost performance instantly, we replace monochrome figures with in-cell bi-directional data bars that graphically highlight surplus vs deficit magnitudes.
Highlight variance cells E19:E28, navigate to Home > Conditional Formatting > Data Bars > More Rules. Under Format Style, select Data Bar. Set the positive bar color to solid green (#107C41) and click the Negative Value and Axis settings to set negative bars to solid red (#A80000) originating from a centered vertical axis.
Click OK. Now, favorable savings like AWS (+$2,200) extend clean green bars to the right, while alarming overruns like Contractor Engineers (-$2,200) and Software Licenses (-$1,400) extend bright red warning bars to the left.
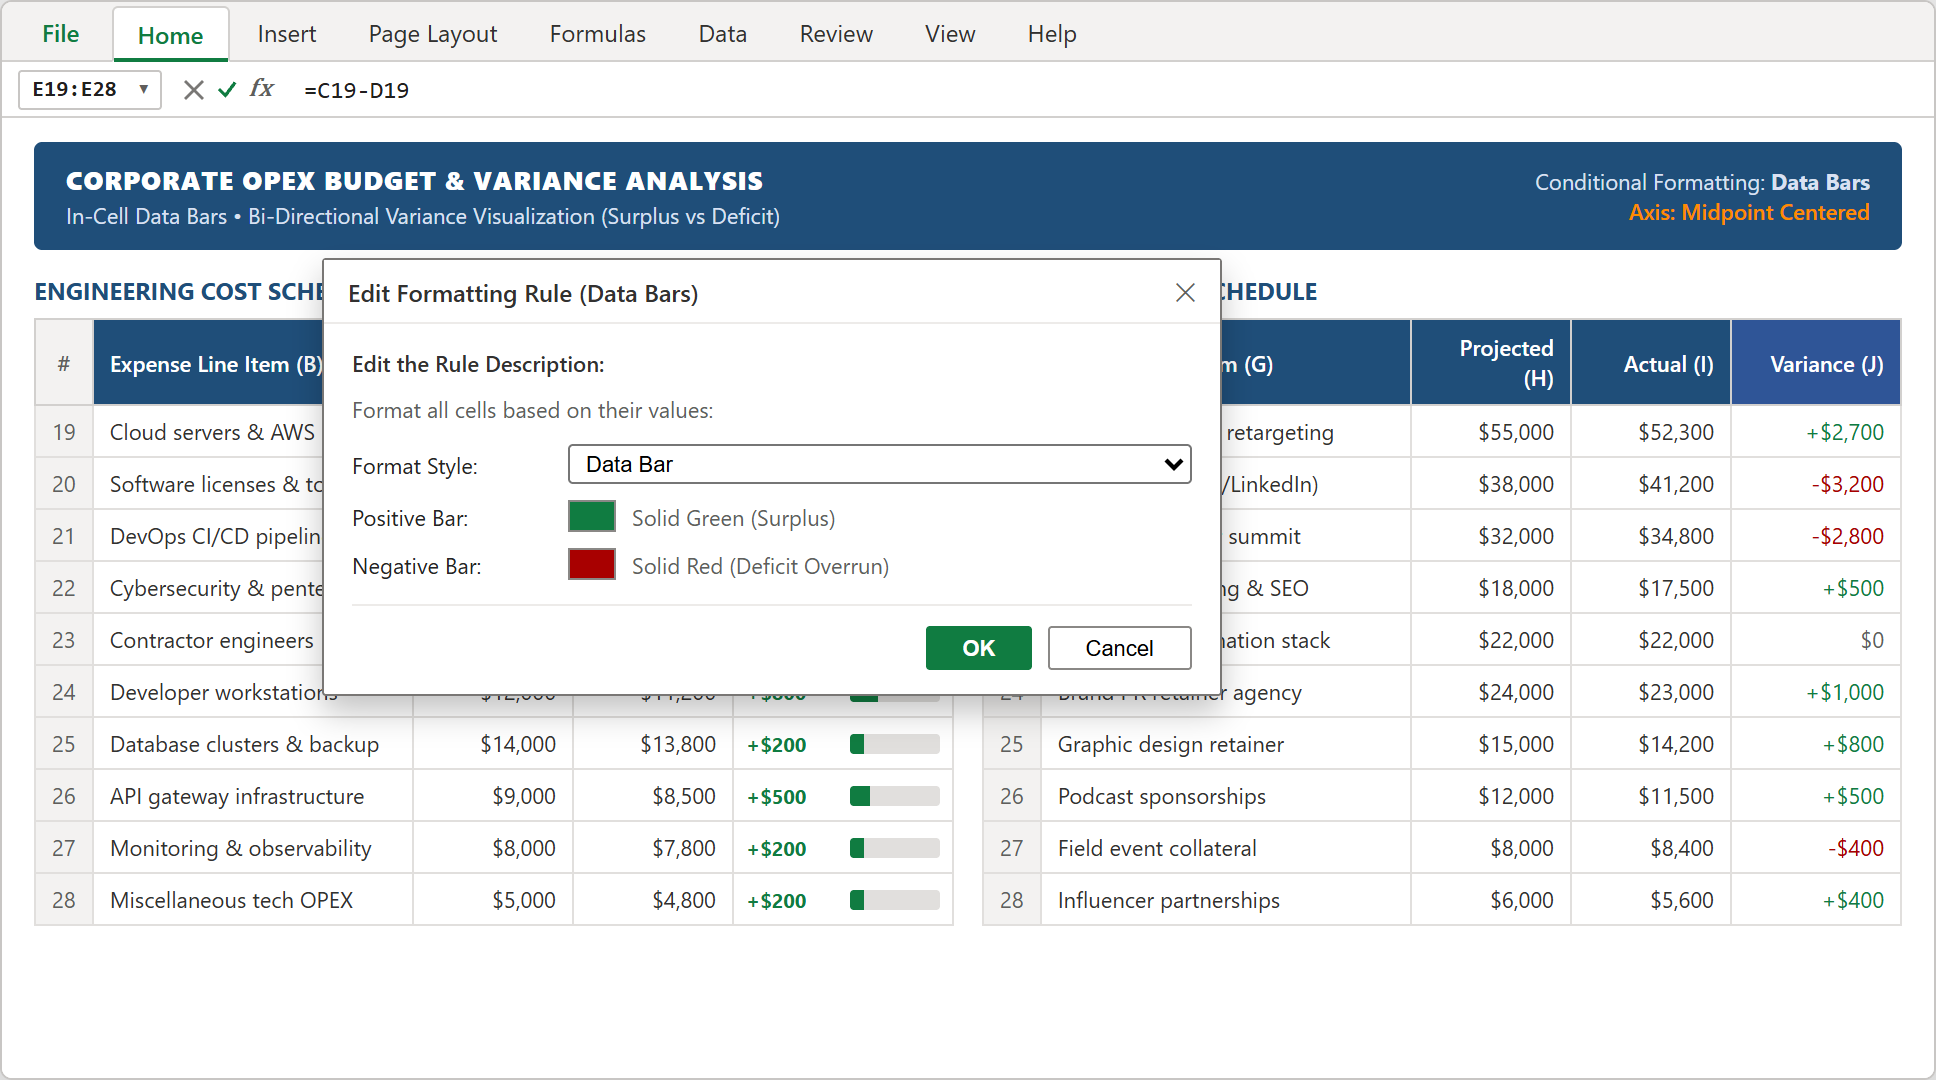
Step 4: The Edit Formatting Rule dialog configuring bi-directional green (surplus) and red (deficit) in-cell data bars.
5Step 5: Applying Boardroom Custom Number Formatting with Semantic Colors
Our final polish applies institutional presentation standards using Excel custom number formatting codes.
Select the variance range E19:E28, press Ctrl + 1 to open the Format Cells dialog, and choose Custom. In the Type box, enter the four-segment format string: [Color10]+$#,##0;[Red]-$#,##0;"$0".
This syntax directs Excel to display positive variances with an explicit plus sign in deep emerald green ([Color10]), negative overruns with a minus sign in crisp red ([Red]), and exact zero balances in neutral gray. Paired with percentage drift metrics in column F, your financial schedules achieve executive-ready boardroom polish.
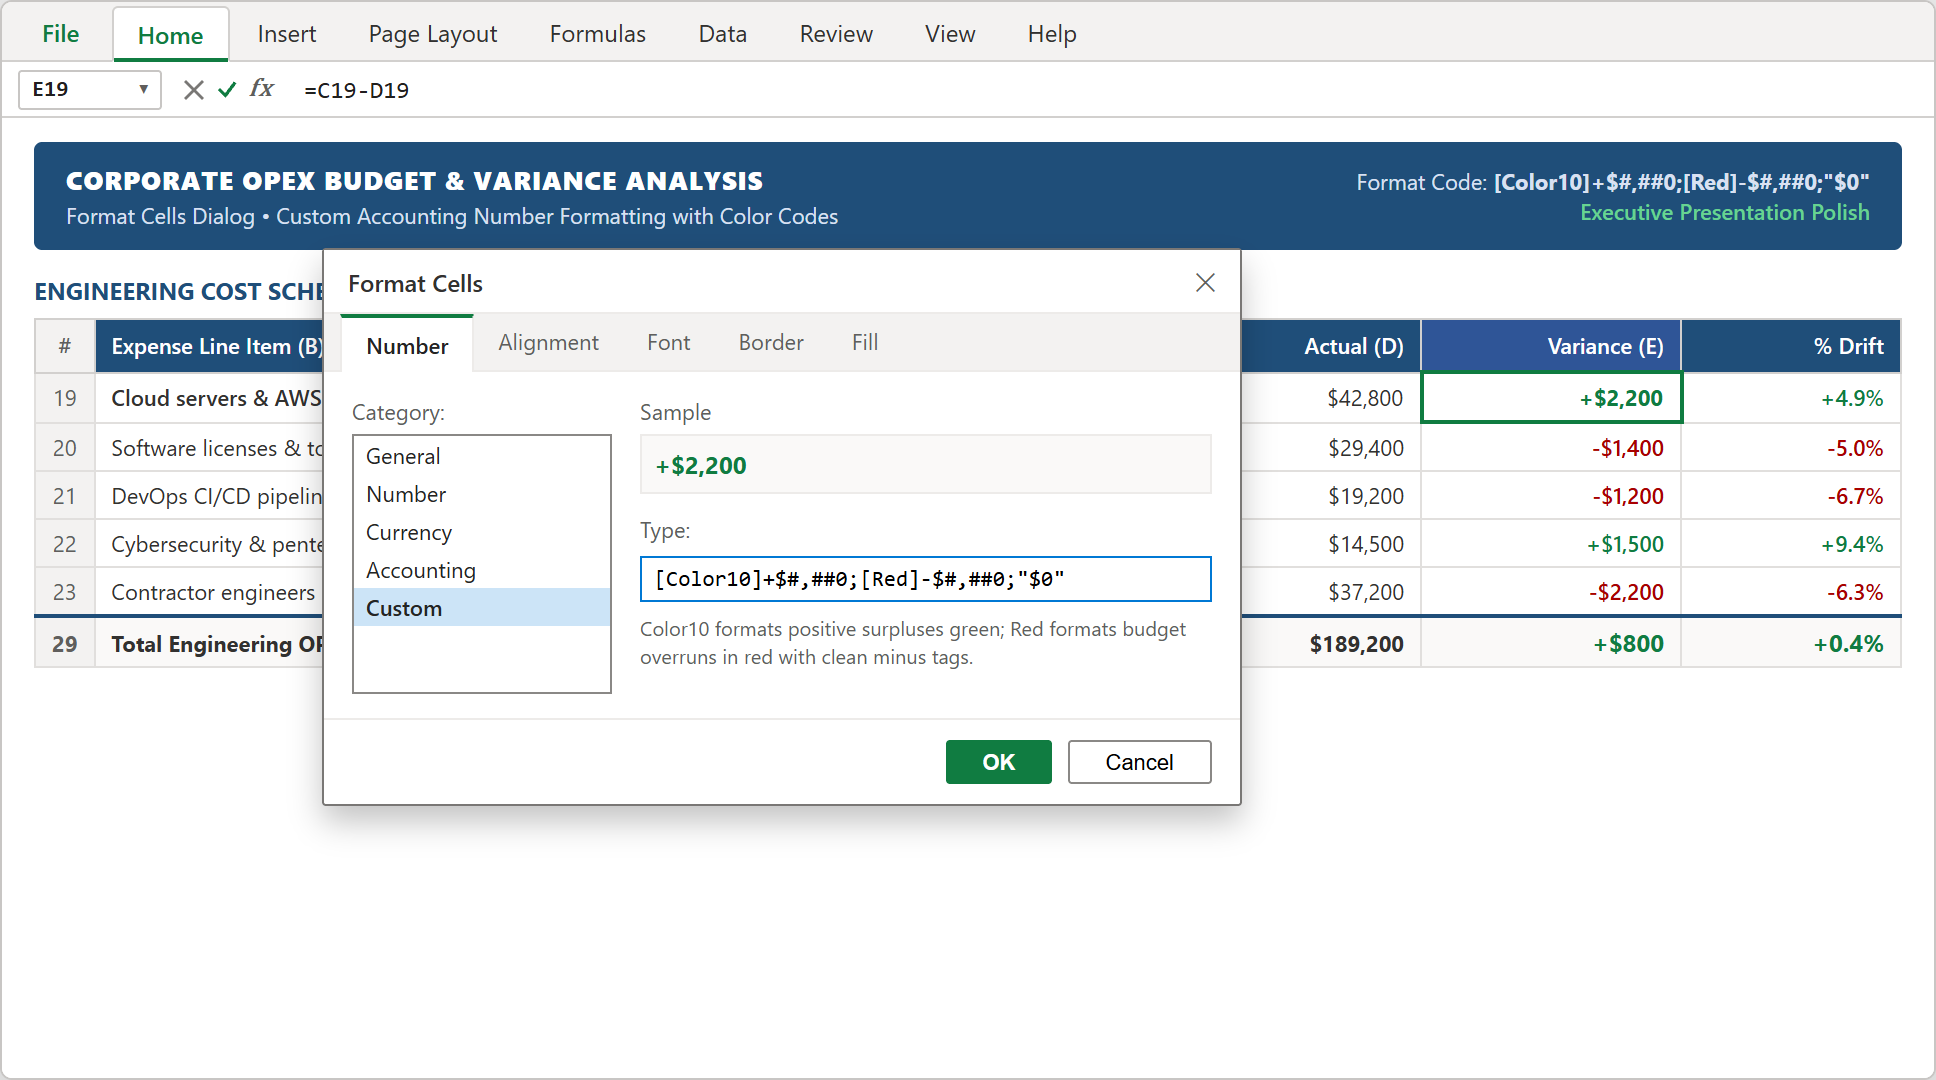
Step 5: The Format Cells dialog setting the custom color-coded accounting mask [Color10]+$#,##0;[Red]-$#,##0;"$0".
Executive FP&A Playbook: SOX Governance & Capital Allocation Discipline
A sophisticated financial model is only effective when anchored by institutional corporate governance. Implement these four operational protocols to maintain capital rigor across your organization:
1. The "No Slush Fund" Policy: Under SOX capital compliance guidelines, favorable variances (unspent OPEX) must automatically roll back into centralized corporate treasury or strategic CapEx reserves. Never allow department heads to treat mid-year savings as discretionary slush funds for unauthorized year-end splurges.
2. Mandatory CFO Remediation Memos: Establish an institutional materiality threshold: any department line item that exceeds authorized budget by more than $2,500 or 5.0% requires a formal written remediation memo submitted to the CFO within three business days of month-end close.
3. Mid-Month Re-Allocation Deadlines: Cost center budget re-allocations (shifting unspent headcount budget to software tools) must be finalized prior to the 15th calendar day of the active month to maintain model integrity.
4. Bi-Annual Vendor Audits: All recurring vendor retainers and cloud infrastructure commitments exceeding $25,000 annually undergo bi-annual competitive procurement reviews to prevent creep in contract costs.
By integrating these executive rules with your Microsoft Excel variance model, your finance team evolves from reactive bookkeepers into strategic capital advisors.

Spreadsheet educator and web developer passionate about hands-on interactive spreadsheet practice.
Related Practical Exercises
Explore more hands-on spreadsheet models with downloadable practice workbooks.
 Finance
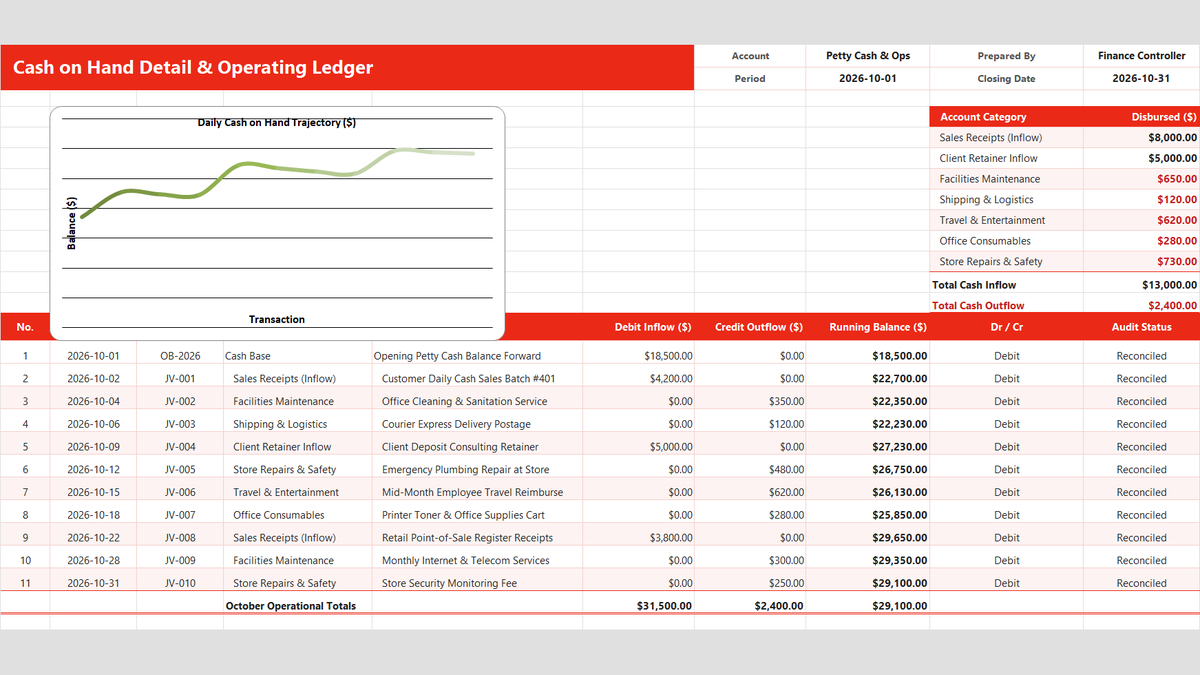
Daily Cash Book Ledger Excel Template
Keep track of physical cash, register receipts, and petty cash disbursements in Microsoft Excel. Build a daily cash book featuring category dropdowns with Data Validation, live running balance calculations, negative cash overdraft alerts, and month-end category expense rollups.
 Finance
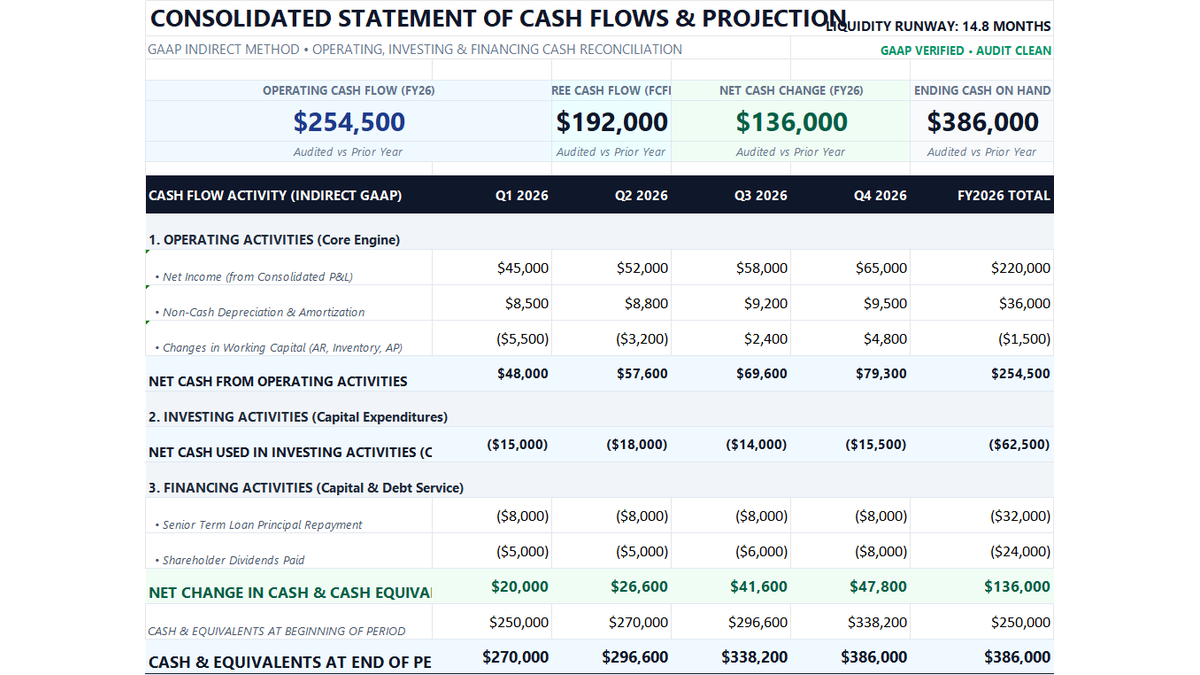
12-Month Cash Flow Statement Excel Template
Learn how to construct a GAAP-compliant 12-month indirect cash flow statement in Microsoft Excel featuring working capital rollforwards, Free Cash Flow to Firm (FCFF), liquidity runway defense, and executive treasury scorecards.
 Finance
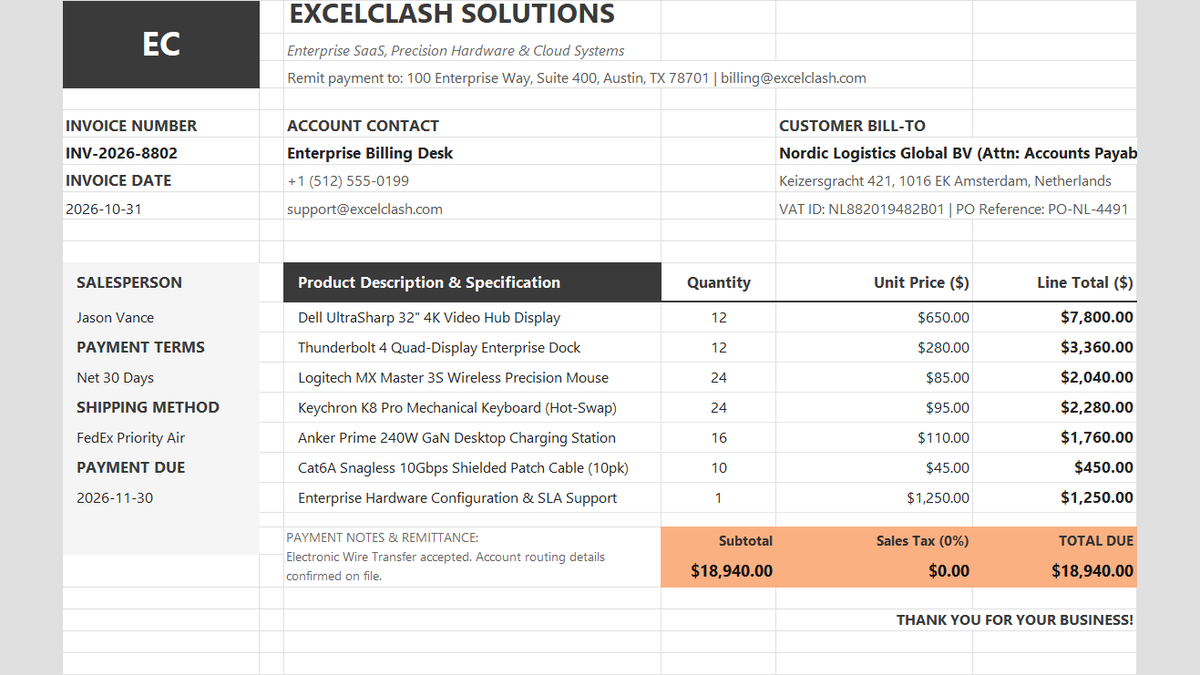
Commercial Sales Invoice Calculator Excel Template
Tired of billing disputes and calculation errors holding up payments? Learn how to build a clean Commercial Sales Invoice in Excel that automatically computes line item subtotals, reconciles sales taxes, and presents payment terms clearly for corporate finance teams.
 Sales
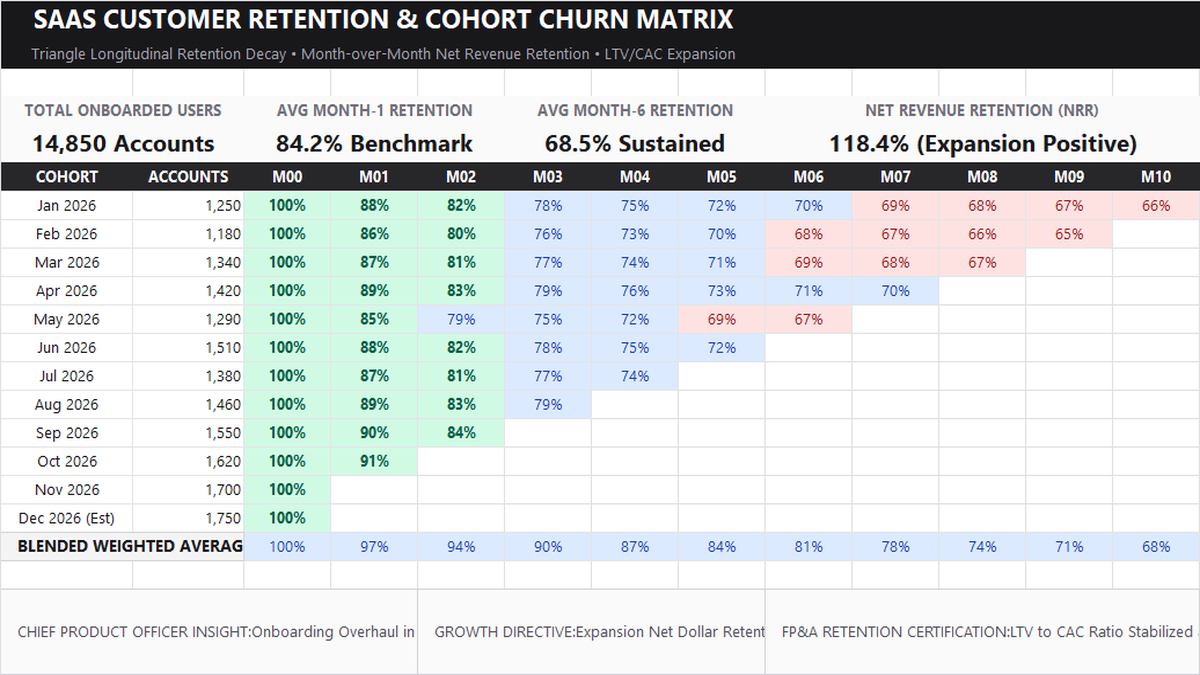
Customer Retention Cohort Analysis Excel Template
Learn SaaS subscription cohort modeling in Microsoft Excel. Build a triangular longitudinal customer retention matrix, calculate Month-1 through Month-10 decay rates, configure multi-color gradient heatmaps, and track executive LTV/CAC expansion metrics.
 Operations
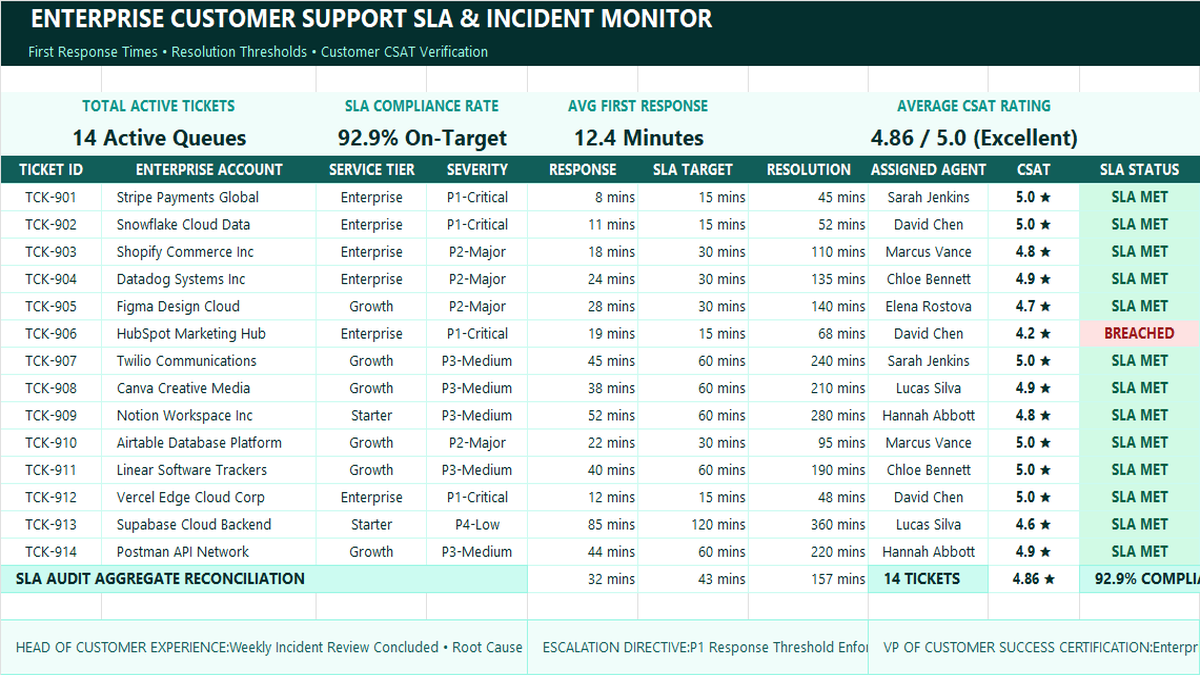
Customer Support SLA Tracker Excel Template
Learn how to build an enterprise customer support SLA tracker in Microsoft Excel featuring severity-based response thresholds, automated breach alerts, team velocity metrics, and CSAT satisfaction scorecards.
Discussion
Ask questions, share formula tips, or discuss alternative approaches with fellow spreadsheet builders.
Loading discussion...