Every Vice President of Sales and Revenue Operations leader knows the anxiety of quarterly board reviews: when actual closed bookings deviate from forecasts by more than 10%, executive trust evaporates. Unreliable forecasts lead to poorly timed hiring, frozen marketing budgets, and compromised cash positions.
Modern revenue planning requires moving away from static gut-feel estimations into dynamic variance pacing models. By benchmarking contracted sales targets against actual bookings by quarter and month, commercial teams detect pipeline slippage early enough to execute corrective promotional campaigns.
In this comprehensive tutorial, we will construct an enterprise Annual Sales Forecasting & Variance Dashboard from scratch. You will apply institutional currency formatting, calculate net variance and attainment ratios, automate performance classifications with logical IF ladders, and build dual executive charts to present clean, boardroom-ready commercial intelligence.
Why Gut-Feel Sales Targets Destroy Boardroom Credibility
Commercial revenue forecasting is the operational bridge connecting executive strategy to daily sales execution. When sales leaders assign quotas without structured seasonality curves, teams frequently suffer end-of-year shortfalls caused by unrealistic fourth-quarter hockey-stick assumptions.
In mature enterprise organizations, Revenue Operations (RevOps) enforces three rigorous forecast disciplines: establishing auditable baseline targets, tracking monthly pacing run-rates, and measuring net dollar variance after each close cycle.
The Quota Sandbagging Dilemma: When regional sales reps intentionally depress their annual targets to secure easier commission bonuses, corporate FP&A models under-allocate working capital. An automated variance dashboard creates total visibility, immediately flagging quarters where actuals consistently outpace targets by excessive margins.
Commercial Blueprint: Quota Allocations & Ledger Architecture
Our production workbook is organized into three synchronized layers: top-level executive KPI cards (rows 4 to 6), the quarterly commercial performance table (rows 7 to 12), and the bottom visualization canvas displaying dual analytical charts.
The model balances $2,500,000 in annual target quota against $2,577,000 in actual closed bookings, delivering an overall commercial attainment rate of 103.1%.
Review the schema below to understand how the sales ledger columns function across ranges B7 through G12.
| Col | Field Name | Type | Format | Operational Role |
|---|---|---|---|---|
| B | Sales Quarter | Text String | General | Calendar business quarter (`Q1 (Jan - Mar)` through `Q4 (Oct - Dec)`). |
| C | Sales Target | Currency Integer | $#,##0 | Contracted board-approved quarterly revenue quota allocation. |
| D | Actual Bookings | Currency Integer | $#,##0 | Closed-won GAAP recognized revenue collected during the quarter. |
| E | Variance ($) | Calculated Currency | +$#,##0;-$#,##0 | Dollar over/under performance relative to quota (`=D8-C8`). |
| F | Attain % | Calculated Ratio | 0.0% | Proportional quota realization percentage (`=D8/C8`). |
| G | Performance | Calculated Category | Text | Automated executive status: Exceeded Quota, Met Target, or Below Quota. |
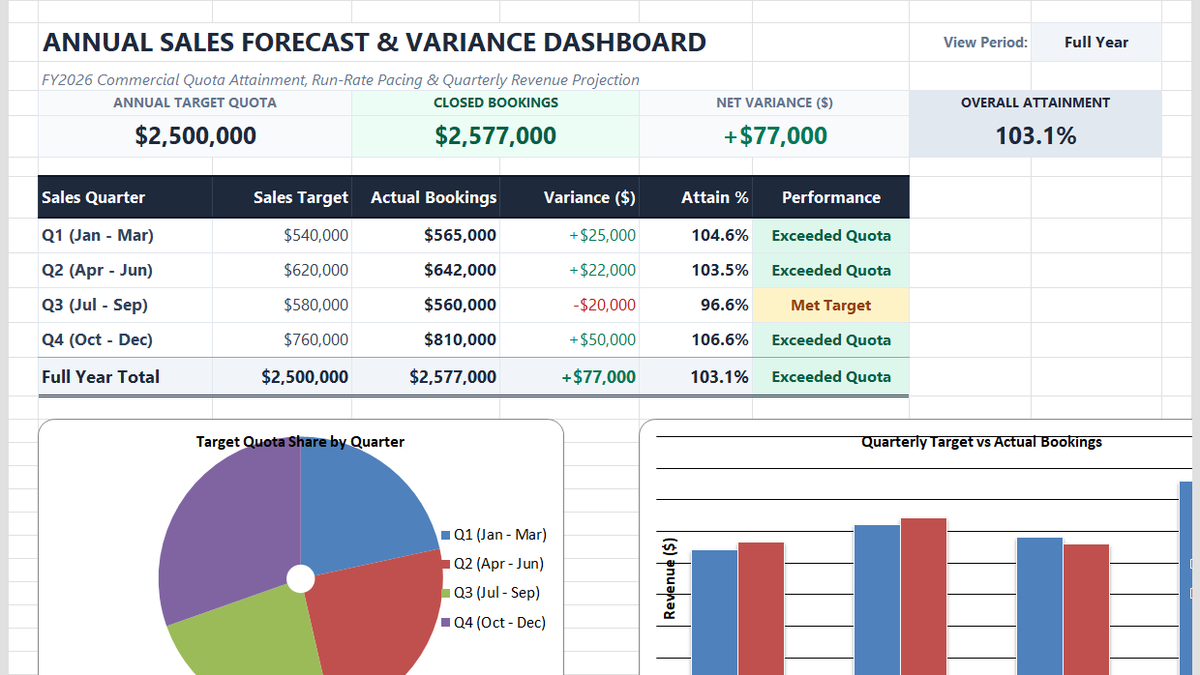
Workbook Blueprint: The Annual Sales Forecast & Variance Dashboard featuring top executive KPI cards, quarterly attainment tracking, and dual visual charts.
Now that the architecture is locked in, let us build each calculation and chart step by step.
Step-by-Step Variance Engine: Formatting & Formulas (Action vs Result)
Follow this structured implementation workflow to format the raw financial figures, calculate variance margins, and automate performance status tracking.
1Action: Applying Currency Formatting with Format Cells
Raw spreadsheet integers like 540000 or 620000 look unrefined and hinder rapid executive interpretation during financial presentations.
Highlight target and actual columns across range C8:D12, then press Ctrl + 1 to launch the native Format Cells dialog box.
Under the Number tab, select Currency. Confirm Decimal places is set to 0 and Symbol is set to $ English (United States). Click OK.
Excel instantly formats the numbers with comma thousand-separators and standard dollar signs, displaying crystal-clear values like $540,000.
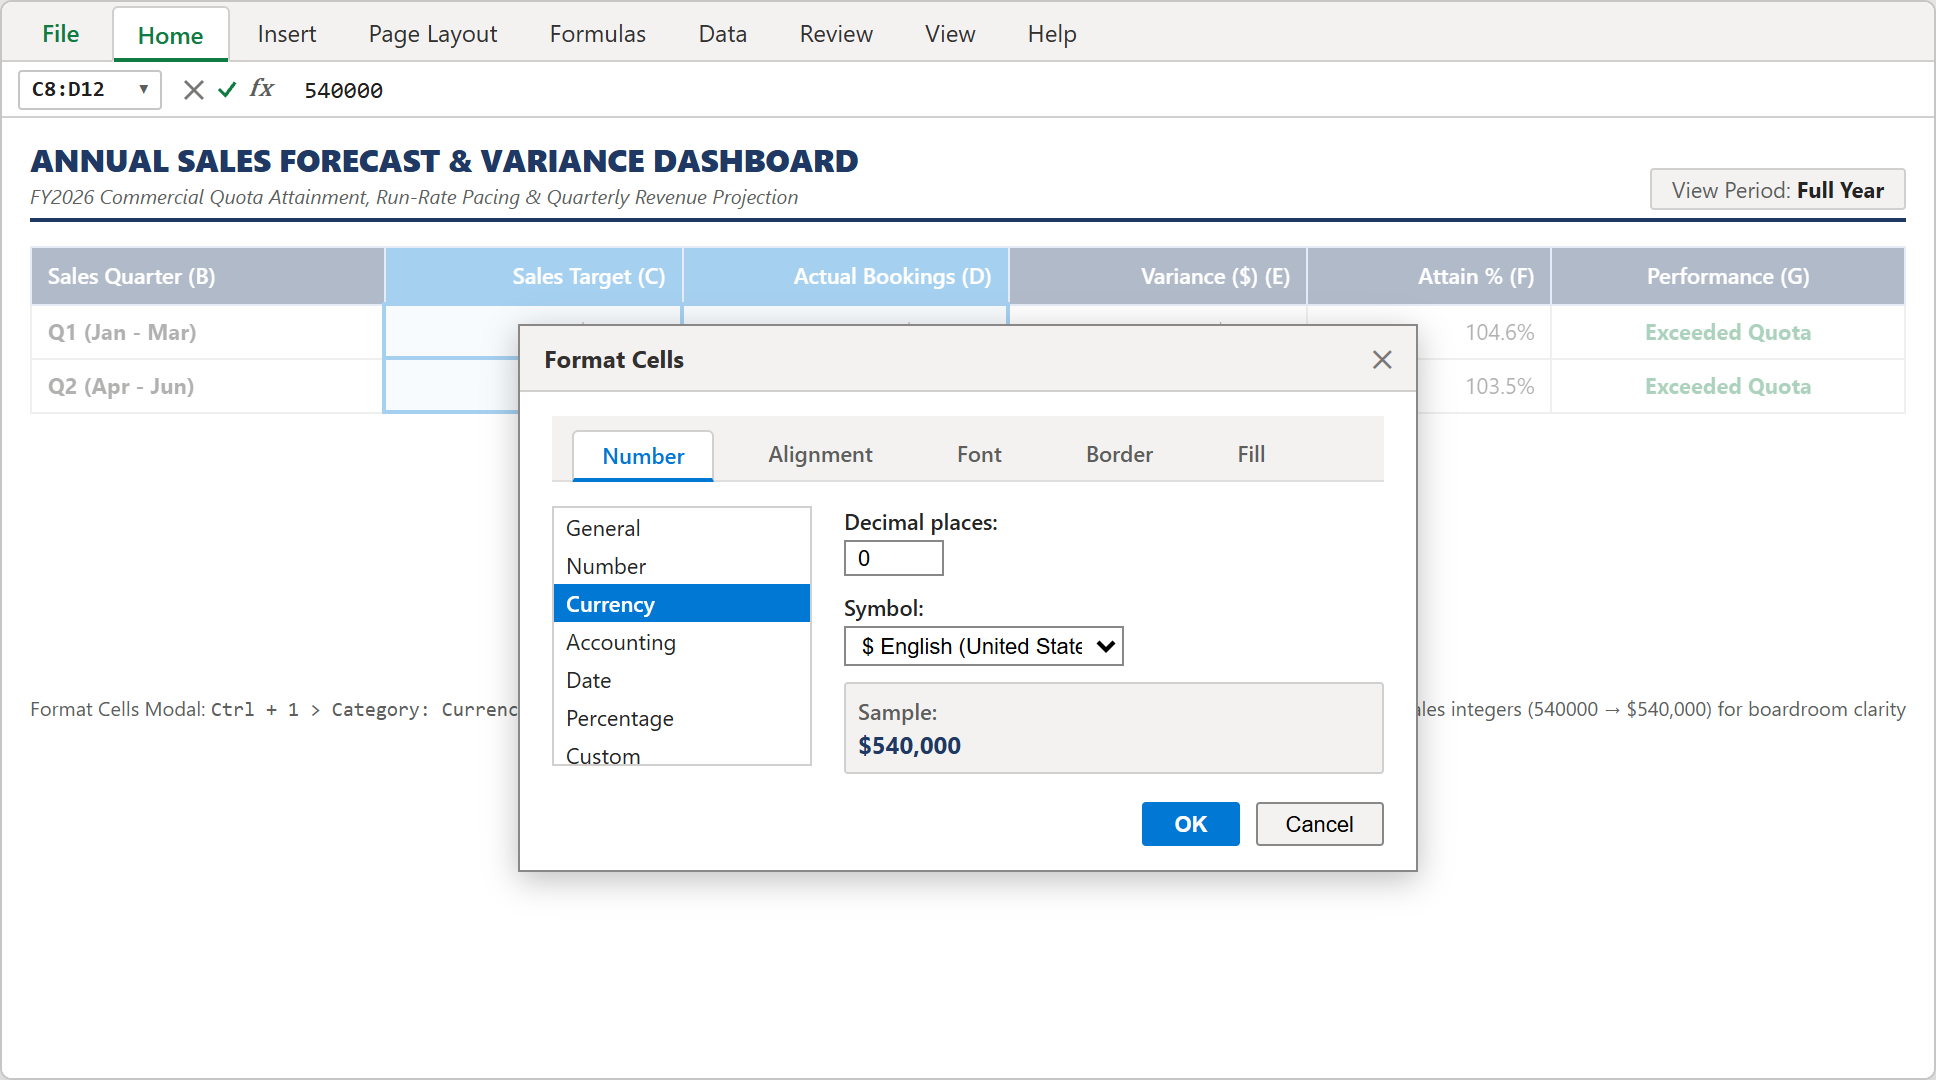
Step 1 [Action]: Applying Currency formatting ($#,##0) with zero decimal places via the native Format Cells modal dialog.
2Action: Calculating Dollar Variance and Attainment %
Measuring forecast accuracy requires computing both the absolute monetary variance and the normalized attainment ratio.
Select cell E8 to compute Q1 dollar variance. Type: =D8-C8 and press Enter. Excel calculates $565,000 - $540,000, returning +$25,000.
Next, click cell F8 to calculate quota attainment. Type: =D8/C8. Format this cell as Percentage with one decimal place (Ctrl + Shift + %), evaluating to 104.6%.
Highlight cells E8:F8 and drag the fill handle down through row 12. Notice how Q3 immediately highlights a deficit of -$20,000 (96.6% attainment).
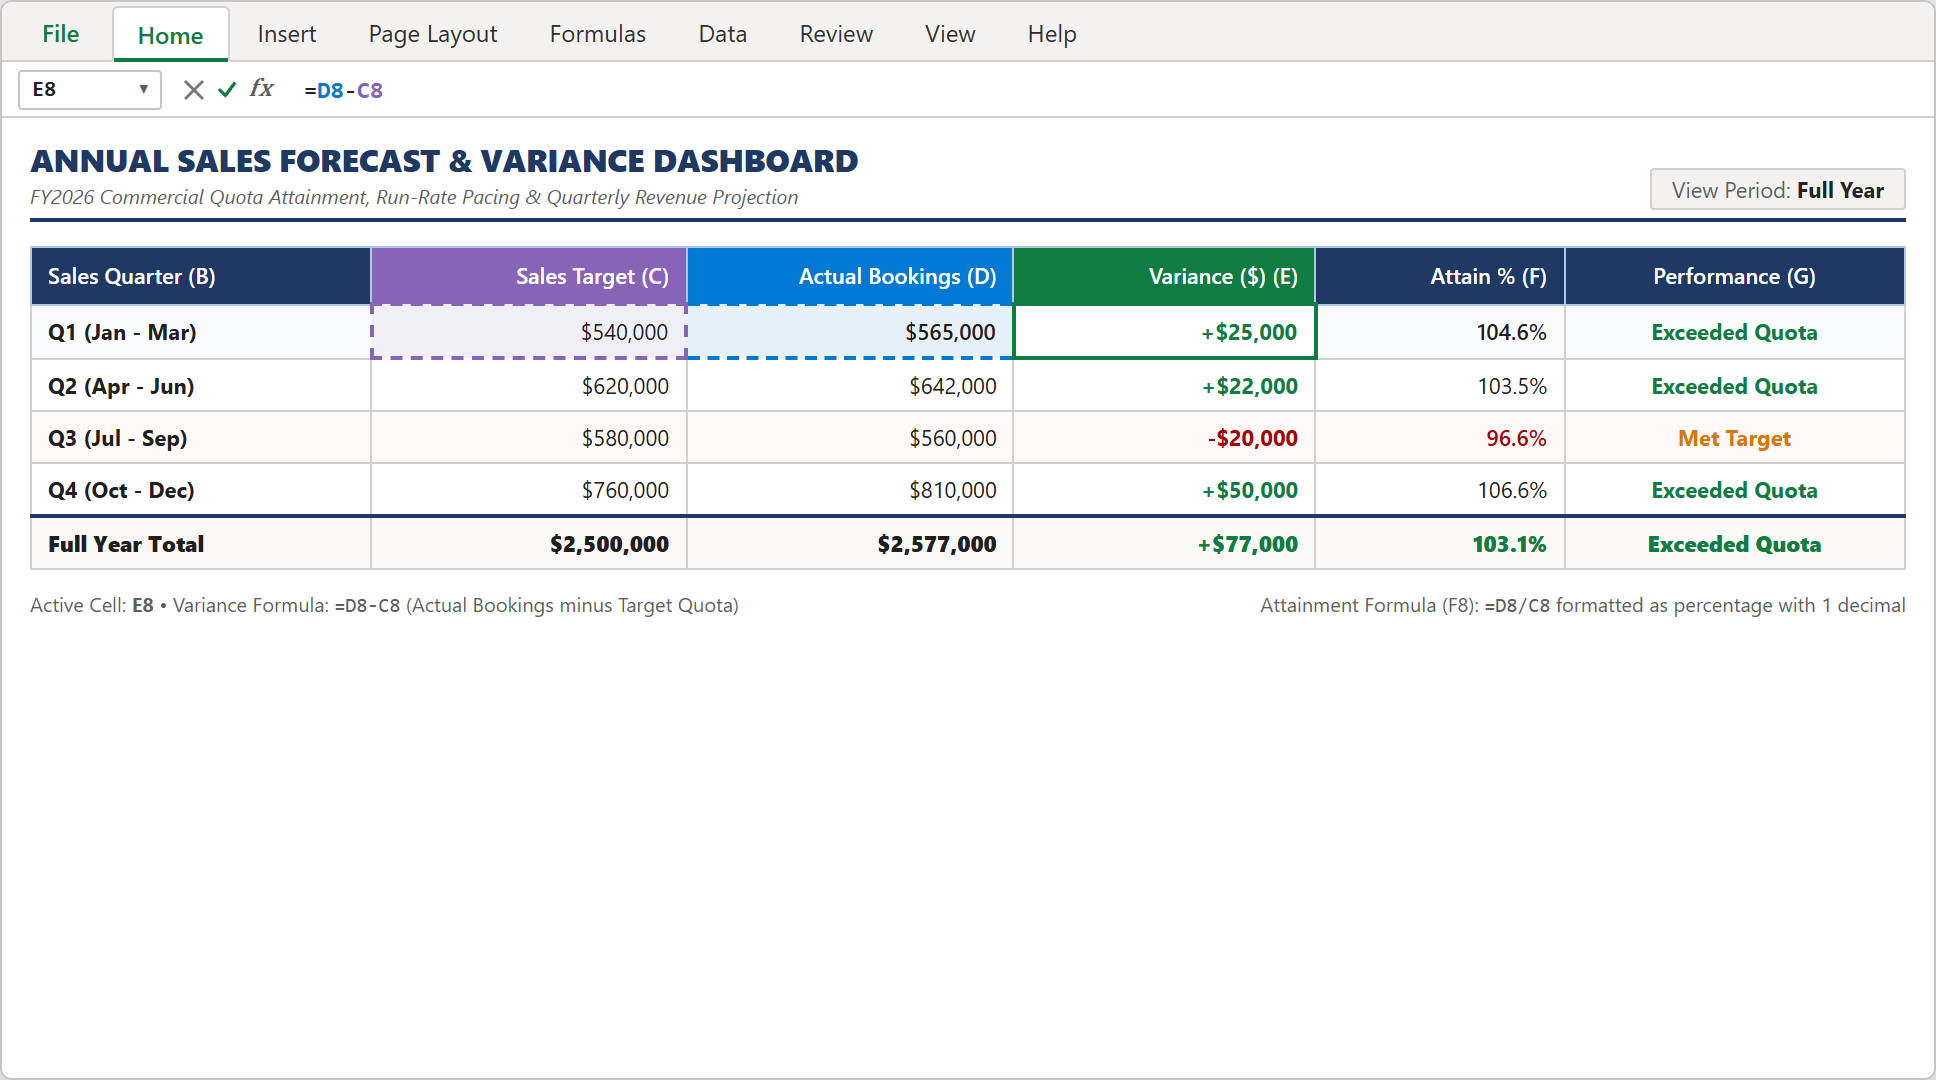
Step 2 [Action]: Cell E8 calculating net variance with formula =D8-C8 and cell F8 calculating attainment % with =D8/C8.
3Result: Automatic Performance Status Classification
Rather than manually reviewing percentages, we automate executive performance tags using a logical nested IF ladder.
In cell G8, enter the formula: =IF(F8>=1.0,"Exceeded Quota",IF(F8>=0.95,"Met Target","Below Quota")).
When attainment is ≥ 100%, the status resolves to "Exceeded Quota" (highlighted with soft green fill). Between 95% and 99.9%, it displays "Met Target" (amber fill), while lower values flag "Below Quota".
Full year performance in cell G12 evaluates to Exceeded Quota, delivering an objective commercial summary for executive reporting.
Designing Executive Charts & The Boardroom Dashboard
Numbers in tables inform accountants, but compelling visuals persuade board members. We will construct a clustered column comparison chart and a target quota distribution pie chart.
4Action: Inserting the Quarterly Target vs Actual Chart
A clustered column chart provides the clearest visual comparison of budgeted targets against actual bookings across all four quarters.
Select the source data in range B7:D11 (excluding the Full Year total row). Navigate to Insert > Charts > Insert Column or Bar Chart.
From the 2-D Column group, click Clustered Column. Excel instantly generates the comparison canvas with blue bars for targets and orange bars for actual bookings.
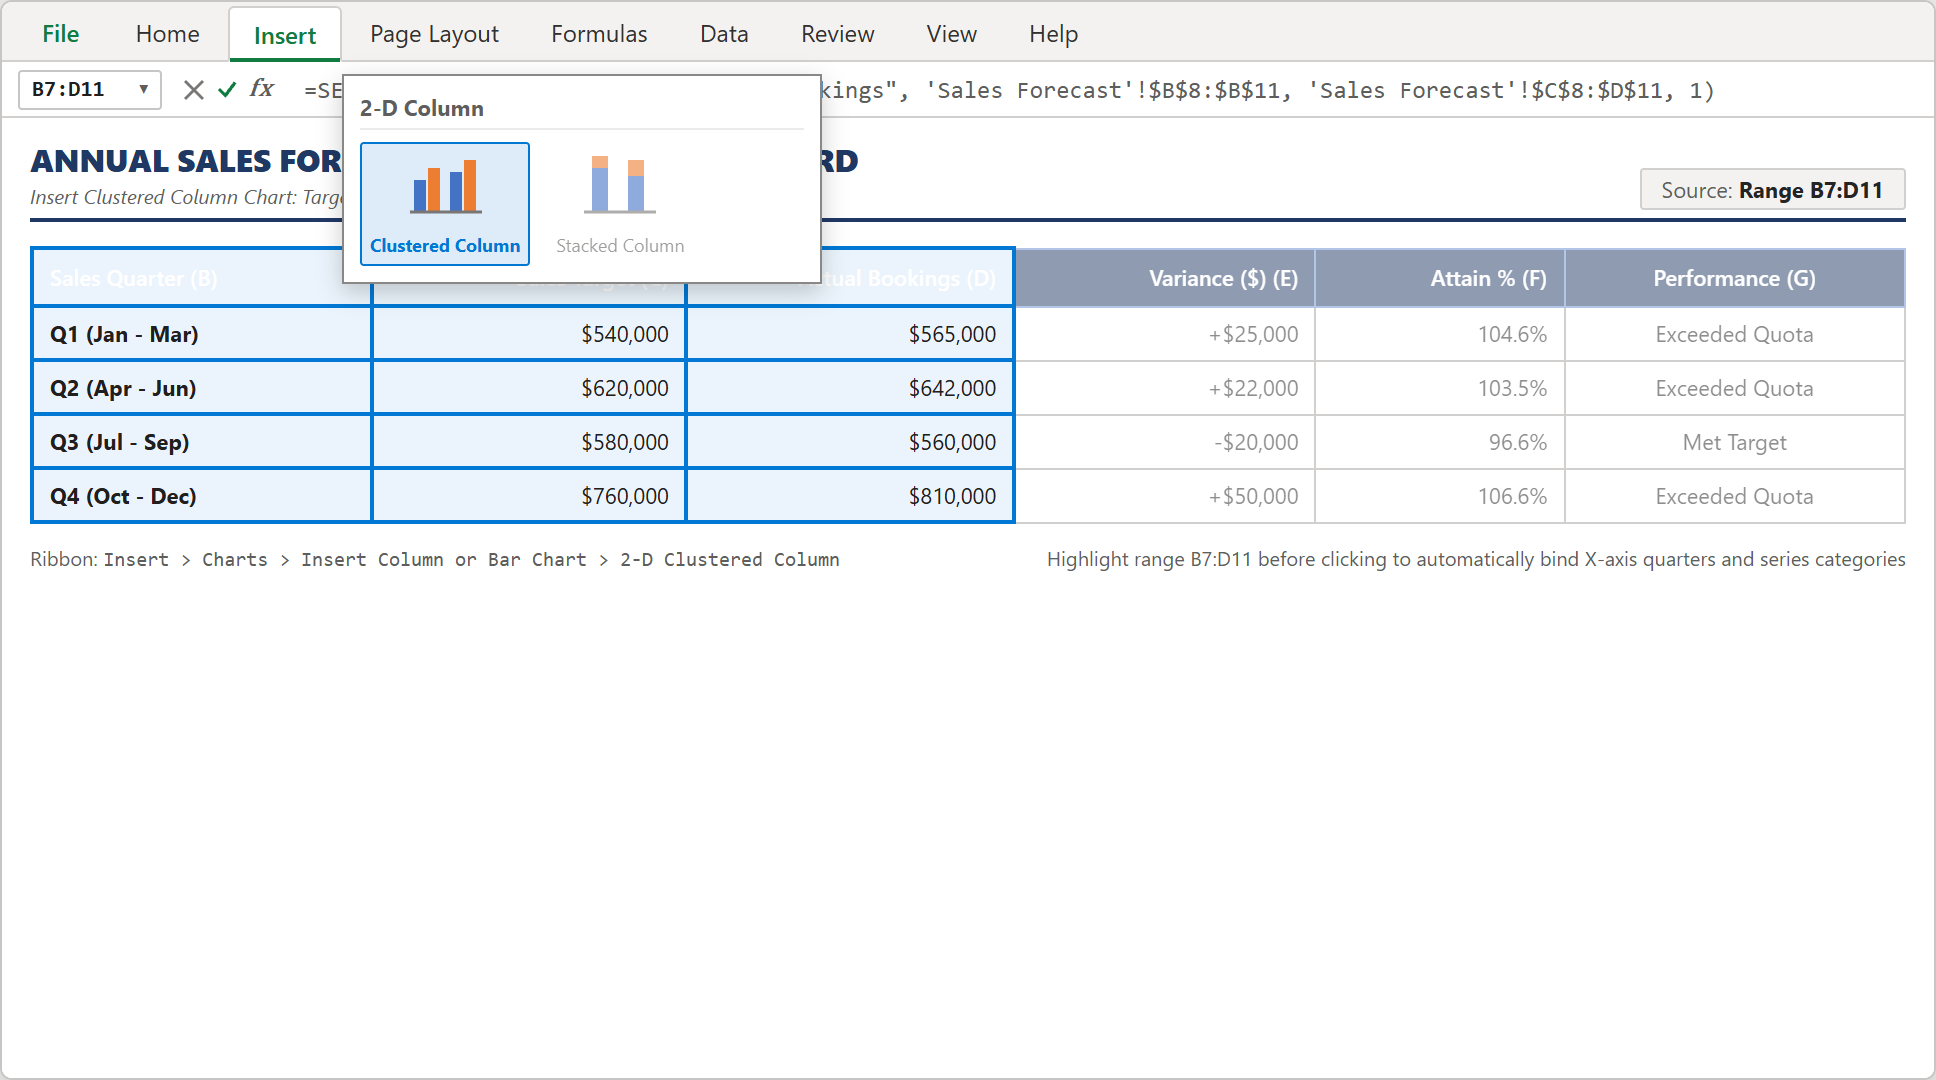
Step 3 [Action]: Selecting range B7:D11 and clicking Clustered Column from the native Insert Charts ribbon flyout.
5Action: Customizing Series Gap Width & Chart Colors
Default Excel charts often have skinny columns and excessive empty space. We refine the visual hierarchy using the Format Data Series taskpane.
Double-click any actual bookings column to open the right-hand Format Data Series taskpane.
Under Series Options, set Series Overlap to 0% and reduce Gap Width to 150% for solid, prominent columns.
Under Fill & Line, confirm the actual bookings series uses solid corporate orange (#C55A11) to contrast against target blue (#41719C).
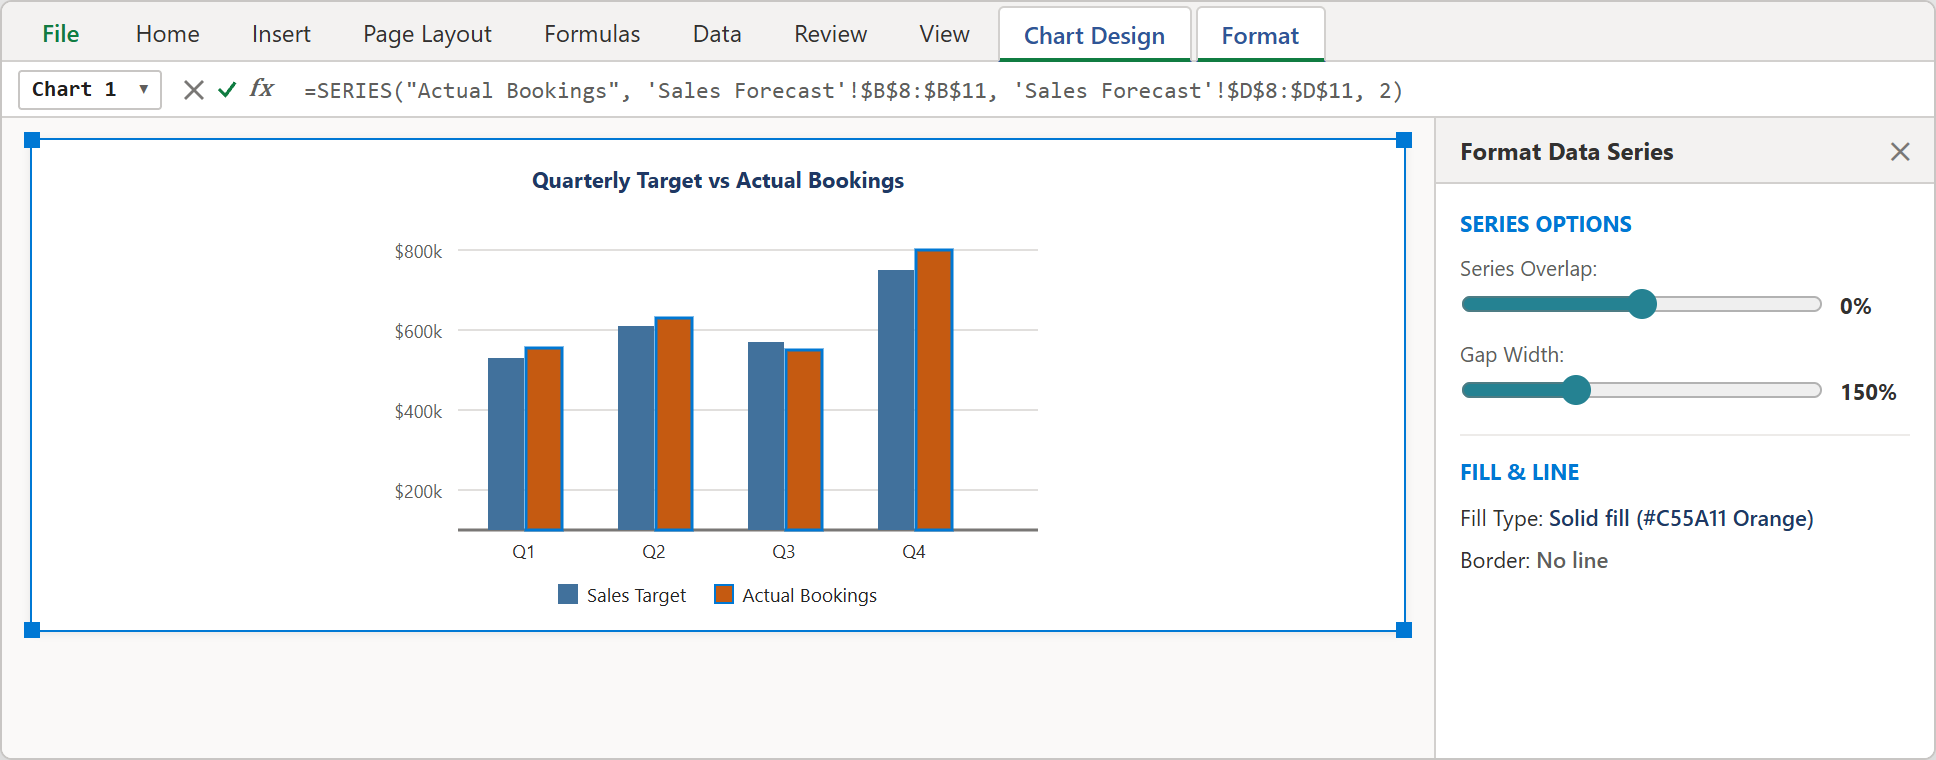
Step 4 [Action]: Adjusting Gap Width to 150% and setting custom corporate fill colors in the right-side taskpane.
6Result: Assembling the Final Executive Command Center
Combine your calculations with top summary scorecards and the Target Quota Share pie chart to finalize the command center.
The dashboard displays four top KPI cards: Annual Target Quota ($2,500,000), Closed Bookings ($2,577,000), Net Variance (+$77,000), and Overall Attainment (103.1%).
Side-by-side charts allow leadership to verify quarterly pacing at a glance, confirming that strong Q4 performance ($810,000 closed vs $760,000 target) successfully erased Q3's minor deficit.
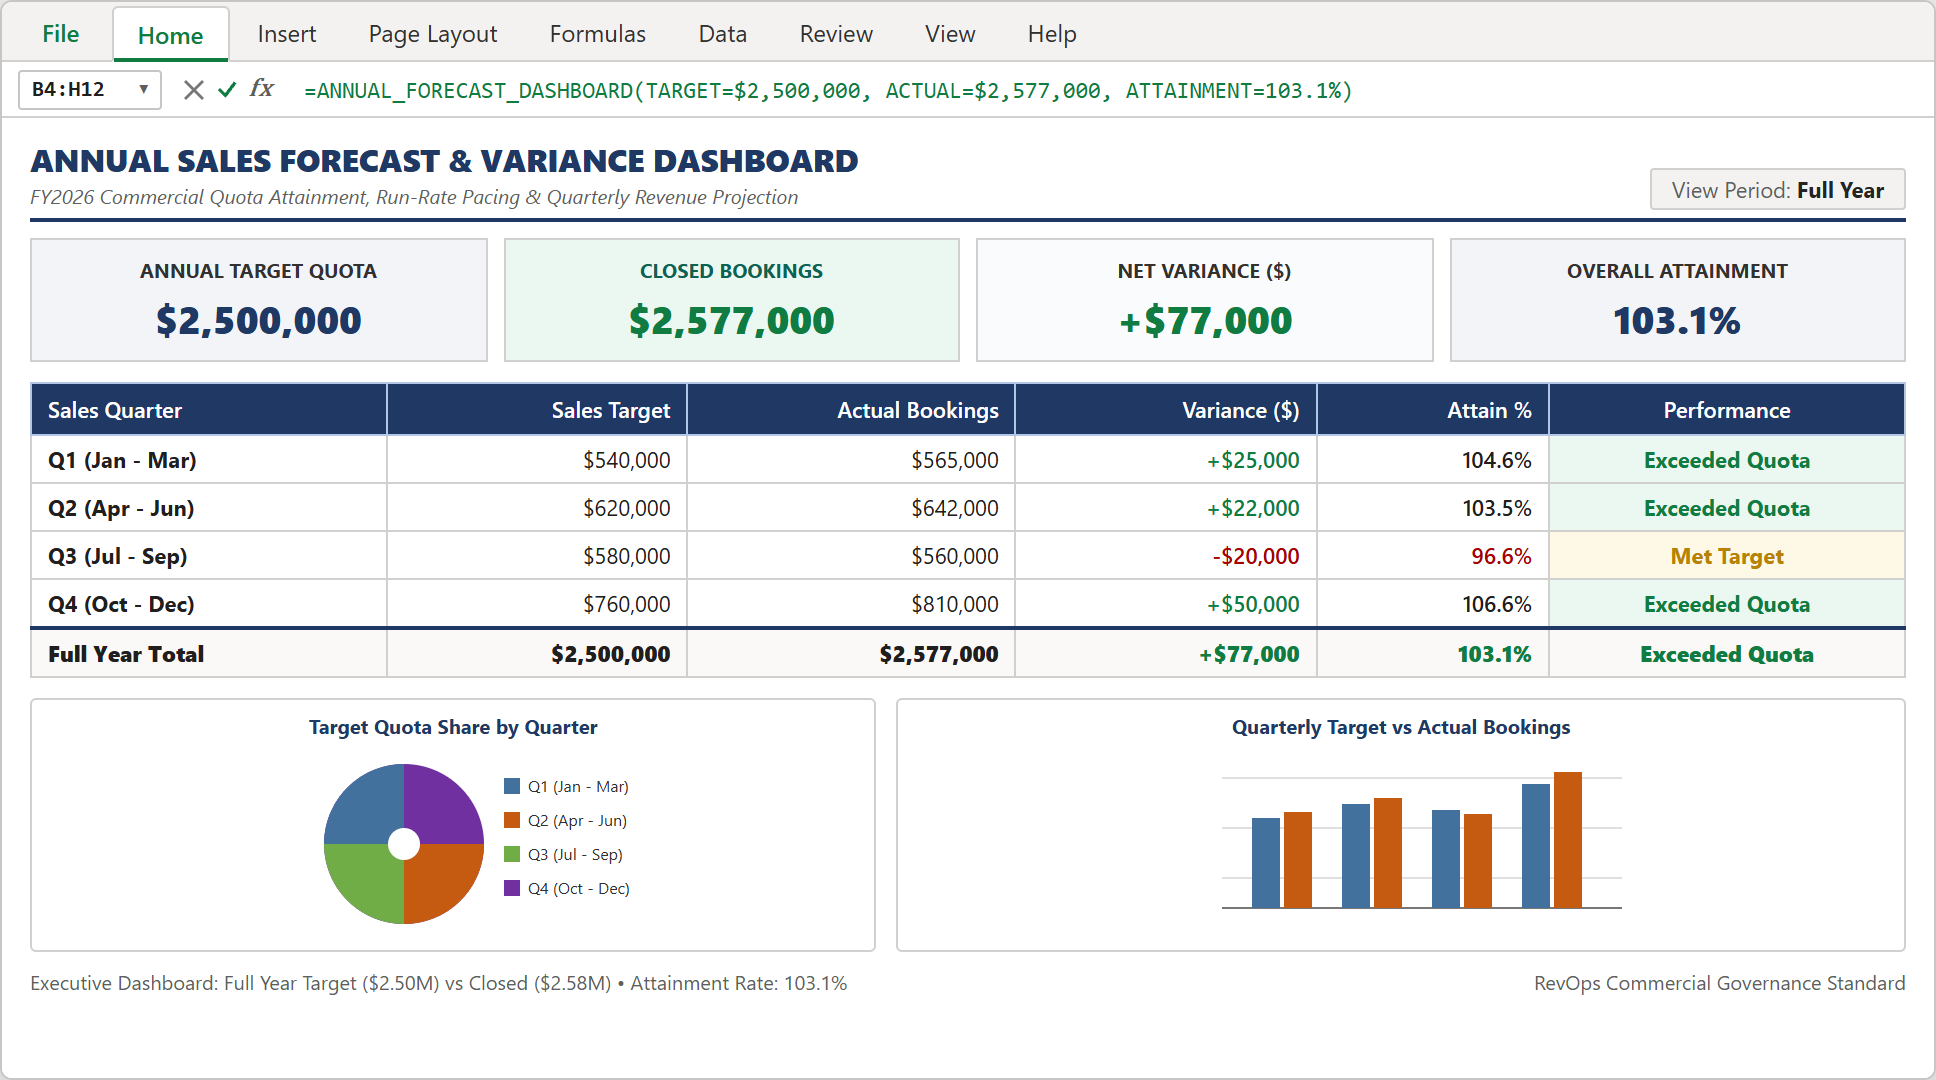
Step 5 [Result]: Complete Annual Sales Forecast & Variance Dashboard featuring top KPI scorecards, quarterly attainment ledger, and dual executive charts.
Download Production Model & Practice Checklist
To solidify your revenue forecasting and variance modeling skills, download the unlocked commercial model and verify your work against the self-audit checklist below.

Spreadsheet educator and web developer passionate about hands-on interactive spreadsheet practice.
Related Practical Exercises
Explore more hands-on spreadsheet models with downloadable practice workbooks.
 Finance
Budget vs Actual Variance Analysis Excel Template
Learn how to build a corporate OPEX budget vs actual variance model in Microsoft Excel featuring departmental cost ledgers, automated dollar variances, in-cell data bars, and executive reconciliation scorecards.
 Finance
Daily Cash Book Ledger Excel Template
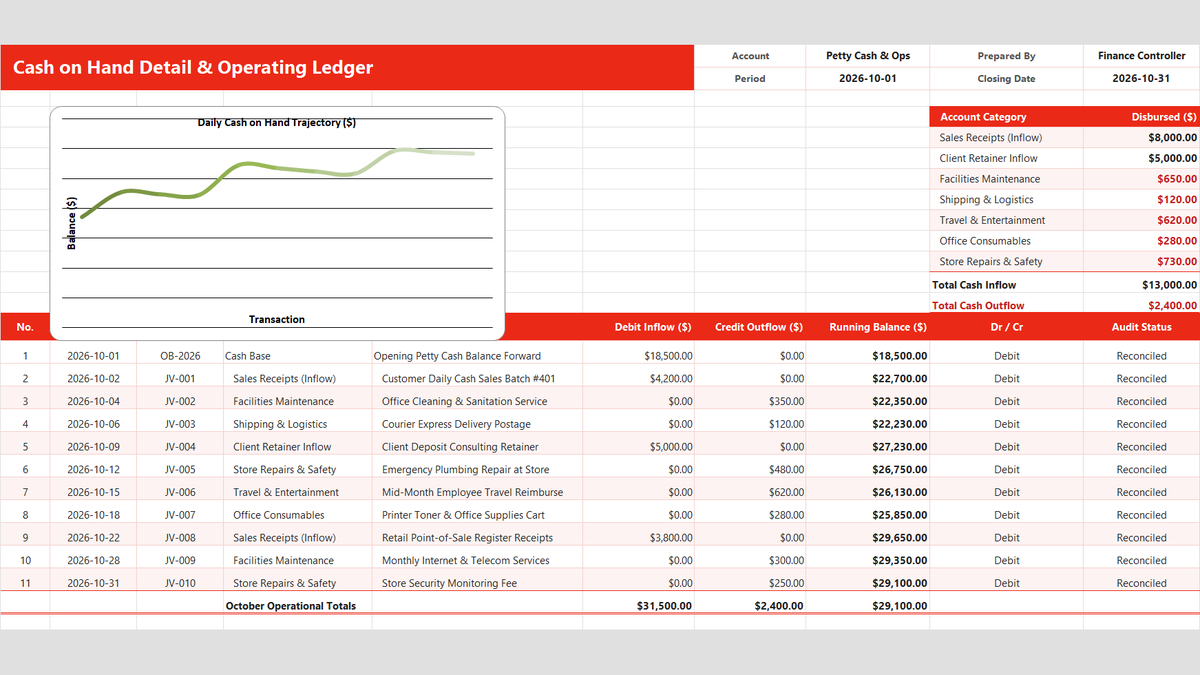
Keep track of physical cash, register receipts, and petty cash disbursements in Microsoft Excel. Build a daily cash book featuring category dropdowns with Data Validation, live running balance calculations, negative cash overdraft alerts, and month-end category expense rollups.
 Finance
12-Month Cash Flow Statement Excel Template
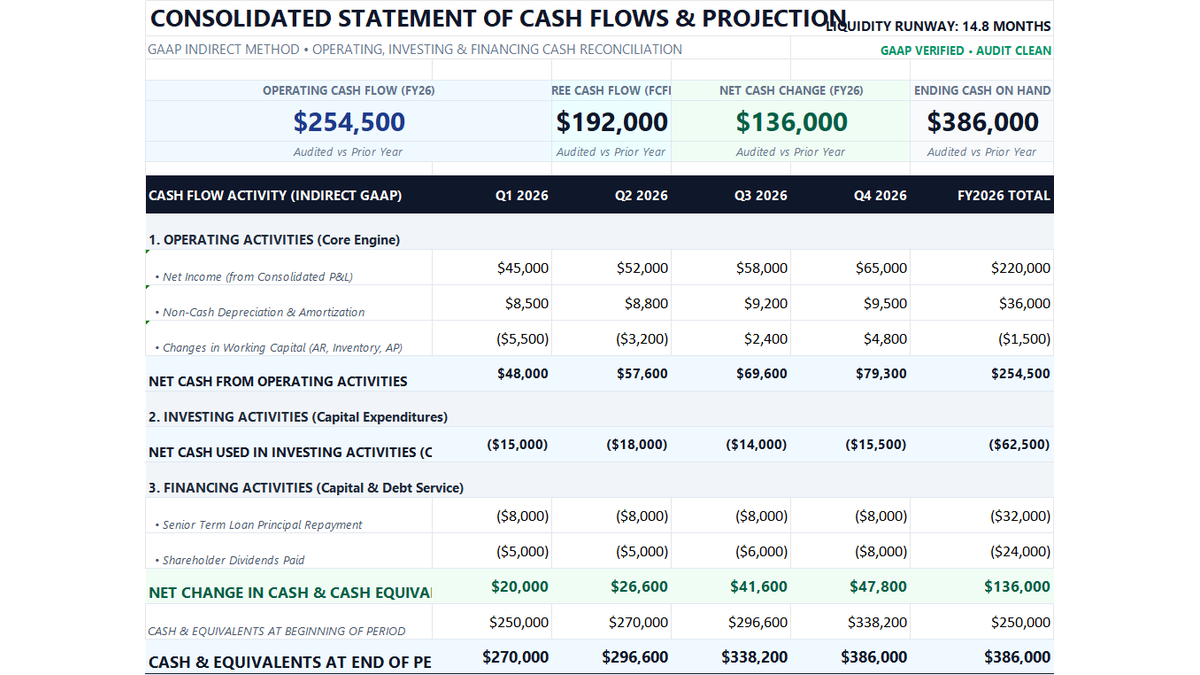
Learn how to construct a GAAP-compliant 12-month indirect cash flow statement in Microsoft Excel featuring working capital rollforwards, Free Cash Flow to Firm (FCFF), liquidity runway defense, and executive treasury scorecards.
 Finance
Commercial Sales Invoice Calculator Excel Template
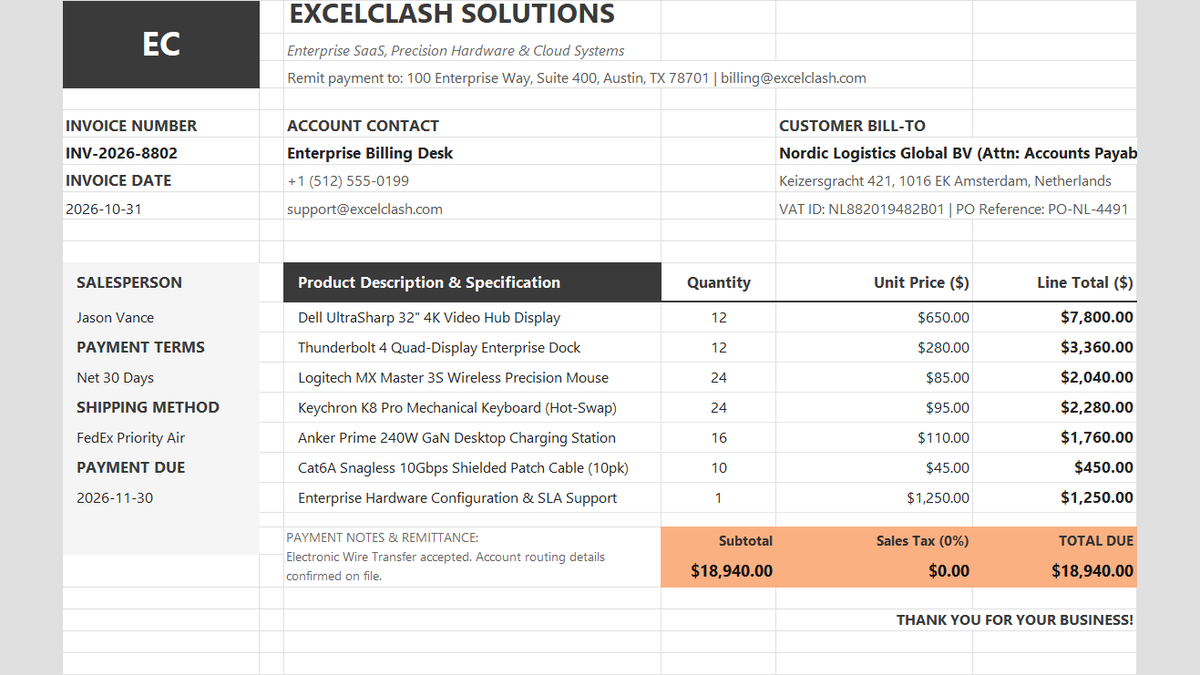
Tired of billing disputes and calculation errors holding up payments? Learn how to build a clean Commercial Sales Invoice in Excel that automatically computes line item subtotals, reconciles sales taxes, and presents payment terms clearly for corporate finance teams.
 Sales
Customer Retention Cohort Analysis Excel Template
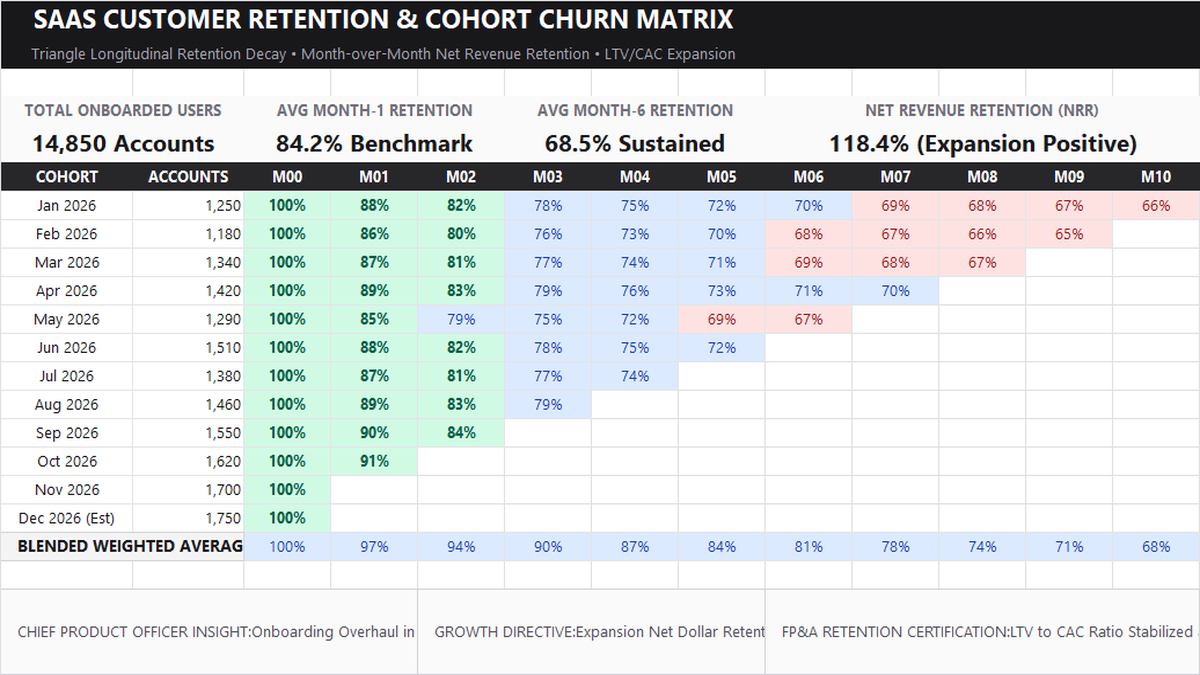
Learn SaaS subscription cohort modeling in Microsoft Excel. Build a triangular longitudinal customer retention matrix, calculate Month-1 through Month-10 decay rates, configure multi-color gradient heatmaps, and track executive LTV/CAC expansion metrics.
Discussion
Ask questions, share formula tips, or discuss alternative approaches with fellow spreadsheet builders.
Loading discussion...