On an accrual accounting income statement, a growing enterprise can report $220,000 in net profit while simultaneously teetering on the edge of insolvency. When aggressive customer credit terms leave $106,900 trapped in uncollected receivables and heavy warehouse inventory absorbs cash before suppliers demand settlement, paper profits cannot pay Friday payroll.
Corporate treasurers, finance directors, and CFOs understand that accounting profit is an opinion, but cash is a physical reality. Navigating capital expenditure cycles, senior bank debt amortization, and liquidity covenants requires a rigorous indirect cash flow model that bridges bottom-line net income with bank balances.
In this comprehensive tutorial, we construct a production-ready Consolidated 12-Month Statement of Cash Flows in Microsoft Excel. Following the GAAP indirect method, this model details operating cash generation, investing capital commitments, financing distributions, and executive runway indicators to preserve solvency through volatile business cycles.
The Liquidity Paradox: Why Profitable Companies Still Go Bankrupt
Corporate growth consumes liquidity at an accelerating pace. When revenue doubles, trade receivables expand and warehouse shelves require forward purchasing long before cash is received from clients. In financial management, this dynamic creates the dangerous "Growth Trap":
1. The Working Capital Absorption Sinkhole: An increase in Accounts Receivable represents recognized revenue that hasn’t entered the bank account. When combined with bulk inventory prepayments, operating working capital acts as a severe cash drag during rapid expansion.
2. Non-Cash Accounting Distortions: Net income is burdened by non-cash charges such as plant depreciation and software amortization. Treasury controllers must systematically add back these non-cash deductions to evaluate raw cash generation.
3. Unsynchronized Debt Covenants: Commercial lenders enforce strict minimum cash reserve covenants (e.g., maintaining at least $200,000 liquid cash or 12.0 months of runway). Violating these covenants can trigger loan acceleration even when the business is commercially sound.
By modeling the three GAAP cash streams with institutional precision, finance leaders secure complete forward visibility over capital deployment.
Financial Statement Blueprint: The Three-Stream GAAP Cash Architecture
A professional statement of cash flows segregates capital movement into three distinct functional streams, pinned beneath top-level treasury liquidity scorecards.
Our consolidated single-sheet model spans rows 4 through 22 for the primary statement, accompanied by a dynamic working capital balance sheet rollforward ledger across rows 25 through 32.
Review the schema below to understand how the three cash flow sections function across columns B through G.
| Col | Field Name | Type | Format | Operational Role |
|---|---|---|---|---|
| B | Cash Flow Activity | Text | General | GAAP indirect line item (Net Income, D&A, Working Capital, CapEx, Financing). |
| C | Q1 2026 | Currency / Formula | $#,##0;($#,##0) | Audited first quarter cash movements across operational activities. |
| D | Q2 2026 | Currency / Formula | $#,##0;($#,##0) | Second quarter cash flows reflecting spring capital expenditure peaks. |
| E | Q3 2026 | Currency / Formula | $#,##0;($#,##0) | Third quarter cash flows incorporating seasonal receivable collections. |
| F | Q4 2026 | Currency / Formula | $#,##0;($#,##0) | Fourth quarter closing cash flows with year-end dividend allocations. |
| G | FY2026 Total | Formula (Currency) | $#,##0;($#,##0) | Annual consolidated cash flow totals across full 12-month period. |
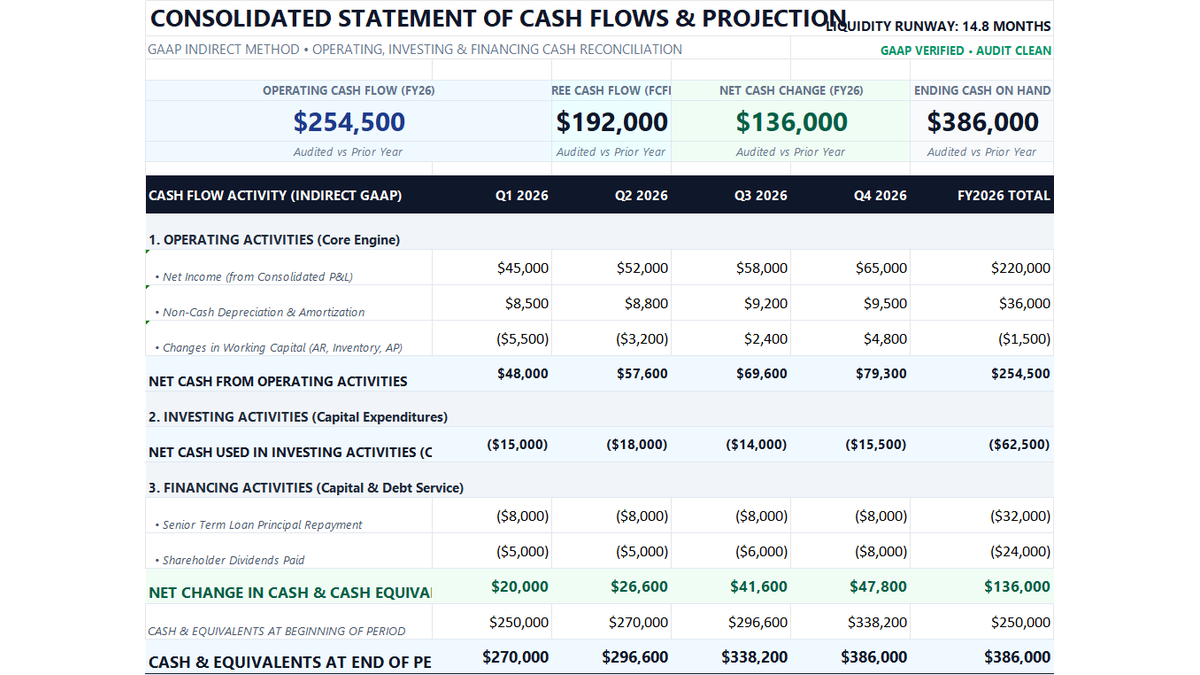
Workbook Blueprint: The Consolidated Cash Flow Statement architecture displaying executive runway scorecards, the three-stream GAAP schedule, and working capital rollforwards.
Now that the GAAP architecture is defined, let us build the core operating cash formulas, FCFF metrics, and runway indicators.
Step-by-Step Financial Modeling: Reconciling Cash Flow from Net Income
Follow this structured step-by-step sequence to construct the operating cash bridges, investing deductions, financing schedules, and institutional formatting directly inside Microsoft Excel.
1Step 1: Bridging Operating Cash Flow from GAAP Net Income
Under the GAAP indirect method, operating cash flow starts with Net Income from the consolidated P&L, adds back non-cash Depreciation & Amortization, and adjusts for balance sheet working capital shifts.
Select cell C14 and aggregate the core operating drivers: =SUM(C11:C13).
In Q1 2026, Net Income of $45,000 combines with $8,500 in non-cash D&A and a ($5,500) working capital drag, resulting in $48,000 net cash from operating activities.
Replicate this formula across columns D through F and consolidate full-year operations in cell G14: =SUM(C14:F14), delivering an annual core cash yield of $254,500.
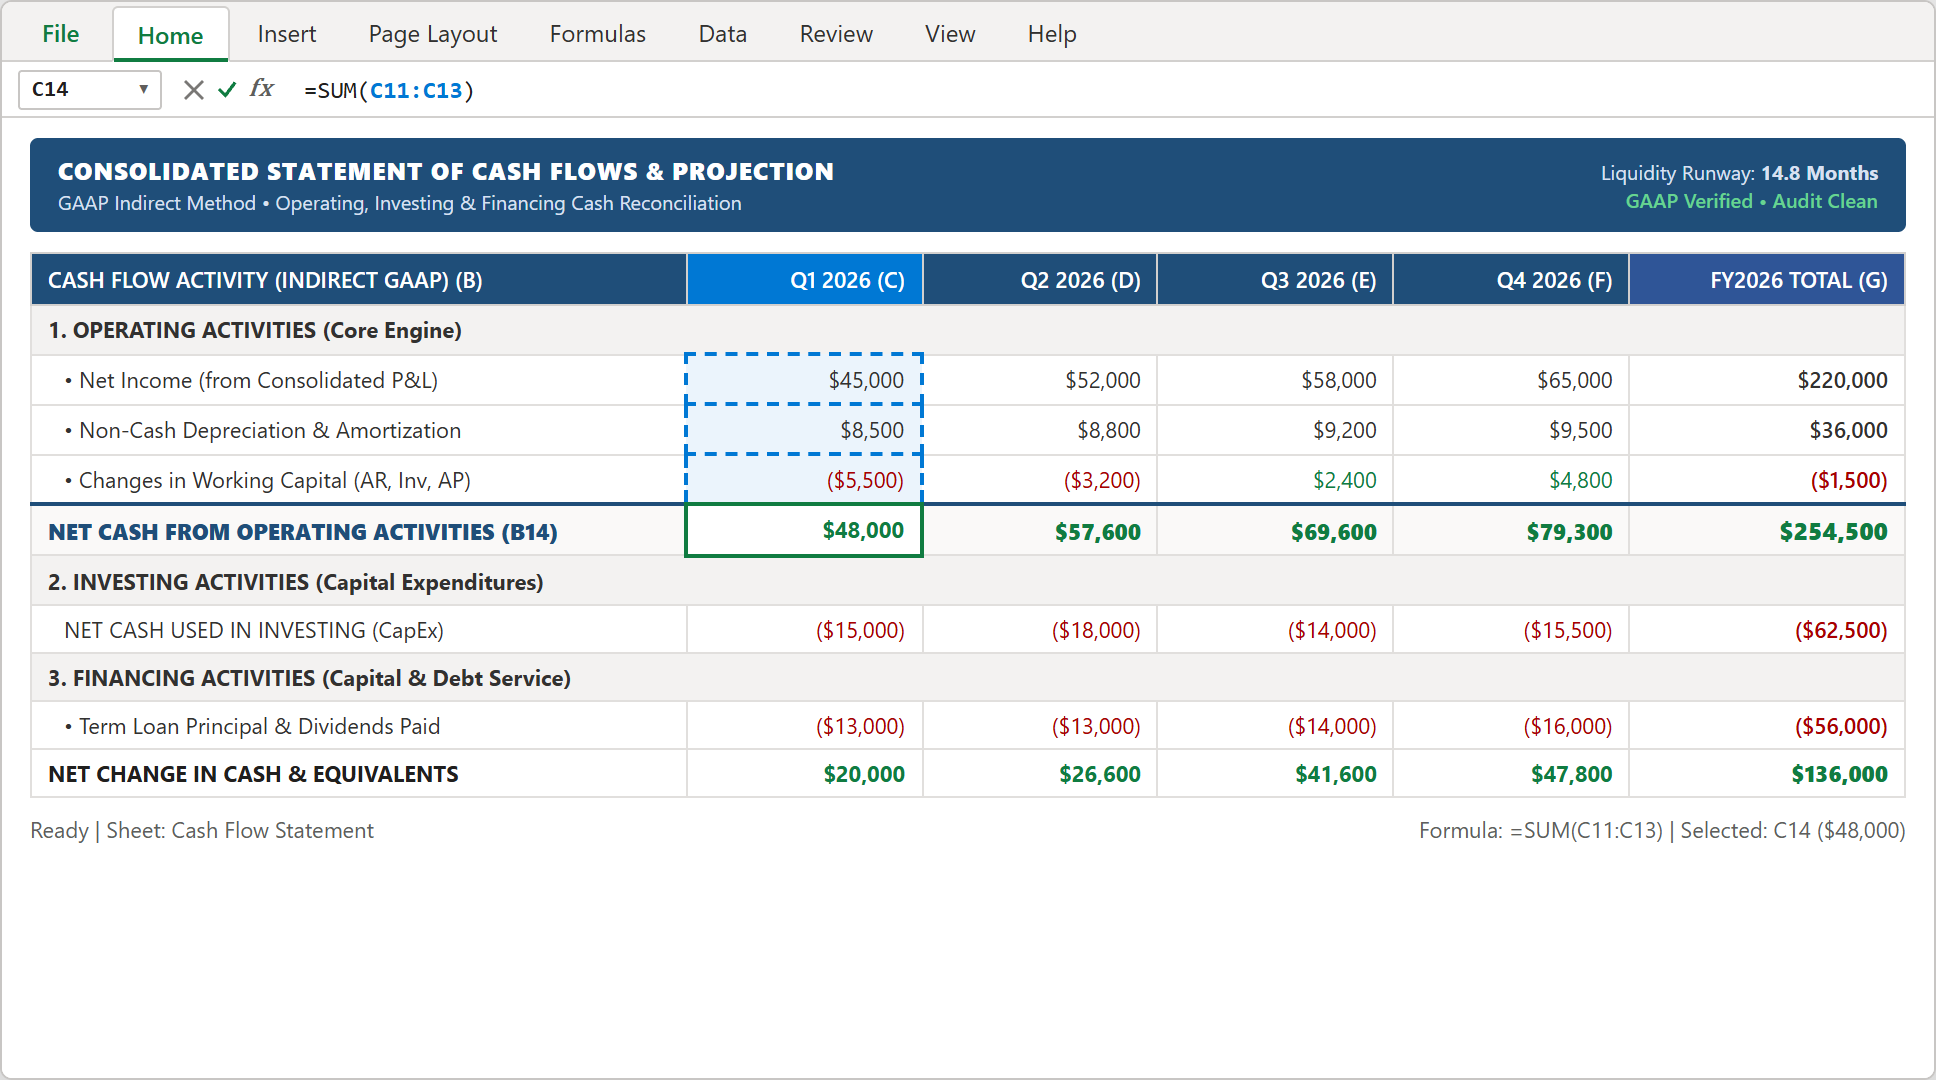
Step 1: Cell C14 formula bar active with =SUM(C11:C13) consolidating net income, non-cash D&A, and working capital changes.
2Step 2: Calculating Free Cash Flow to Firm (FCFF)
Operating cash demonstrates how well your core business generates cash, but investors and corporate treasurers focus on Free Cash Flow to Firm (FCFF): the surplus cash remaining after maintaining productive physical infrastructure.
In executive scorecard cell D5, calculate full-year Free Cash Flow by adding Net Operating Cash Flow (cell G14) to Capital Expenditures (cell G16): =G14+G16.
Because CapEx represents a cash outflow entered as a negative value (-$62,500), adding it evaluates $254,500 + (-$62,500), yielding exactly $192,000 in free cash flow.
This $192,000 represents the unencumbered capital available to service bank debt, distribute shareholder dividends, or fund strategic acquisitions.
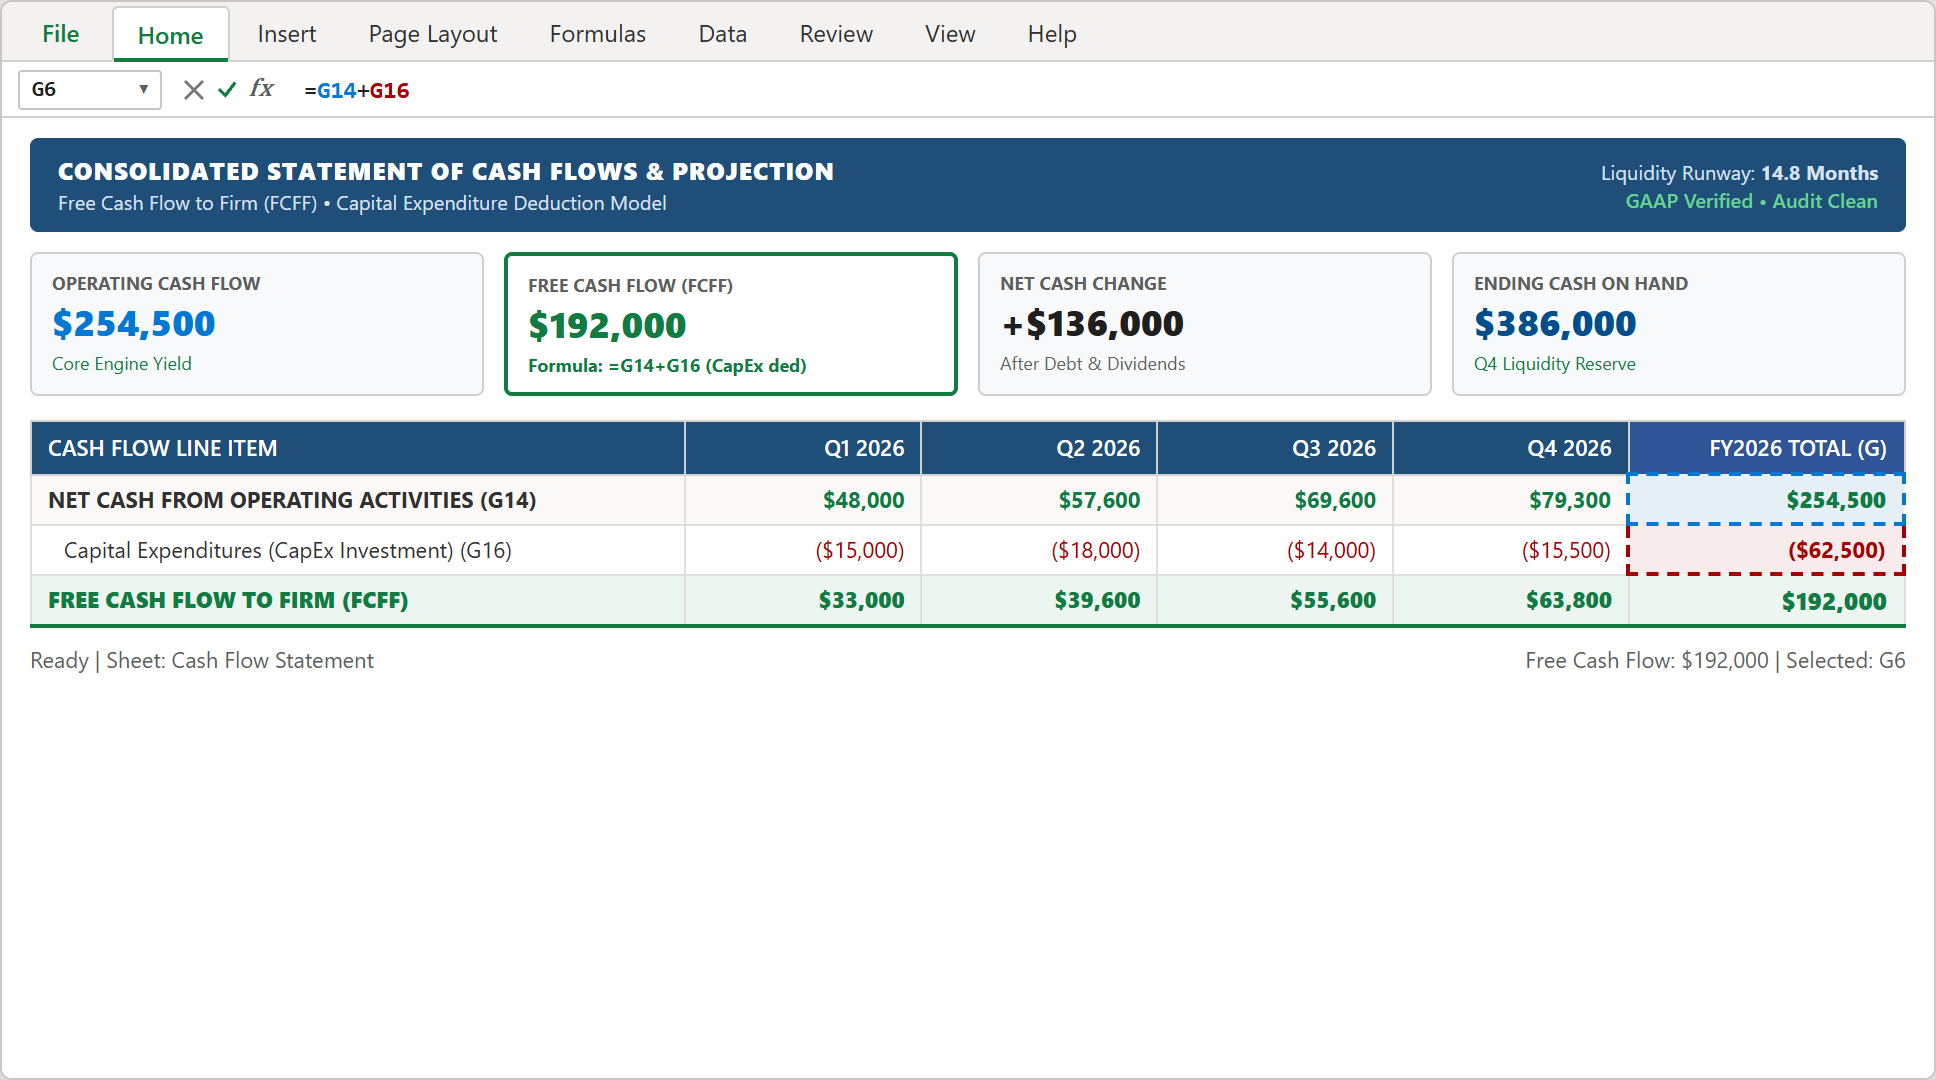
Step 2: Executive scorecard cell D5 calculating $192,000 in Free Cash Flow to Firm after deducting annual CapEx investments.
3Step 3: Forecasting 12-Month Cash Runway and Liquidity Buffer
In liquidity risk management, treasurers monitor runway: how many months could the company survive if customer revenues suddenly dropped to zero?
In top header cell G2, calculate the Liquidity Runway: =ROUND(G22/(((G16+G18+G19)*-1)/12), 1).
This formula divides closing liquid cash ($386,000 in cell G22) by average monthly structural cash outflows across CapEx, debt service, and dividend commitments. The calculation yields 14.8 Months of unassisted operational runway.
Because standard corporate solvency policy requires maintaining at least 12.0 months of liquidity runway, this confirms an institutional green light.
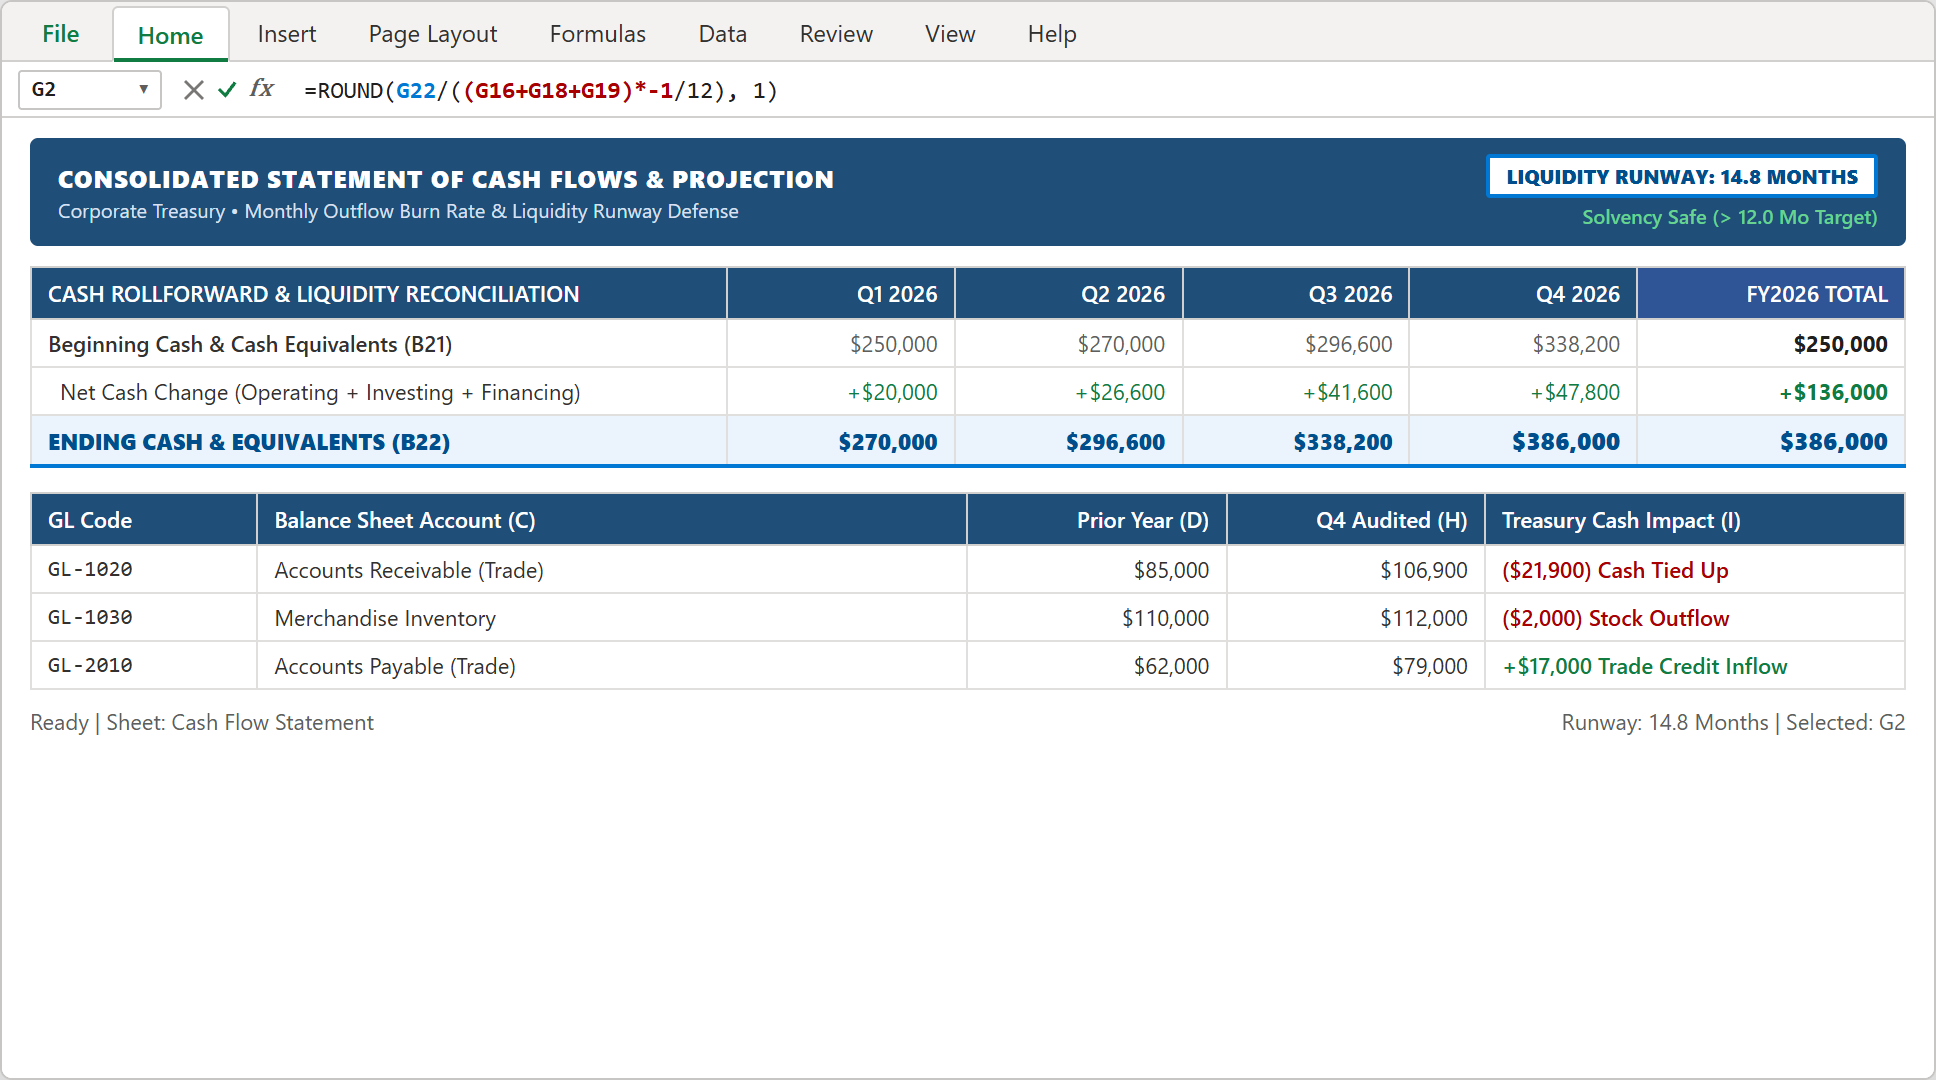
Step 3: Header callout cell G2 displaying a 14.8-month liquidity runway based on year-end closing cash reserves.
4Step 4: Formatting Cash Outflows with Institutional Parentheses
In executive financial reporting, negative signs (-$15,000) create visual clutter and risk confusion with dashes or bullets. Professional GAAP statements format all negative cash outflows inside accounting parentheses.
Select all cash outflow rows (C16:G16, C18:G19), press Ctrl + 1 to access the Format Cells dialog, and choose Accounting.
Set decimal places to 0 and select the dollar sign ($) symbol. Excel applies the institutional format mask: $#,##0;($#,##0);"-".
Outflows such as quarterly CapEx immediately transform into elegant, boardroom-ready representations: ($15,000), ($18,000), and ($62,500).
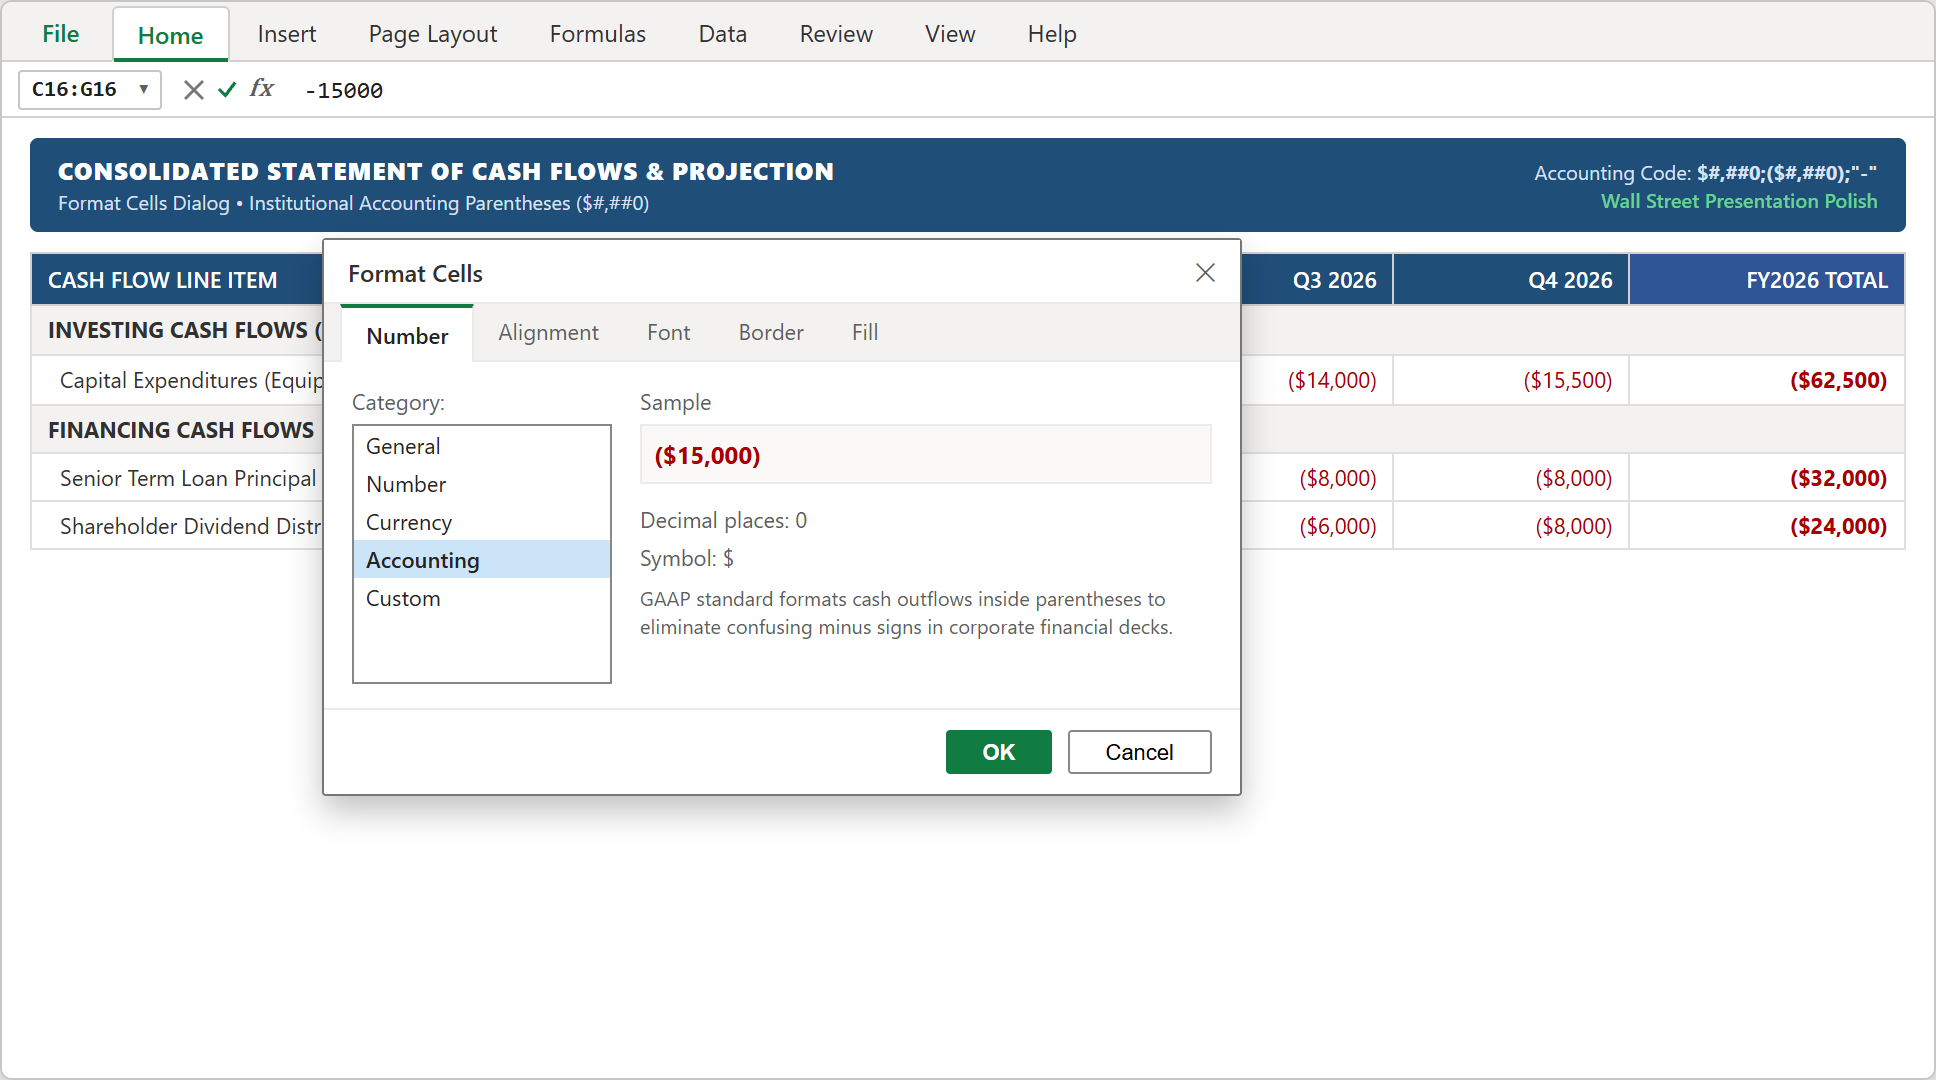
Step 4: The Format Cells dialog setting the institutional accounting format mask ($#,##0) for cash outflows.
5Step 5: Corporate Liquidity Scorecard: Executive Cash Balance Reconciliation
Our final implementation step closes the cash rollforward loop and ties the statement back to the corporate balance sheet.
In cell G20, calculate consolidated Net Change in Cash: =SUM(G14, G16, G18, G19), totaling +$136,000. In cell G21, reference beginning cash on January 1st: $250,000.
In closing cash cell G22 (and mirrored in KPI card G5), sum beginning cash and net change: =G21+G20, arriving at an ending liquid balance of $386,000. Format cell G22 with classic double-underline accounting borders to verify reconciliation against GL Account GL-1010.
This completes the cash bridge, providing CFOs with verified reconciliation between accounting net income and actual cash balances.
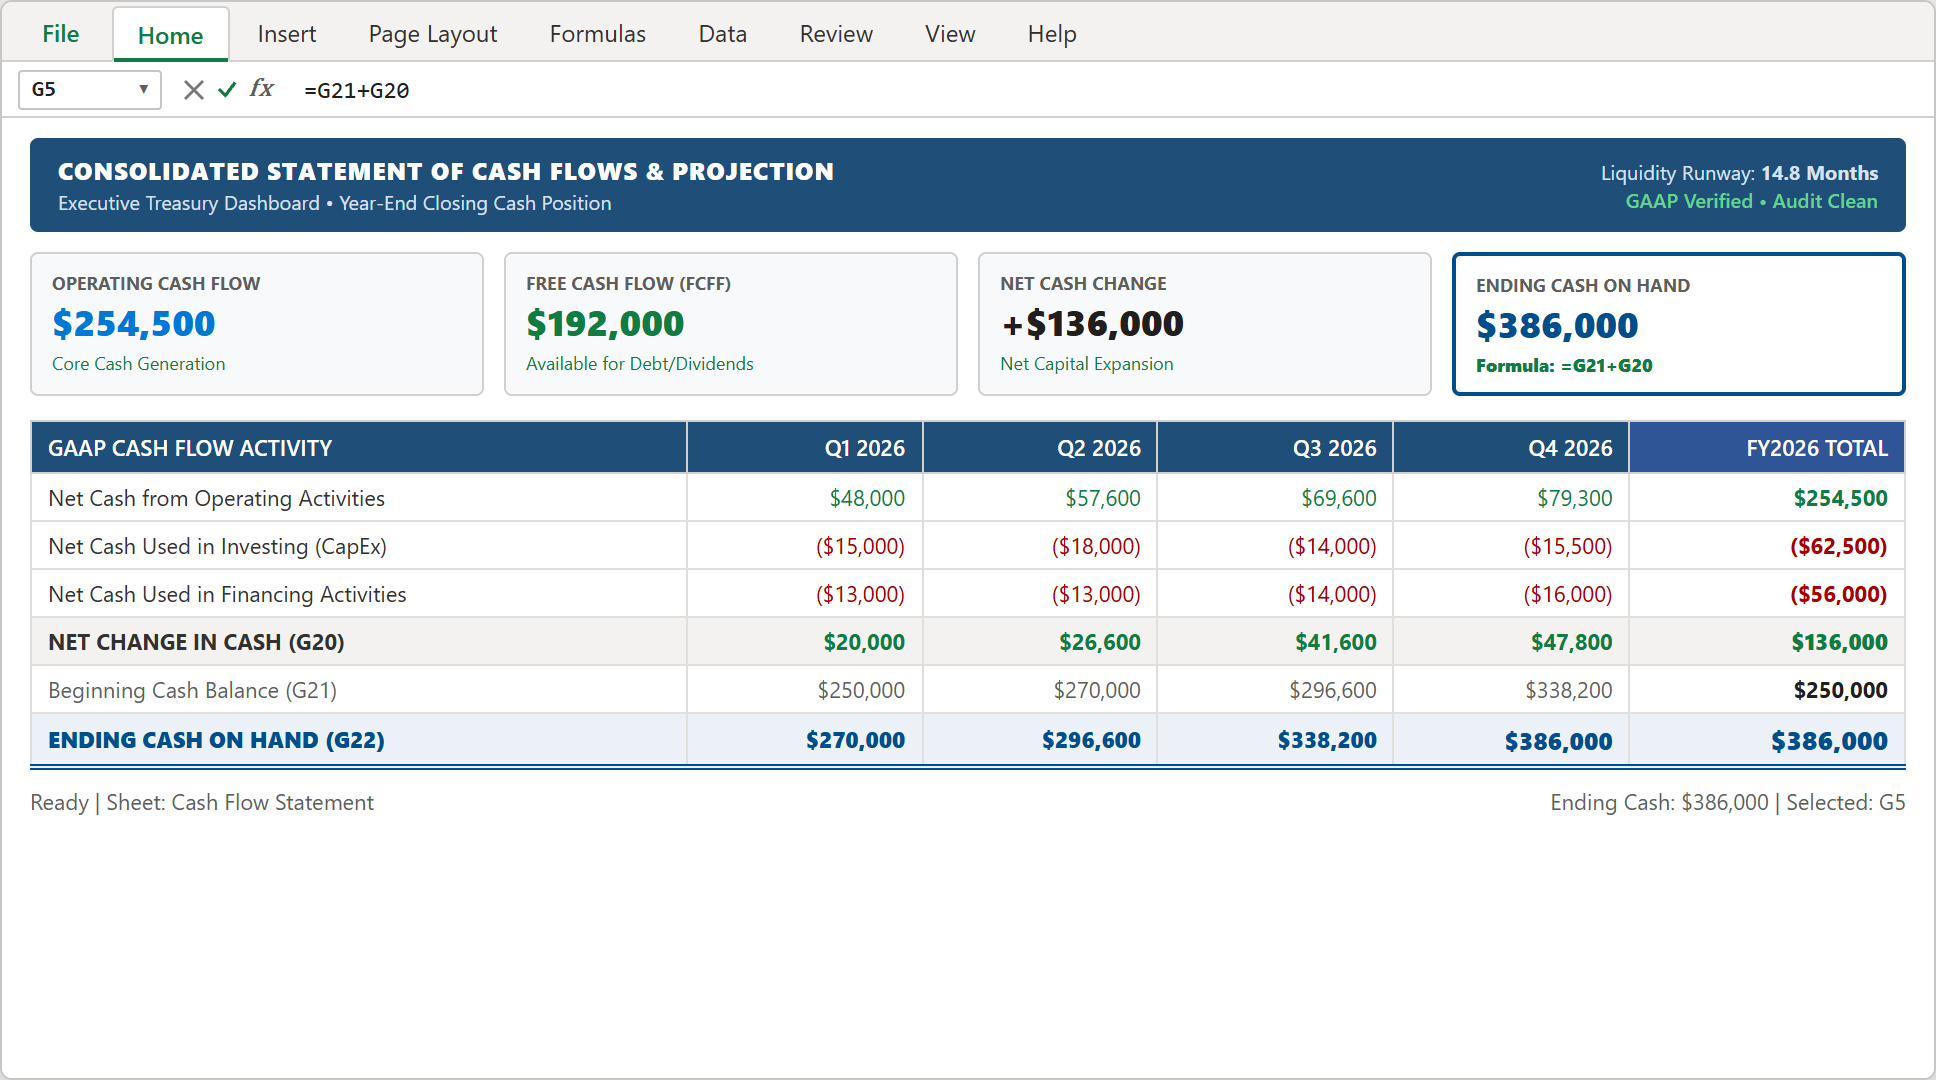
Step 5: Completed statement of cash flows featuring $386,000 ending cash, +$136,000 net change, and verified balance sheet rollforward.
CFO Treasury Playbook: Rolling 13-Week Cash Forecasts & Banking Covenant Defense
An annual statement of cash flows provides essential strategic direction, but maintaining solvency requires continuous treasury vigilance. Implement these four operational protocols to safeguard your balance sheet:
1. The Rolling 13-Week Cash Forecast: While annual models evaluate fiscal-year targets, weekly operations must be steered using a rolling 13-week direct cash forecast updated every Monday morning to identify near-term collection dry spells.
2. Strict Working Capital Discipline: Enforce Day Sales Outstanding (DSO) targets. If trade receivables age past 45 days, pause new credit releases until overdue customer balances are collected to prevent working capital traps.
3. CapEx Staging Triggers: Discretionary equipment purchases in row 16 should be contingent on operating cash flow benchmarks. If Q2 operating cash dips below $50,000, automatically defer uncommitted CapEx projects until Q3 collections recover.
4. Banking Covenant Early Warnings: Maintain an automated buffer alert: if projected ending cash dips below 120% of your bank loan minimum covenant (e.g., falling near $240,000 against a $200,000 covenant floor), notify the treasury committee immediately to arrange working capital credit facilities.
By integrating these institutional treasury protocols with your Microsoft Excel cash flow statement, your organization builds enduring financial resilience and commanding capital control.

Spreadsheet educator and web developer passionate about hands-on interactive spreadsheet practice.
Related Practical Exercises
Explore more hands-on spreadsheet models with downloadable practice workbooks.
 Finance
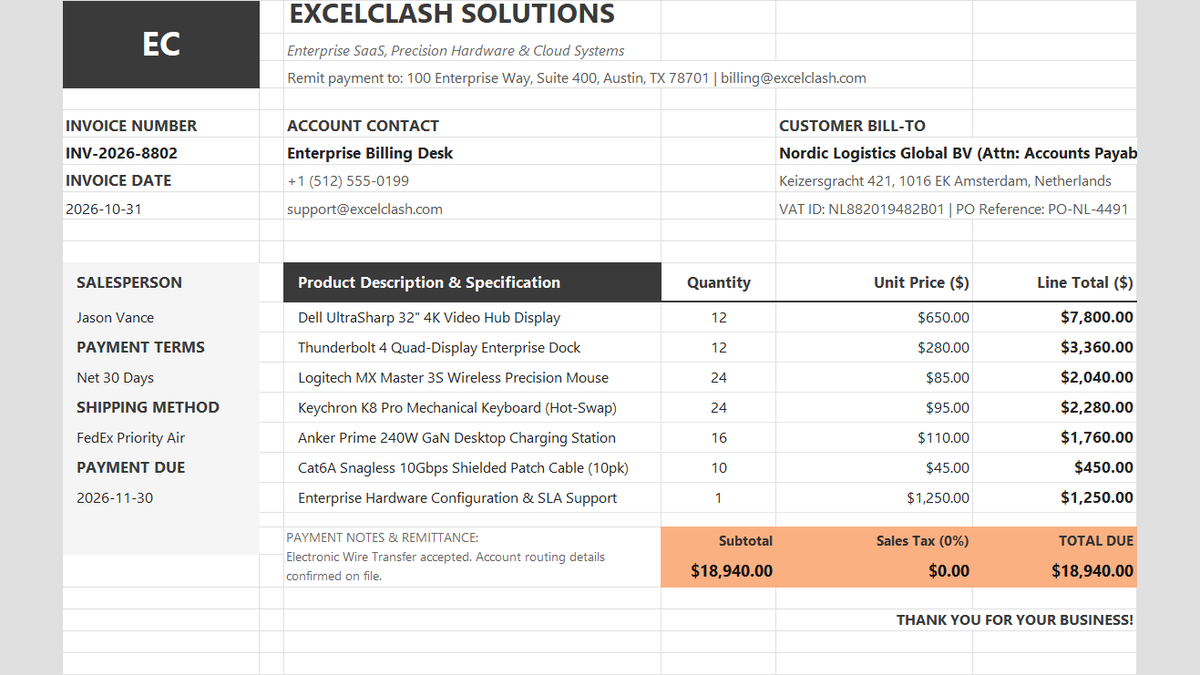
Commercial Sales Invoice Calculator Excel Template
Tired of billing disputes and calculation errors holding up payments? Learn how to build a clean Commercial Sales Invoice in Excel that automatically computes line item subtotals, reconciles sales taxes, and presents payment terms clearly for corporate finance teams.
 Sales
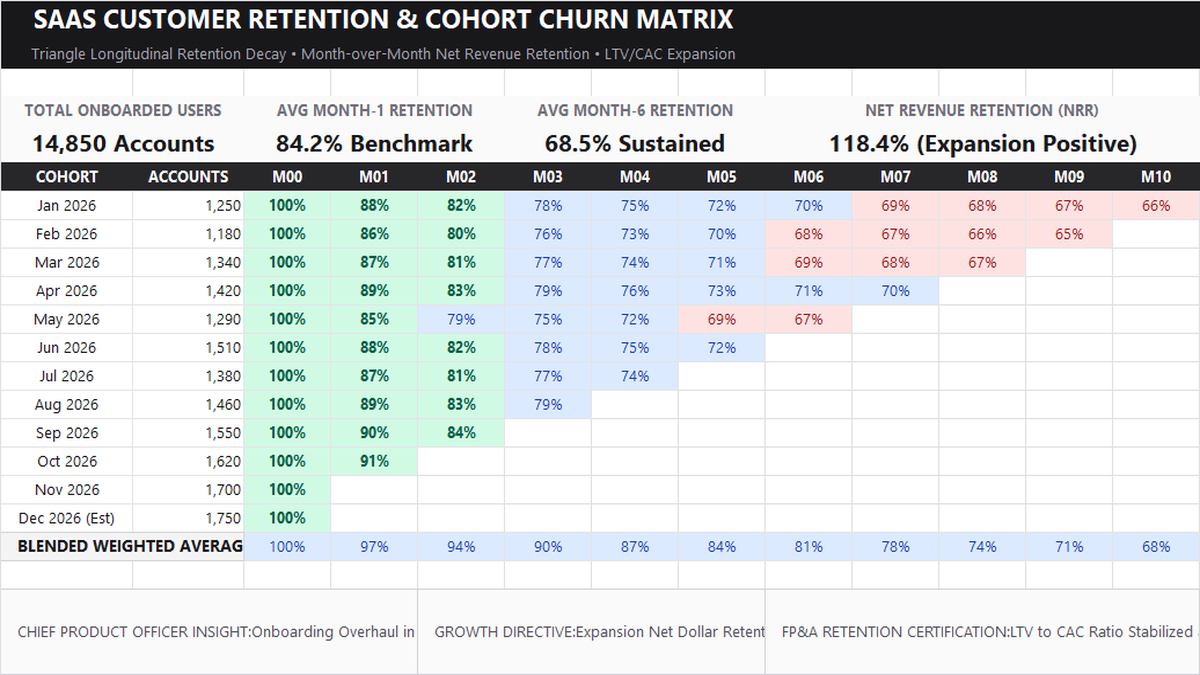
Customer Retention Cohort Analysis Excel Template
Learn SaaS subscription cohort modeling in Microsoft Excel. Build a triangular longitudinal customer retention matrix, calculate Month-1 through Month-10 decay rates, configure multi-color gradient heatmaps, and track executive LTV/CAC expansion metrics.
 Operations
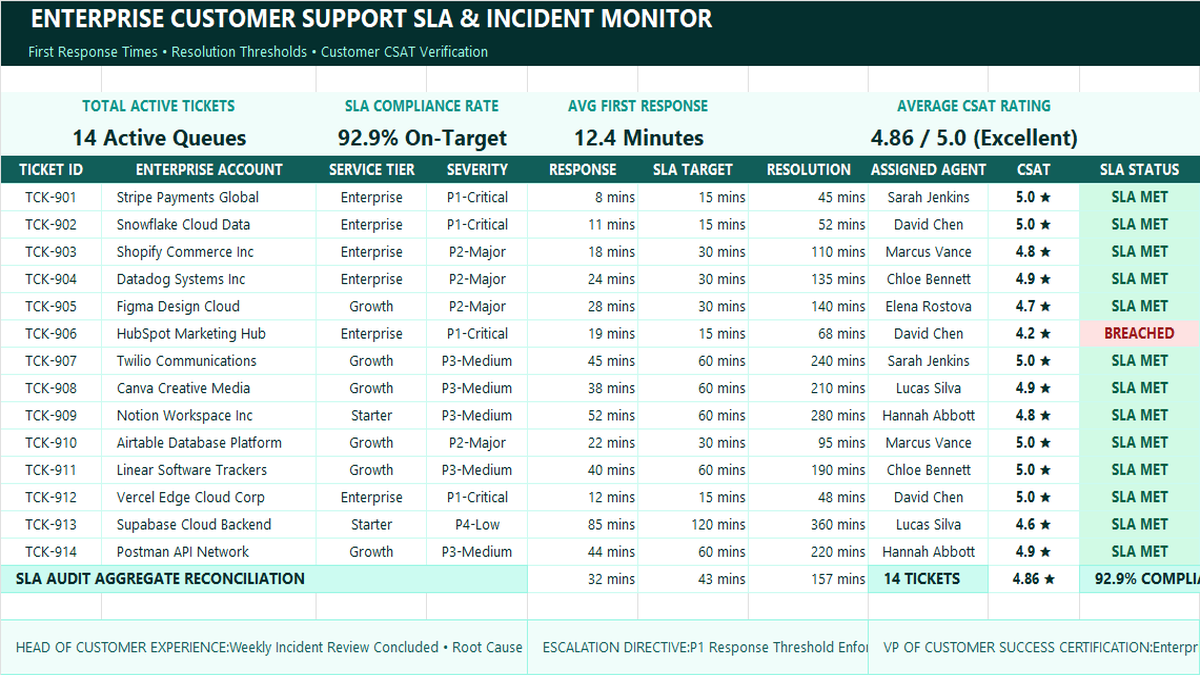
Customer Support SLA Tracker Excel Template
Learn how to build an enterprise customer support SLA tracker in Microsoft Excel featuring severity-based response thresholds, automated breach alerts, team velocity metrics, and CSAT satisfaction scorecards.
 Operations
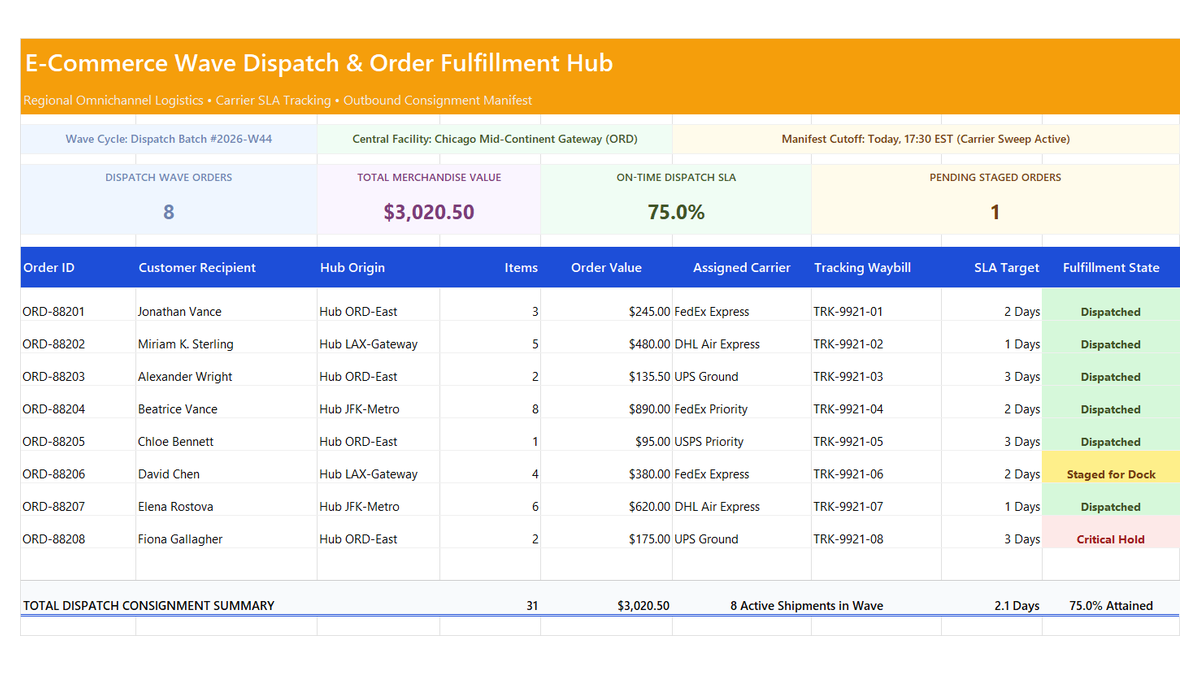
E-Commerce Order Fulfillment Tracker Excel Template
Learn how to engineer an e-commerce order fulfillment tracker in Microsoft Excel featuring wave dispatch cycles, carrier SLA attainment ratios, staged order monitors, and fulfillment manifest scorecards.
 Human Resources
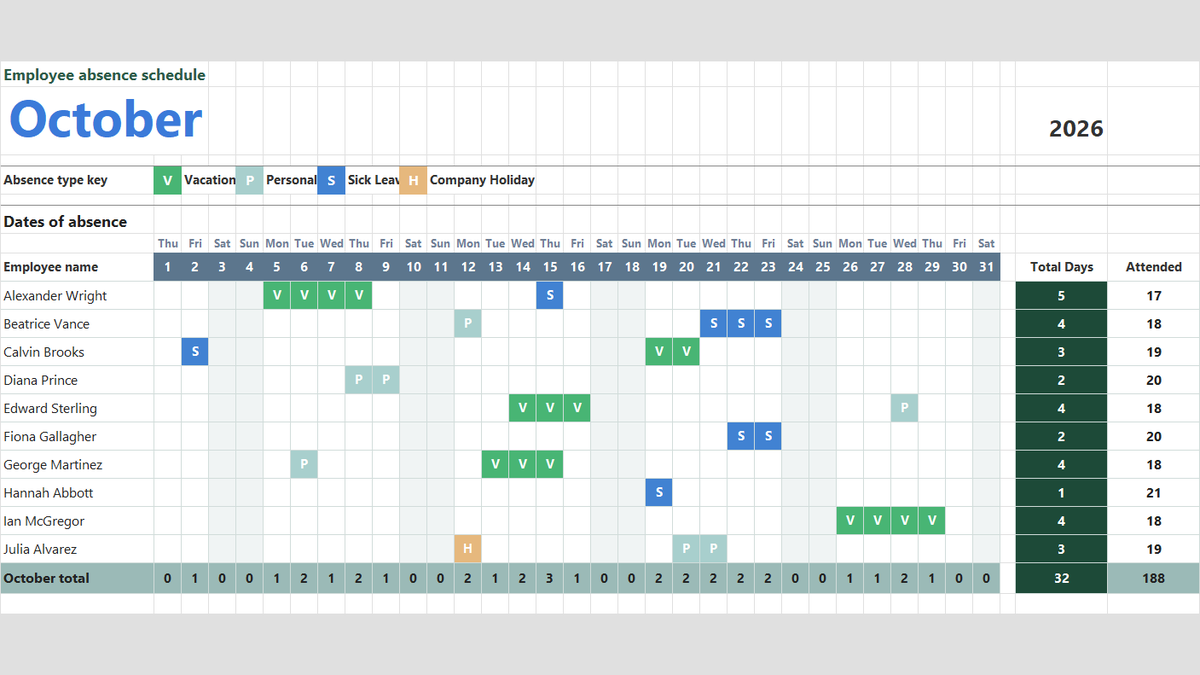
Employee Attendance Tracker Excel Template
Manage team attendance, vacation days, and sick leave in Microsoft Excel. Build a clean monthly absence schedule featuring dropdown absence keys with Data Validation, automatic color-coded badges via Conditional Formatting, and dynamic attendance totals with COUNTA.
Discussion
Ask questions, share formula tips, or discuss alternative approaches with fellow spreadsheet builders.
Loading discussion...